Races in Franconia, New Hampshire (NH) Detailed Stats
Ancestries, Foreign-born residents, place of birth

Recent posts about races in Franconia, New Hampshire on our local forum with over 2,400,000 registered users:
 | Possible Relocation to New Hampshire (30 replies) |
| Things to do near Gorham NH (4 replies) |
| Moving too Milan or Berlin from Tennessee. (24 replies) |
| Some ideas for relocation? (18 replies) |
| Considering moving to Northern New Hampshire (20 replies) |
| Leaving Tahoe for NH, need help with specifics (26 replies) |
Latest news about races in Franconia, NH collected exclusively by city-data.com from local newspapers, TV, and radio stations
4.4% of Franconia, NH residents are foreign-born (1.6% born in Asia, 1.4% born in Europe, 0.6% born in North America), which is 12.7% less than the foreign-born rate of 5.0% across the entire state of New Hampshire.
Race distribution in Franconia

- 90197.5%White alone
- 80.9%Asian alone
- 60.6%American Indian alone
- 50.5%Two or more races
- 30.3%Hispanic
- 10.1%Black alone

2000
2022
-
- 1,175,25295.1%White alone
- 20,4891.7%Hispanic
- 15,8031.3%Asian alone
- 11,6060.9%Two or more races
- 8,3540.7%Black alone
- 2,6980.2%American Indian alone
- 1,2540.1%Other race alone
- 3300.03%Native Hawaiian and Other
Pacific Islander alone

-
- 1,208,10186.6%White alone
- 63,4794.5%Hispanic
- 60,7244.4%Two or more races
- 36,5192.6%Asian alone
- 17,9311.3%Black alone
- 6,6150.5%Other race alone
- 1,0140.07%American Indian alone
- 8480.06%Native Hawaiian and Other
Pacific Islander alone

Income and house value in Franconia
- Median household income in 2022
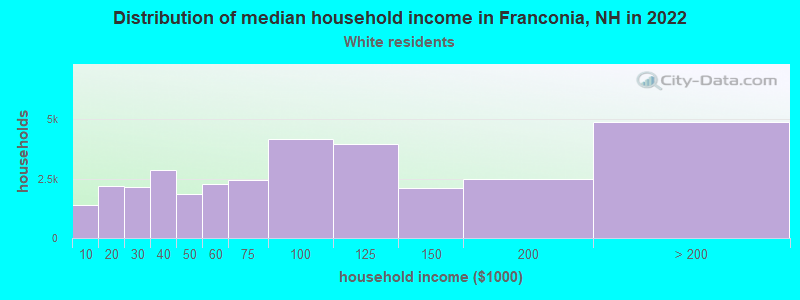
- $77,730White non-Hispanic householders
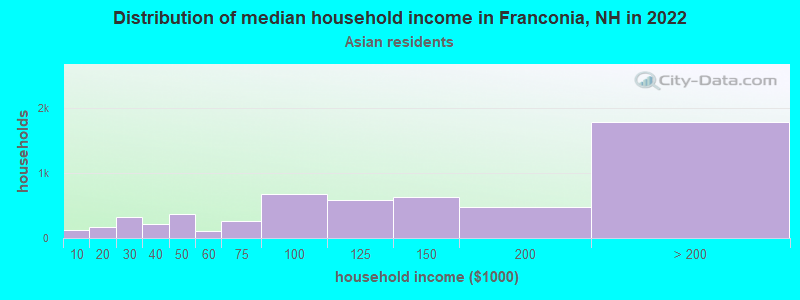
- $101,223Asian householders
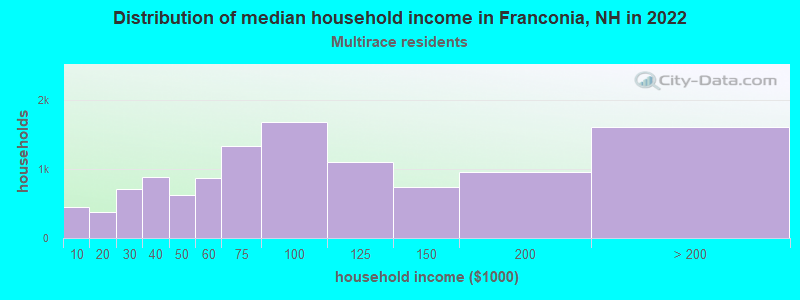
- $99,070Two or more races householders
- Median 2022 house value
- $452,266White Non-Hispanic householders
- $359,575Asian householders
Household income for White non-Hispanic householders
Household income for Black householders

Household income for Asian householders
Household income for Two or more races householders
Foreign-born residents in Franconia
41 residents are foreign born (1.6% Asia, 1.4% Europe, 0.6% North America).
| This city: | 4.4% |
| New Hampshire: | 4.4% |
Ancestries in Franconia

- 36229.2%English
- 18114.6%Irish
- 12510.1%Scottish
- 1129.0%German
- 1068.6%French
- 685.5%Italian
- 685.5%Other
- 403.2%Scotch-Irish
- 352.8%United States
- 322.6%French Canadian
- 241.9%Polish
- 241.9%Swedish
- 121.0%Dutch
- 100.8%Portuguese
- 70.6%Russian
- 50.4%Arab
- 50.4%Danish
- 40.3%Czech
- 40.3%Hungarian
- 40.3%Welsh
- 30.2%Lithuanian
- 30.2%Norwegian
- 20.2%Slovak
- 20.2%Subsaharan African

Zip codes: 03580.