Races in Georgetown, Georgia (GA) Detailed Stats
Data:
Races - White alone (%)
Races - White alone (% change since 2000)
Races - Black alone (%)
Races - Black alone (% change since 2000)
Races - American Indian alone (%)
Races - American Indian alone (% change since 2000)
Races - Asian alone (%)
Races - Asian alone (% change since 2000)
Races - Hispanic (%)
Races - Hispanic (% change since 2000)
Races - Native Hawaiian and Other Pacific Islander alone (%)
Races - Native Hawaiian and Other Pacific Islander alone (% change since 2000)
Races - Two or more races(%)
Races - Two or more races(% change since 2000)
Races - Other race alone (%)
Races - Other race alone (% change since 2000)
Racial diversity
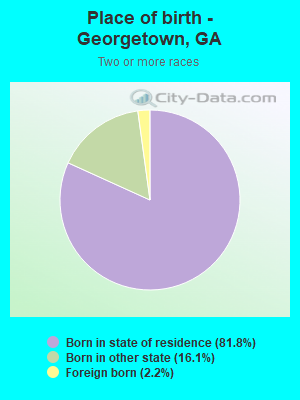
Place of birth - Born in state of residence (%)
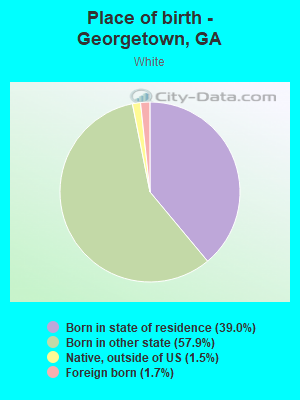
Place of birth - Born in state of residence (%) - White
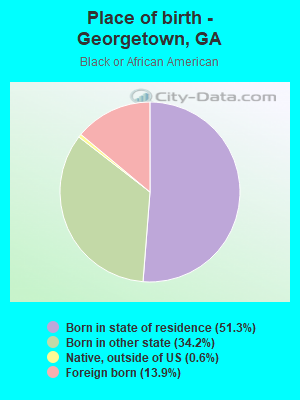
Place of birth - Born in state of residence (%) - Black or African American
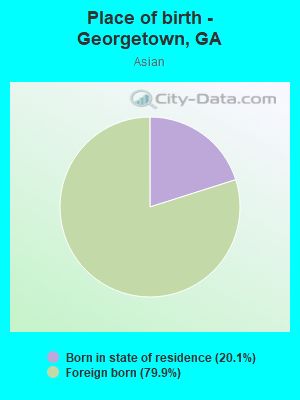
Place of birth - Born in state of residence (%) - Asian
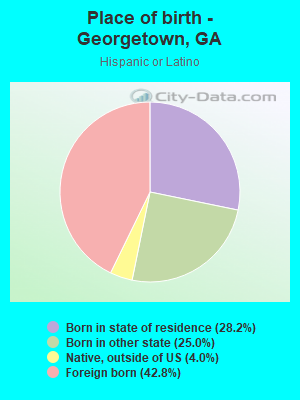
Place of birth - Born in state of residence (%) - Hispanic or Latino
Place of birth - Born in state of residence (%) - American Indian and Alaska Native
Place of birth - Born in state of residence (%) - Multirace
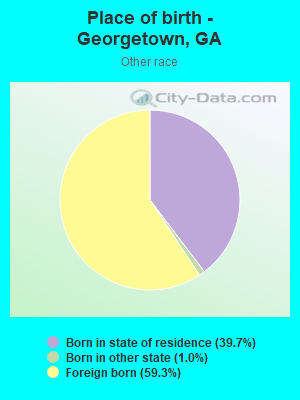
Place of birth - Born in state of residence (%) - Other Race
Place of birth - Born in other state (%)
Place of birth - Born in other state (%) - White
Place of birth - Born in other state (%) - Black or African American
Place of birth - Born in other state (%) - Asian
Place of birth - Born in other state (%) - Hispanic or Latino
Place of birth - Born in other state (%) - American Indian and Alaska Native
Place of birth - Born in other state (%) - Multirace
Place of birth - Born in other state (%) - Other Race
Place of birth - Native, outside of US (%)
Place of birth - Native, outside of US (%) - White
Place of birth - Native, outside of US (%) - Black or African American
Place of birth - Native, outside of US (%) - Asian
Place of birth - Native, outside of US (%) - Hispanic or Latino
Place of birth - Native, outside of US (%) - American Indian and Alaska Native
Place of birth - Native, outside of US (%) - Multirace
Place of birth - Native, outside of US (%) - Other Race
Place of birth - Foreign born (%)
Place of birth - Foreign born (%) - White
Place of birth - Foreign born (%) - Black or African American
Place of birth - Foreign born (%) - Asian
Place of birth - Foreign born (%) - Hispanic or Latino
Place of birth - Foreign born (%) - American Indian and Alaska Native
Place of birth - Foreign born (%) - Multirace
Place of birth - Foreign born (%) - Other Race
Residents speaking English at home (%)
Residents speaking English at home - Born in the United States (%)
Residents speaking English at home - Native, born elsewhere (%)
Residents speaking English at home - Foreign born (%)
Residents speaking Spanish at home (%)
Residents speaking Spanish at home - Born in the United States (%)
Residents speaking Spanish at home - Native, born elsewhere (%)
Residents speaking Spanish at home - Foreign born (%)
Residents speaking other language at home (%)
Residents speaking other language at home - Born in the United States (%)
Residents speaking other language at home - Native, born elsewhere (%)
Residents speaking other language at home - Foreign born (%)
Marital status - Never married (%)
Marital status - Now married (%)
Marital status - Separated (%)
Marital status - Widowed (%)
Marital status - Divorced (%)
Ancestries Reported - Arab (%)
Ancestries Reported - Czech (%)
Ancestries Reported - Danish (%)
Ancestries Reported - Dutch (%)
Ancestries Reported - English (%)
Ancestries Reported - French (%)
Ancestries Reported - French Canadian (%)
Ancestries Reported - German (%)
Ancestries Reported - Greek (%)
Ancestries Reported - Hungarian (%)
Ancestries Reported - Irish (%)
Ancestries Reported - Italian (%)
Ancestries Reported - Lithuanian (%)
Ancestries Reported - Norwegian (%)
Ancestries Reported - Polish (%)
Ancestries Reported - Portuguese (%)
Ancestries Reported - Russian (%)
Ancestries Reported - Scotch-Irish (%)
Ancestries Reported - Scottish (%)
Ancestries Reported - Slovak (%)
Ancestries Reported - Subsaharan African (%)
Ancestries Reported - Swedish (%)
Ancestries Reported - Swiss (%)
Ancestries Reported - Ukrainian (%)
Ancestries Reported - United States (%)
Ancestries Reported - Welsh (%)
Ancestries Reported - West Indian (%)
Ancestries Reported - Other (%)
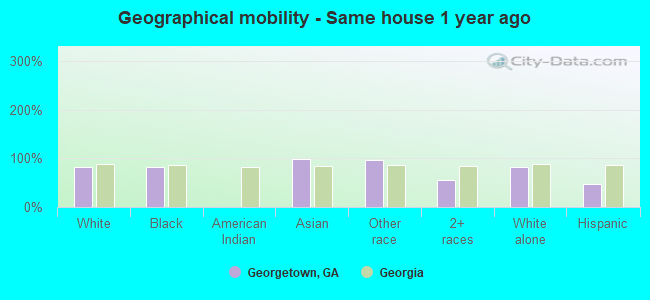
Geographical mobility - Same house 1 year ago (%)
Geographical mobility - Same house 1 year ago (%) - White
Geographical mobility - Same house 1 year ago (%) - Black or African American
Geographical mobility - Same house 1 year ago (%) - Asian
Geographical mobility - Same house 1 year ago (%) - Hispanic or Latino
Geographical mobility - Same house 1 year ago (%) - American Indian and Alaska Native
Geographical mobility - Same house 1 year ago (%) - Multirace
Geographical mobility - Same house 1 year ago (%) - Other Race
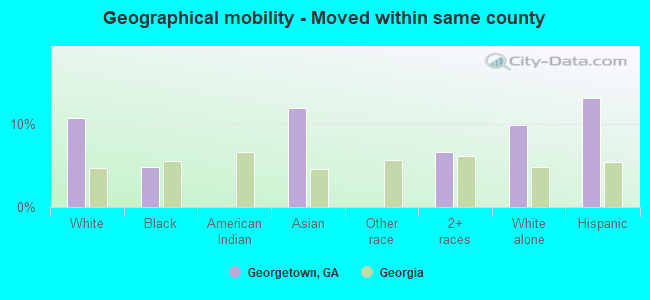
Geographical mobility - Moved within same county (%)
Geographical mobility - Moved within same county (%) - White
Geographical mobility - Moved within same county (%) - Black or African American
Geographical mobility - Moved within same county (%) - Asian
Geographical mobility - Moved within same county (%) - Hispanic or Latino
Geographical mobility - Moved within same county (%) - American Indian and Alaska Native
Geographical mobility - Moved within same county (%) - Multirace
Geographical mobility - Moved within same county (%) - Other Race
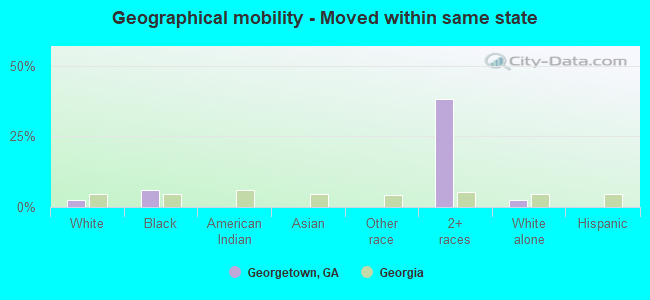
Geographical mobility - Moved from different county within same state (%)
Geographical mobility - Moved from different county within same state (%) - White
Geographical mobility - Moved from different county within same state (%) - Black or African American
Geographical mobility - Moved from different county within same state (%) - Asian
Geographical mobility - Moved from different county within same state (%) - Hispanic or Latino
Geographical mobility - Moved from different county within same state (%) - American Indian and Alaska Native
Geographical mobility - Moved from different county within same state (%) - Multirace
Geographical mobility - Moved from different county within same state (%) - Other Race
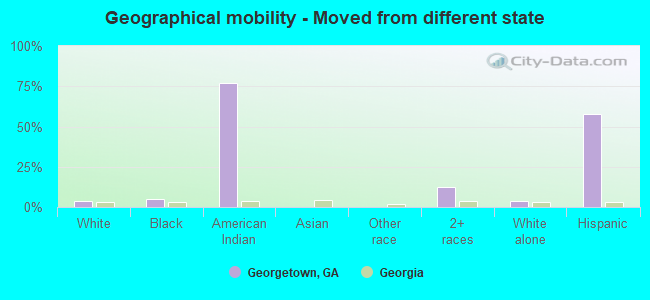
Geographical mobility - Moved from different state (%)
Geographical mobility - Moved from different state (%) - White
Geographical mobility - Moved from different state (%) - Black or African American
Geographical mobility - Moved from different state (%) - Asian
Geographical mobility - Moved from different state (%) - Hispanic or Latino
Geographical mobility - Moved from different state (%) - American Indian and Alaska Native
Geographical mobility - Moved from different state (%) - Multirace
Geographical mobility - Moved from different state (%) - Other Race
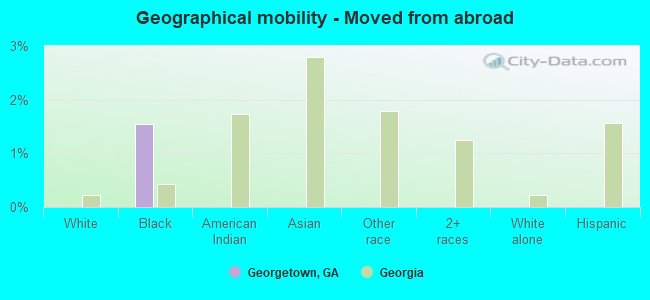
Geographical mobility - Moved from abroad (%)
Geographical mobility - Moved from abroad (%) - White
Geographical mobility - Moved from abroad (%) - Black or African American
Geographical mobility - Moved from abroad (%) - Asian
Geographical mobility - Moved from abroad (%) - Hispanic or Latino
Geographical mobility - Moved from abroad (%) - American Indian and Alaska Native
Geographical mobility - Moved from abroad (%) - Multirace
Geographical mobility - Moved from abroad (%) - Other Race
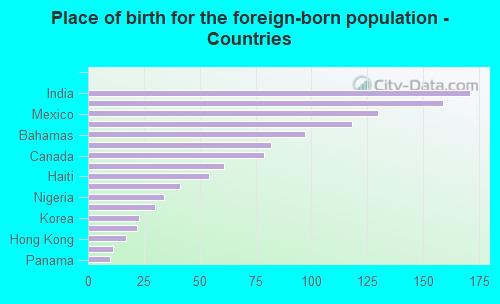
Place of birth for the foreign-born population - Ireland (%)
Place of birth for the foreign-born population - Denmark (%)
Place of birth for the foreign-born population - Norway (%)
Place of birth for the foreign-born population - Sweden (%)
Place of birth for the foreign-born population - United Kingdom (%)
Place of birth for the foreign-born population - England (%)
Place of birth for the foreign-born population - Scotland (%)
Place of birth for the foreign-born population - Other Northern Europe (%)
Place of birth for the foreign-born population - Austria (%)
Place of birth for the foreign-born population - Belgium (%)
Place of birth for the foreign-born population - France (%)
Place of birth for the foreign-born population - Germany (%)
Place of birth for the foreign-born population - Netherlands (%)
Place of birth for the foreign-born population - Switzerland (%)
Place of birth for the foreign-born population - Other Western Europe (%)
Place of birth for the foreign-born population - Greece (%)
Place of birth for the foreign-born population - Italy (%)
Place of birth for the foreign-born population - Portugal (%)
Place of birth for the foreign-born population - Spain (%)
Place of birth for the foreign-born population - Other Southern Europe (%)
Place of birth for the foreign-born population - Albania (%)
Place of birth for the foreign-born population - Belarus (%)
Place of birth for the foreign-born population - Bosnia and Herzegovina (%)
Place of birth for the foreign-born population - Bulgaria (%)
Place of birth for the foreign-born population - Croatia (%)
Place of birth for the foreign-born population - Czechoslovakia (%)
Place of birth for the foreign-born population - Hungary (%)
Place of birth for the foreign-born population - Latvia (%)
Place of birth for the foreign-born population - Lithuania (%)
Place of birth for the foreign-born population - North Macedonia (Macedonia) (%)
Place of birth for the foreign-born population - Moldova (%)
Place of birth for the foreign-born population - Poland (%)
Place of birth for the foreign-born population - Romania (%)
Place of birth for the foreign-born population - Russia (%)
Place of birth for the foreign-born population - Serbia (%)
Place of birth for the foreign-born population - Ukraine (%)
Place of birth for the foreign-born population - Other Eastern Europe (%)
Place of birth for the foreign-born population - China (%)
Place of birth for the foreign-born population - Hong Kong (%)
Place of birth for the foreign-born population - Taiwan (%)
Place of birth for the foreign-born population - Japan (%)
Place of birth for the foreign-born population - Korea (%)
Place of birth for the foreign-born population - Other Eastern Asia (%)
Place of birth for the foreign-born population - Afghanistan (%)
Place of birth for the foreign-born population - Bangladesh (%)
Place of birth for the foreign-born population - India (%)
Place of birth for the foreign-born population - Iran (%)
Place of birth for the foreign-born population - Kazakhstan (%)
Place of birth for the foreign-born population - Nepal (%)
Place of birth for the foreign-born population - Pakistan (%)
Place of birth for the foreign-born population - Sri Lanka (%)
Place of birth for the foreign-born population - Uzbekistan (%)
Place of birth for the foreign-born population - Other South Central Asia (%)
Place of birth for the foreign-born population - Burma (%)
Place of birth for the foreign-born population - Cambodia (%)
Place of birth for the foreign-born population - Indonesia (%)
Place of birth for the foreign-born population - Laos (%)
Place of birth for the foreign-born population - Malaysia (%)
Place of birth for the foreign-born population - Philippines (%)
Place of birth for the foreign-born population - Singapore (%)
Place of birth for the foreign-born population - Thailand (%)
Place of birth for the foreign-born population - Vietnam (%)
Place of birth for the foreign-born population - Other South Eastern Asia (%)
Place of birth for the foreign-born population - Armenia (%)
Place of birth for the foreign-born population - Iraq (%)
Place of birth for the foreign-born population - Israel (%)
Place of birth for the foreign-born population - Jordan (%)
Place of birth for the foreign-born population - Kuwait (%)
Place of birth for the foreign-born population - Lebanon (%)
Place of birth for the foreign-born population - Saudi Arabia (%)
Place of birth for the foreign-born population - Syria (%)
Place of birth for the foreign-born population - Turkey (%)
Place of birth for the foreign-born population - Yemen (%)
Place of birth for the foreign-born population - Other Western Asia (%)
Place of birth for the foreign-born population - Eritrea (%)
Place of birth for the foreign-born population - Ethiopia (%)
Place of birth for the foreign-born population - Kenya (%)
Place of birth for the foreign-born population - Somalia (%)
Place of birth for the foreign-born population - Uganda (%)
Place of birth for the foreign-born population - Zimbabwe (%)
Place of birth for the foreign-born population - Other Eastern Africa (%)
Place of birth for the foreign-born population - Cameroon (%)
Place of birth for the foreign-born population - Congo (%)
Place of birth for the foreign-born population - Democratic Republic of Congo (Zaire) (%)
Place of birth for the foreign-born population - Other Middle Africa (%)
Place of birth for the foreign-born population - Egypt (%)
Place of birth for the foreign-born population - Morocco (%)
Place of birth for the foreign-born population - Sudan (%)
Place of birth for the foreign-born population - Other Northern Africa (%)
Place of birth for the foreign-born population - South Africa (%)
Place of birth for the foreign-born population - Other Southern Africa (%)
Place of birth for the foreign-born population - Cabo Verde (%)
Place of birth for the foreign-born population - Ghana (%)
Place of birth for the foreign-born population - Liberia (%)
Place of birth for the foreign-born population - Nigeria (%)
Place of birth for the foreign-born population - Senegal (%)
Place of birth for the foreign-born population - Sierra Leone (%)
Place of birth for the foreign-born population - Other Western Africa (%)
Place of birth for the foreign-born population - Australia (%)
Place of birth for the foreign-born population - New Zealand (%)
Place of birth for the foreign-born population - Fiji (%)
Place of birth for the foreign-born population - Micronesia (%)
Place of birth for the foreign-born population - Bahamas (%)
Place of birth for the foreign-born population - Barbados (%)
Place of birth for the foreign-born population - Cuba (%)
Place of birth for the foreign-born population - Dominica (%)
Place of birth for the foreign-born population - Dominican Republic (%)
Place of birth for the foreign-born population - Grenada (%)
Place of birth for the foreign-born population - Haiti (%)
Place of birth for the foreign-born population - Jamaica (%)
Place of birth for the foreign-born population - St. Vincent and the Grenadines (%)
Place of birth for the foreign-born population - Trinidad and Tobago (%)
Place of birth for the foreign-born population - West Indies (%)
Place of birth for the foreign-born population - Other Caribbean (%)
Place of birth for the foreign-born population - Belize (%)
Place of birth for the foreign-born population - Costa Rica (%)
Place of birth for the foreign-born population - El Salvador (%)
Place of birth for the foreign-born population - Guatemala (%)
Place of birth for the foreign-born population - Honduras (%)
Place of birth for the foreign-born population - Mexico (%)
Place of birth for the foreign-born population - Nicaragua (%)
Place of birth for the foreign-born population - Panama (%)
Place of birth for the foreign-born population - Other Central America (%)
Place of birth for the foreign-born population - Argentina (%)
Place of birth for the foreign-born population - Bolivia (%)
Place of birth for the foreign-born population - Brazil (%)
Place of birth for the foreign-born population - Chile (%)
Place of birth for the foreign-born population - Colombia (%)
Place of birth for the foreign-born population - Ecuador (%)
Place of birth for the foreign-born population - Guyana (%)
Place of birth for the foreign-born population - Peru (%)
Place of birth for the foreign-born population - Uruguay (%)
Place of birth for the foreign-born population - Venezuela (%)
Place of birth for the foreign-born population - Other South America (%)
Place of birth for the foreign-born population - Canada (%)
Place of birth for the foreign-born population - Other Northern America (%)
Place of birth for the foreign-born population - Other (%)
Latest news about races in Georgetown, GA collected exclusively by city-data.com from local newspapers, TV, and radio stations
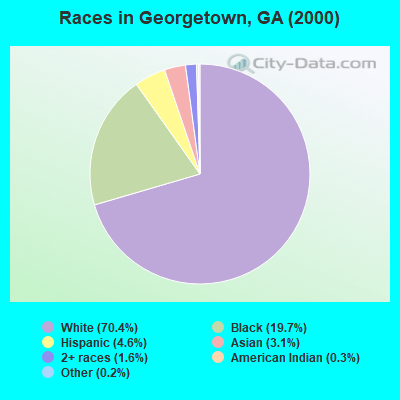
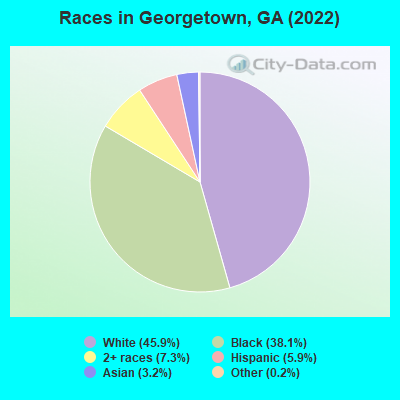
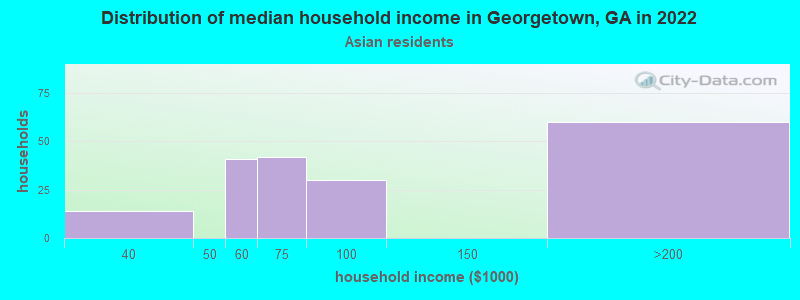
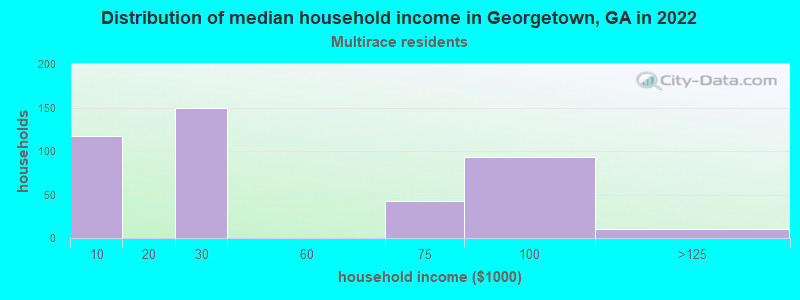
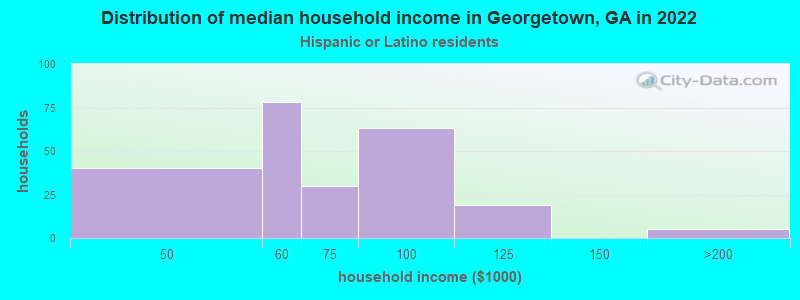
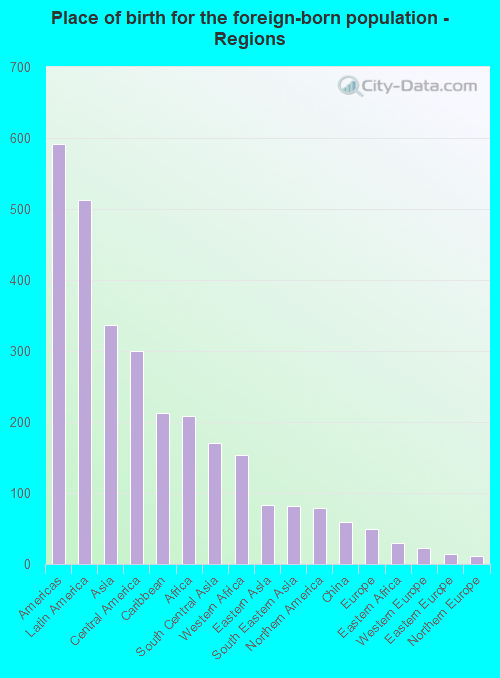
According to 2022 data, the most numerous races in Georgetown, GA are White alone (5,831 residents), Black alone (4,836 residents), and Hispanic (754 residents). 93.4% of Georgetown residents speak English at home. 9.4% of Georgetown, GA residents are foreign-born (3.9% born in Latin America, 2.6% born in Asia, 1.6% born in Africa), which is 6.9% less than the foreign-born rate of 10.0% across the entire state of Georgia.
Race distribution in Georgetown
2000 2022
5,128,661 62.6% White alone 2,331,465 28.5% Black alone 435,227 5.3% Hispanic 171,513 2.1% Asian alone 87,364 1.1% Two or more races 17,670 0.2% American Indian alone 11,275 0.1% Other race alone 3,278 0.04% Native Hawaiian and Other
5,415,657 49.6% White alone 3,349,240 30.7% Black alone 1,132,604 10.4% Hispanic 479,156 4.4% Asian alone 462,923 4.2% Two or more races 54,416 0.5% Other race alone 11,923 0.1% American Indian alone 6,957 0.06% Native Hawaiian and Other
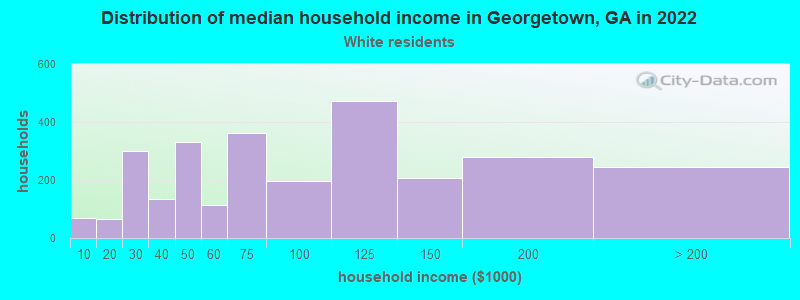
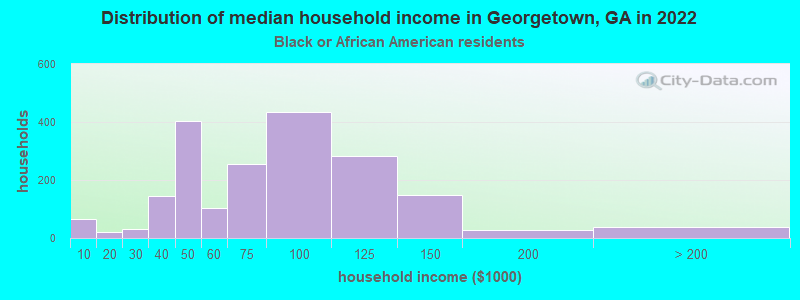
Income and house value in Georgetown Median household income in 2022 $77,868 White non-Hispanic householders$66,868 Black householders$64,300 Hispanic or Latino race householdersMedian 2022 house value $277,908 White Non-Hispanic householders$278,885 Black or African American householders $433,849 Asian householders$746,954 Some other race householders$207,758 Two or more races householders$251,999 Hispanic or Latino householders
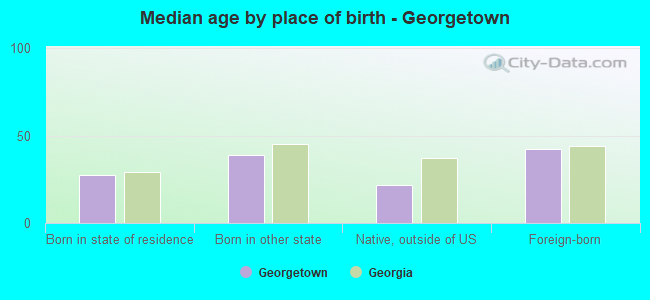
Median age by race in Georgetown
31.1 Median age for White residents29.8 31.6 41.9 Median age for Black or African American residents36.5 45.6 14.5 Median age for American Indian / Alaska Native residents11.7 -663,013,698.0 72.8 Median age for Asian residents77.0 68.2 -657,243,815.6 Median age for Native Hawaiian / Pacific Islander residents-693,227,090.9 -776,776,776.0 25.7 Median age for Other race residents18.8 -748,015,872.3 16.2 Median age for Two or more races residents17.5 16.3 31.0 Median age for White alone residents30.2 31.8 26.6 Median age for Hispanic or Latino residents25.8 28.2
Owner/renter occupied households by race in Georgetown
House owners and renters - White residents 1,703 61.6% Owner occupied1,064 38.4% Renter occupiedHouse owners and renters - Black or African American residents 790 41.8% Owner occupied1,098 58.2% Renter occupiedHouse owners and renters - American Indian / Alaska Native residents 35 100.0% Renter occupiedHouse owners and renters - Asian residents 149 80.6% Owner occupied36 19.4% Renter occupiedHouse owners and renters - Other race residents 27 100.0% Renter occupiedHouse owners and renters - Two or more races residents 21 5.7% Owner occupied352 94.3% Renter occupiedHouse owners and renters - White alone residents 1,704 62.2% Owner occupied1,036 37.8% Renter occupiedHouse owners and renters - Hispanic or Latino residents 13 5.8% Owner occupied215 94.2% Renter occupied
Language usage in Georgetown
English speakers - Total 93.4% of residents of Georgetown speak English at home.
4.0% of residents speak Spanish at home 305 64.2% Speak English very well170 35.8% Speak English less than very well3.0% of residents speak other language at home 271 74.9% Speak English very well91 25.1% Speak English less than very well
English speakers - Born in the United States 96.1% of residents of Georgetown speak English at home.
4.1% of residents speak Spanish at home 167 73.9% Speak English very well59 26.1% Speak English less than very well0.4% of residents speak other language at home 21 100.0% Speak English less than very well
English speakers - Native, born elsewhere 89.4% of residents of Georgetown speak English at home.
13.7% of residents speak Spanish at home 22 100.0% Speak English very well
English speakers - Foreign-born 84.2% of residents of Georgetown speak English at home.
18.0% of residents speak Spanish at home 95 46.3% Speak English very well110 53.7% Speak English less than very well18.4% of residents speak other language at home 163 77.6% Speak English very well47 22.4% Speak English less than very well
White (Caucasian) - Speak only English Native:
98.2% (5,392)Foreign-born:
96.1% (98)
White (Caucasian) - Speak another language Native:
2.0% (112)Foreign-born:
38.9% (40)
Black or African American - Speak only English Native:
97.0% (4,039)Foreign-born:
86.7% (614)
Black or African American - Speak another language Native:
2.1% (86)Foreign-born:
18.5% (131)
Asian - Speak another language Native:
74.2% (33)Foreign-born:
39.7% (128)
Other race - Speak another language Native:
1.8% (2)Foreign-born:
99.6% (68)
Two or more races - Speak only English Native:
87.9% (984)Foreign-born:
55.6% (14)
Two or more races - Speak another language Native:
11.5% (128)Foreign-born:
23.8% (6)
White alone - Speak only English Native:
98.1% (5,260)Foreign-born:
100.0% (73)
Hispanic or Latino - Speak only English Native:
58.2% (264)Foreign-born:
29.5% (91)
Hispanic or Latino - Speak another language Native:
42.3% (192)Foreign-born:
77.6% (240)
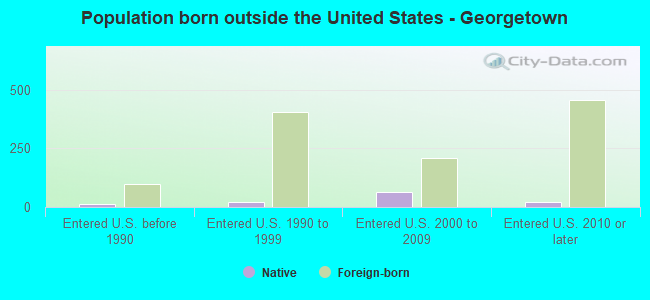
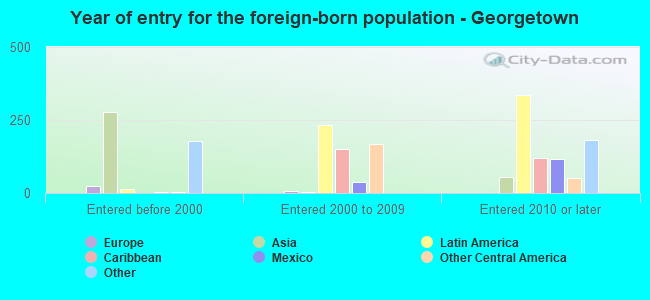
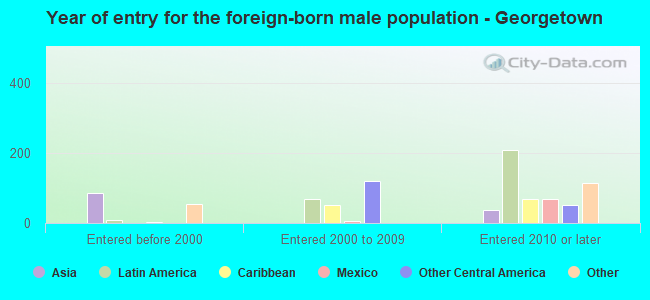
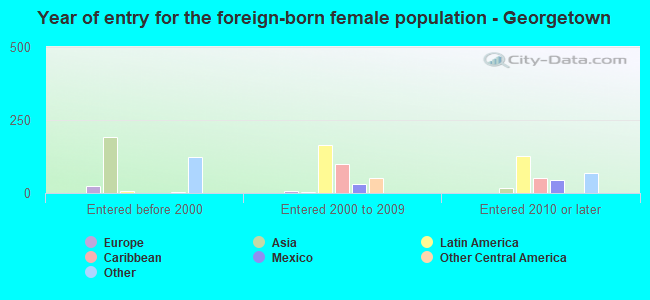
Foreign-born residents in Georgetown 1,188 residents are foreign born (3.9% Latin America , 2.6% Asia , 1.6% Africa ).
This city:
9.4%Georgia:
10.4%
Marital status for residents in Georgetown Marital status - White (Caucasian) population 15 years and over
Males 34.2% Never married49.5% Now married0.7% Separated3.0% Widowed12.5% DivorcedFemales 32.3% Never married45.2% Now married1.0% Separated5.0% Widowed16.6% DivorcedWomen who gave birth in the past 12 months Now married:
100.0% (157)Unmarried:
0.0% (0)
Women who did not give birth in the past 12 months Now married:
40.1% (634)Unmarried:
59.9% (947)
Marital status - Black or African American population 15 years and over
Males 46.5% Never married36.3% Now married0.9% Separated0.6% Widowed15.8% DivorcedFemales 28.5% Never married41.4% Now married0.8% Separated9.3% Widowed20.0% DivorcedWomen who did not give birth in the past 12 months Now married:
33.9% (362)Unmarried:
66.1% (706)
Marital status - American Indian / Alaska Native population 15 years and over
Males 57.6% Never married42.4% Now married0.0% Separated0.0% Widowed0.0% DivorcedFemales 0.0% Never married100.0% Now married0.0% Separated0.0% Widowed0.0% DivorcedWomen who did not give birth in the past 12 months Now married:
100.0% (38)Unmarried:
0.0% (0)
Marital status - Asian population 15 years and over
Males 16.0% Never married75.2% Now married0.0% Separated0.0% Widowed8.8% DivorcedFemales 0.0% Never married56.7% Now married0.0% Separated24.6% Widowed18.7% DivorcedWomen who did not give birth in the past 12 months Now married:
52.4% (57)Unmarried:
47.6% (52)
Marital status - Other race population 15 years and over
Males 71.9% Never married28.1% Now married0.0% Separated0.0% Widowed0.0% DivorcedFemales 0.0% Never married100.0% Now married0.0% Separated0.0% Widowed0.0% DivorcedWomen who did not give birth in the past 12 months Now married:
100.0% (57)Unmarried:
0.0% (0)
Marital status - Two or more races population 15 years and over
Males 78.7% Never married21.3% Now married0.0% Separated0.0% Widowed0.0% DivorcedFemales 38.3% Never married29.6% Now married30.4% Separated0.0% Widowed1.7% DivorcedWomen who did not give birth in the past 12 months Now married:
60.0% (205)Unmarried:
40.0% (137)
Marital status - White alone, not Hispanic / Latino population 15 years and over
Males 31.5% Never married51.5% Now married0.8% Separated3.1% Widowed13.1% DivorcedFemales 31.6% Never married44.5% Now married1.0% Separated5.3% Widowed17.6% DivorcedWomen who gave birth in the past 12 months Now married:
100.0% (163)Unmarried:
0.0% (0)
Women who did not give birth in the past 12 months Now married:
38.5% (578)Unmarried:
61.5% (923)
Marital status - Hispanic or Latino population 15 years and over
Males 68.5% Never married31.5% Now married0.0% Separated0.0% Widowed0.0% DivorcedFemales 28.6% Never married71.4% Now married0.0% Separated0.0% Widowed0.0% DivorcedWomen who did not give birth in the past 12 months Now married:
71.4% (210)Unmarried:
28.6% (84)
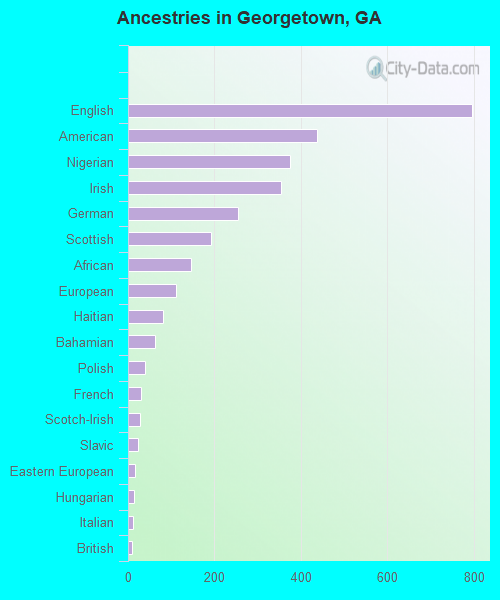
Ancestries in Georgetown
795 11.0% English437 6.1% American375 5.2% Nigerian353 4.9% Irish255 3.5% German193 2.7% Scottish145 2.0% African110 1.5% European81 1.1% Haitian63 0.9% Bahamian40 0.6% Polish31 0.4% French28 0.4% Scotch-Irish23 0.3% Slavic17 0.2% Eastern European15 0.2% Hungarian12 0.2% Italian10 0.1% British
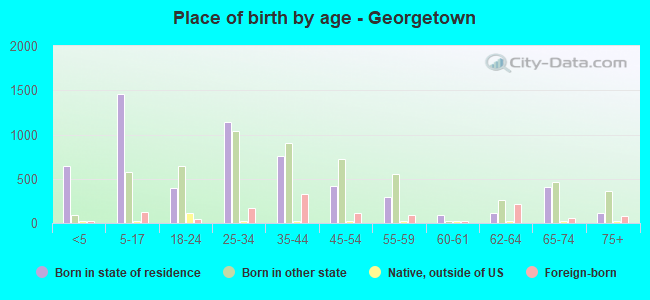
Children Nativity (place of birth) in Georgetown
Children under 6 years - Living with two parents Both parents native 496 100.0% NativeBoth parents foreign-born 11 100.0% Foreign-bornOne native, one foreign-born parent 58 100.0% NativeChildren under 6 years - Living with one parent Native parent 87 100.0% NativeForeign-born parent 148 100.0% NativeChildren 6 to 17 years - Living with two parents Both parents native 410 100.0% NativeBoth parents foreign-born 17 11.4% Native133 88.6% Foreign-bornOne native, one foreign-born parent 149 100.0% NativeChildren 6 to 17 years - Living with one parent Native parent 1,062 100.0% NativeForeign-born parent 248 50.3% Native245 49.7% Foreign-born
Grandparents responsible for own grandchildren in Georgetown
Grandparents (30 to 59 years) Black or African American 21 100.0% Not responsible for grandchildren
Grandparents (60 years and over) Black or African American 58 100.0% Not responsible for grandchildren