Races in Granger, Indiana (IN) Detailed Stats
Data:
Races - White alone (%)
Races - White alone (% change since 2000)
Races - Black alone (%)
Races - Black alone (% change since 2000)
Races - American Indian alone (%)
Races - American Indian alone (% change since 2000)
Races - Asian alone (%)
Races - Asian alone (% change since 2000)
Races - Hispanic (%)
Races - Hispanic (% change since 2000)
Races - Native Hawaiian and Other Pacific Islander alone (%)
Races - Native Hawaiian and Other Pacific Islander alone (% change since 2000)
Races - Two or more races(%)
Races - Two or more races(% change since 2000)
Races - Other race alone (%)
Races - Other race alone (% change since 2000)
Racial diversity
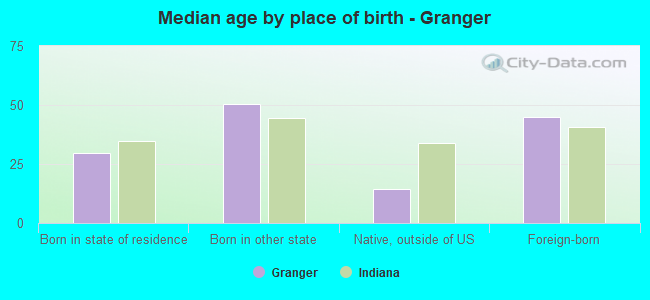
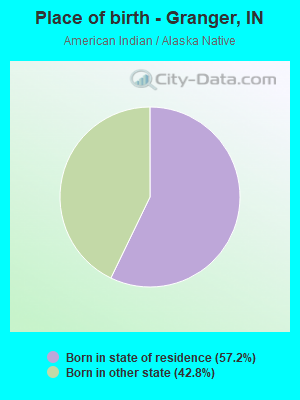
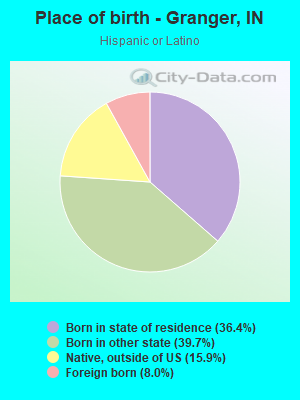
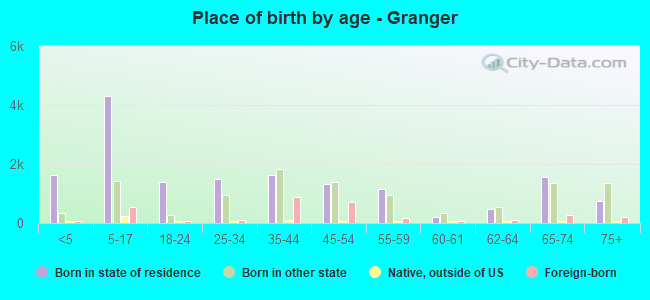
Place of birth - Born in state of residence (%)
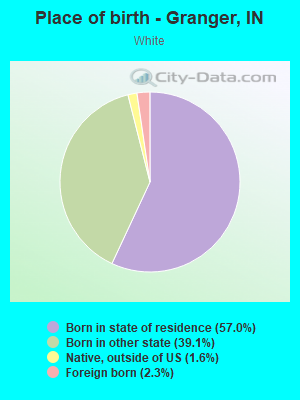
Place of birth - Born in state of residence (%) - White
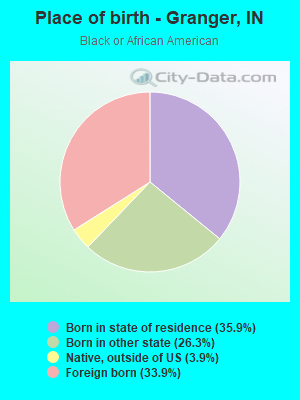
Place of birth - Born in state of residence (%) - Black or African American
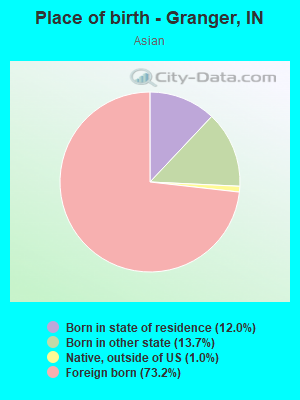
Place of birth - Born in state of residence (%) - Asian
Place of birth - Born in state of residence (%) - Hispanic or Latino
Place of birth - Born in state of residence (%) - American Indian and Alaska Native
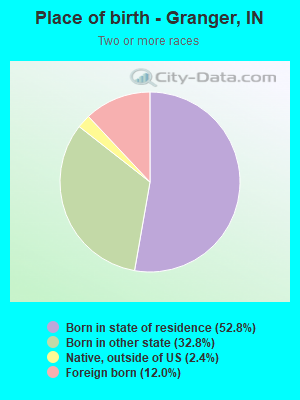
Place of birth - Born in state of residence (%) - Multirace
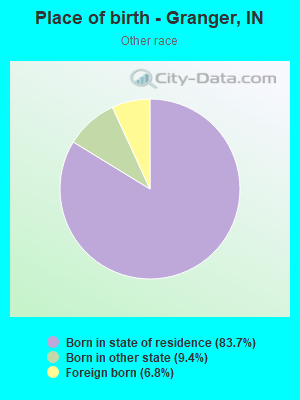
Place of birth - Born in state of residence (%) - Other Race
Place of birth - Born in other state (%)
Place of birth - Born in other state (%) - White
Place of birth - Born in other state (%) - Black or African American
Place of birth - Born in other state (%) - Asian
Place of birth - Born in other state (%) - Hispanic or Latino
Place of birth - Born in other state (%) - American Indian and Alaska Native
Place of birth - Born in other state (%) - Multirace
Place of birth - Born in other state (%) - Other Race
Place of birth - Native, outside of US (%)
Place of birth - Native, outside of US (%) - White
Place of birth - Native, outside of US (%) - Black or African American
Place of birth - Native, outside of US (%) - Asian
Place of birth - Native, outside of US (%) - Hispanic or Latino
Place of birth - Native, outside of US (%) - American Indian and Alaska Native
Place of birth - Native, outside of US (%) - Multirace
Place of birth - Native, outside of US (%) - Other Race
Place of birth - Foreign born (%)
Place of birth - Foreign born (%) - White
Place of birth - Foreign born (%) - Black or African American
Place of birth - Foreign born (%) - Asian
Place of birth - Foreign born (%) - Hispanic or Latino
Place of birth - Foreign born (%) - American Indian and Alaska Native
Place of birth - Foreign born (%) - Multirace
Place of birth - Foreign born (%) - Other Race
Residents speaking English at home (%)
Residents speaking English at home - Born in the United States (%)
Residents speaking English at home - Native, born elsewhere (%)
Residents speaking English at home - Foreign born (%)
Residents speaking Spanish at home (%)
Residents speaking Spanish at home - Born in the United States (%)
Residents speaking Spanish at home - Native, born elsewhere (%)
Residents speaking Spanish at home - Foreign born (%)
Residents speaking other language at home (%)
Residents speaking other language at home - Born in the United States (%)
Residents speaking other language at home - Native, born elsewhere (%)
Residents speaking other language at home - Foreign born (%)
Marital status - Never married (%)
Marital status - Now married (%)
Marital status - Separated (%)
Marital status - Widowed (%)
Marital status - Divorced (%)
Ancestries Reported - Arab (%)
Ancestries Reported - Czech (%)
Ancestries Reported - Danish (%)
Ancestries Reported - Dutch (%)
Ancestries Reported - English (%)
Ancestries Reported - French (%)
Ancestries Reported - French Canadian (%)
Ancestries Reported - German (%)
Ancestries Reported - Greek (%)
Ancestries Reported - Hungarian (%)
Ancestries Reported - Irish (%)
Ancestries Reported - Italian (%)
Ancestries Reported - Lithuanian (%)
Ancestries Reported - Norwegian (%)
Ancestries Reported - Polish (%)
Ancestries Reported - Portuguese (%)
Ancestries Reported - Russian (%)
Ancestries Reported - Scotch-Irish (%)
Ancestries Reported - Scottish (%)
Ancestries Reported - Slovak (%)
Ancestries Reported - Subsaharan African (%)
Ancestries Reported - Swedish (%)
Ancestries Reported - Swiss (%)
Ancestries Reported - Ukrainian (%)
Ancestries Reported - United States (%)
Ancestries Reported - Welsh (%)
Ancestries Reported - West Indian (%)
Ancestries Reported - Other (%)
Geographical mobility - Same house 1 year ago (%)
Geographical mobility - Same house 1 year ago (%) - White
Geographical mobility - Same house 1 year ago (%) - Black or African American
Geographical mobility - Same house 1 year ago (%) - Asian
Geographical mobility - Same house 1 year ago (%) - Hispanic or Latino
Geographical mobility - Same house 1 year ago (%) - American Indian and Alaska Native
Geographical mobility - Same house 1 year ago (%) - Multirace
Geographical mobility - Same house 1 year ago (%) - Other Race
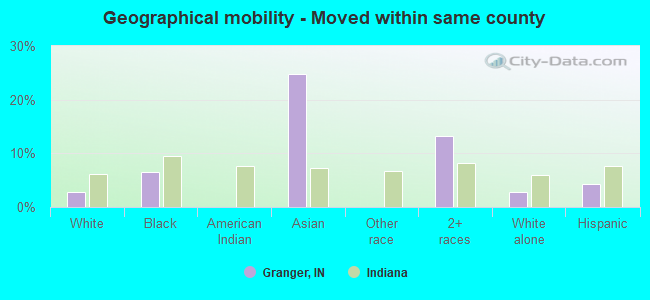
Geographical mobility - Moved within same county (%)
Geographical mobility - Moved within same county (%) - White
Geographical mobility - Moved within same county (%) - Black or African American
Geographical mobility - Moved within same county (%) - Asian
Geographical mobility - Moved within same county (%) - Hispanic or Latino
Geographical mobility - Moved within same county (%) - American Indian and Alaska Native
Geographical mobility - Moved within same county (%) - Multirace
Geographical mobility - Moved within same county (%) - Other Race
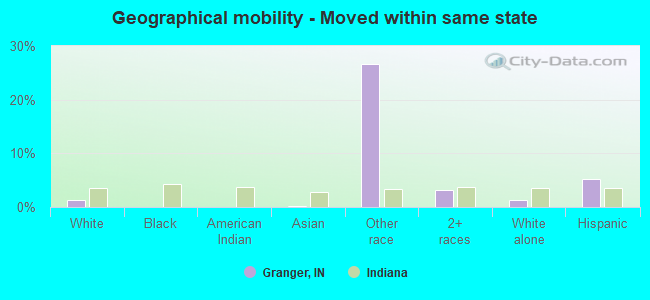
Geographical mobility - Moved from different county within same state (%)
Geographical mobility - Moved from different county within same state (%) - White
Geographical mobility - Moved from different county within same state (%) - Black or African American
Geographical mobility - Moved from different county within same state (%) - Asian
Geographical mobility - Moved from different county within same state (%) - Hispanic or Latino
Geographical mobility - Moved from different county within same state (%) - American Indian and Alaska Native
Geographical mobility - Moved from different county within same state (%) - Multirace
Geographical mobility - Moved from different county within same state (%) - Other Race
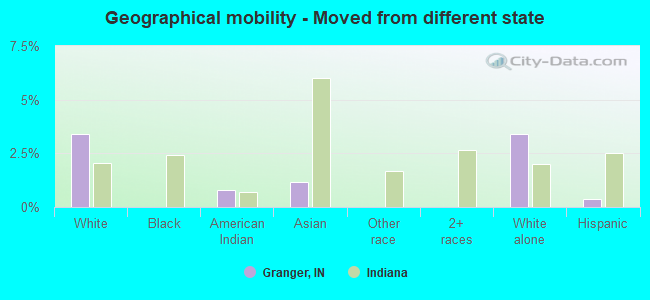
Geographical mobility - Moved from different state (%)
Geographical mobility - Moved from different state (%) - White
Geographical mobility - Moved from different state (%) - Black or African American
Geographical mobility - Moved from different state (%) - Asian
Geographical mobility - Moved from different state (%) - Hispanic or Latino
Geographical mobility - Moved from different state (%) - American Indian and Alaska Native
Geographical mobility - Moved from different state (%) - Multirace
Geographical mobility - Moved from different state (%) - Other Race
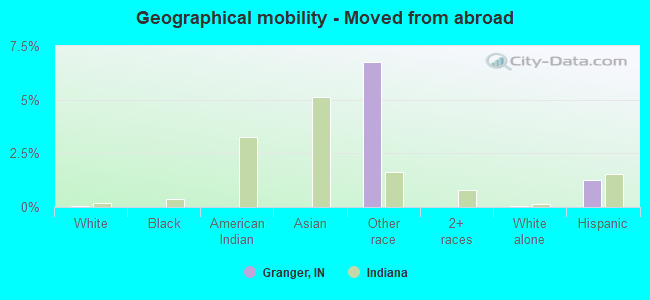
Geographical mobility - Moved from abroad (%)
Geographical mobility - Moved from abroad (%) - White
Geographical mobility - Moved from abroad (%) - Black or African American
Geographical mobility - Moved from abroad (%) - Asian
Geographical mobility - Moved from abroad (%) - Hispanic or Latino
Geographical mobility - Moved from abroad (%) - American Indian and Alaska Native
Geographical mobility - Moved from abroad (%) - Multirace
Geographical mobility - Moved from abroad (%) - Other Race
Place of birth for the foreign-born population - Ireland (%)
Place of birth for the foreign-born population - Denmark (%)
Place of birth for the foreign-born population - Norway (%)
Place of birth for the foreign-born population - Sweden (%)
Place of birth for the foreign-born population - United Kingdom (%)
Place of birth for the foreign-born population - England (%)
Place of birth for the foreign-born population - Scotland (%)
Place of birth for the foreign-born population - Other Northern Europe (%)
Place of birth for the foreign-born population - Austria (%)
Place of birth for the foreign-born population - Belgium (%)
Place of birth for the foreign-born population - France (%)
Place of birth for the foreign-born population - Germany (%)
Place of birth for the foreign-born population - Netherlands (%)
Place of birth for the foreign-born population - Switzerland (%)
Place of birth for the foreign-born population - Other Western Europe (%)
Place of birth for the foreign-born population - Greece (%)
Place of birth for the foreign-born population - Italy (%)
Place of birth for the foreign-born population - Portugal (%)
Place of birth for the foreign-born population - Spain (%)
Place of birth for the foreign-born population - Other Southern Europe (%)
Place of birth for the foreign-born population - Albania (%)
Place of birth for the foreign-born population - Belarus (%)
Place of birth for the foreign-born population - Bosnia and Herzegovina (%)
Place of birth for the foreign-born population - Bulgaria (%)
Place of birth for the foreign-born population - Croatia (%)
Place of birth for the foreign-born population - Czechoslovakia (%)
Place of birth for the foreign-born population - Hungary (%)
Place of birth for the foreign-born population - Latvia (%)
Place of birth for the foreign-born population - Lithuania (%)
Place of birth for the foreign-born population - North Macedonia (Macedonia) (%)
Place of birth for the foreign-born population - Moldova (%)
Place of birth for the foreign-born population - Poland (%)
Place of birth for the foreign-born population - Romania (%)
Place of birth for the foreign-born population - Russia (%)
Place of birth for the foreign-born population - Serbia (%)
Place of birth for the foreign-born population - Ukraine (%)
Place of birth for the foreign-born population - Other Eastern Europe (%)
Place of birth for the foreign-born population - China (%)
Place of birth for the foreign-born population - Hong Kong (%)
Place of birth for the foreign-born population - Taiwan (%)
Place of birth for the foreign-born population - Japan (%)
Place of birth for the foreign-born population - Korea (%)
Place of birth for the foreign-born population - Other Eastern Asia (%)
Place of birth for the foreign-born population - Afghanistan (%)
Place of birth for the foreign-born population - Bangladesh (%)
Place of birth for the foreign-born population - India (%)
Place of birth for the foreign-born population - Iran (%)
Place of birth for the foreign-born population - Kazakhstan (%)
Place of birth for the foreign-born population - Nepal (%)
Place of birth for the foreign-born population - Pakistan (%)
Place of birth for the foreign-born population - Sri Lanka (%)
Place of birth for the foreign-born population - Uzbekistan (%)
Place of birth for the foreign-born population - Other South Central Asia (%)
Place of birth for the foreign-born population - Burma (%)
Place of birth for the foreign-born population - Cambodia (%)
Place of birth for the foreign-born population - Indonesia (%)
Place of birth for the foreign-born population - Laos (%)
Place of birth for the foreign-born population - Malaysia (%)
Place of birth for the foreign-born population - Philippines (%)
Place of birth for the foreign-born population - Singapore (%)
Place of birth for the foreign-born population - Thailand (%)
Place of birth for the foreign-born population - Vietnam (%)
Place of birth for the foreign-born population - Other South Eastern Asia (%)
Place of birth for the foreign-born population - Armenia (%)
Place of birth for the foreign-born population - Iraq (%)
Place of birth for the foreign-born population - Israel (%)
Place of birth for the foreign-born population - Jordan (%)
Place of birth for the foreign-born population - Kuwait (%)
Place of birth for the foreign-born population - Lebanon (%)
Place of birth for the foreign-born population - Saudi Arabia (%)
Place of birth for the foreign-born population - Syria (%)
Place of birth for the foreign-born population - Turkey (%)
Place of birth for the foreign-born population - Yemen (%)
Place of birth for the foreign-born population - Other Western Asia (%)
Place of birth for the foreign-born population - Eritrea (%)
Place of birth for the foreign-born population - Ethiopia (%)
Place of birth for the foreign-born population - Kenya (%)
Place of birth for the foreign-born population - Somalia (%)
Place of birth for the foreign-born population - Uganda (%)
Place of birth for the foreign-born population - Zimbabwe (%)
Place of birth for the foreign-born population - Other Eastern Africa (%)
Place of birth for the foreign-born population - Cameroon (%)
Place of birth for the foreign-born population - Congo (%)
Place of birth for the foreign-born population - Democratic Republic of Congo (Zaire) (%)
Place of birth for the foreign-born population - Other Middle Africa (%)
Place of birth for the foreign-born population - Egypt (%)
Place of birth for the foreign-born population - Morocco (%)
Place of birth for the foreign-born population - Sudan (%)
Place of birth for the foreign-born population - Other Northern Africa (%)
Place of birth for the foreign-born population - South Africa (%)
Place of birth for the foreign-born population - Other Southern Africa (%)
Place of birth for the foreign-born population - Cabo Verde (%)
Place of birth for the foreign-born population - Ghana (%)
Place of birth for the foreign-born population - Liberia (%)
Place of birth for the foreign-born population - Nigeria (%)
Place of birth for the foreign-born population - Senegal (%)
Place of birth for the foreign-born population - Sierra Leone (%)
Place of birth for the foreign-born population - Other Western Africa (%)
Place of birth for the foreign-born population - Australia (%)
Place of birth for the foreign-born population - New Zealand (%)
Place of birth for the foreign-born population - Fiji (%)
Place of birth for the foreign-born population - Micronesia (%)
Place of birth for the foreign-born population - Bahamas (%)
Place of birth for the foreign-born population - Barbados (%)
Place of birth for the foreign-born population - Cuba (%)
Place of birth for the foreign-born population - Dominica (%)
Place of birth for the foreign-born population - Dominican Republic (%)
Place of birth for the foreign-born population - Grenada (%)
Place of birth for the foreign-born population - Haiti (%)
Place of birth for the foreign-born population - Jamaica (%)
Place of birth for the foreign-born population - St. Vincent and the Grenadines (%)
Place of birth for the foreign-born population - Trinidad and Tobago (%)
Place of birth for the foreign-born population - West Indies (%)
Place of birth for the foreign-born population - Other Caribbean (%)
Place of birth for the foreign-born population - Belize (%)
Place of birth for the foreign-born population - Costa Rica (%)
Place of birth for the foreign-born population - El Salvador (%)
Place of birth for the foreign-born population - Guatemala (%)
Place of birth for the foreign-born population - Honduras (%)
Place of birth for the foreign-born population - Mexico (%)
Place of birth for the foreign-born population - Nicaragua (%)
Place of birth for the foreign-born population - Panama (%)
Place of birth for the foreign-born population - Other Central America (%)
Place of birth for the foreign-born population - Argentina (%)
Place of birth for the foreign-born population - Bolivia (%)
Place of birth for the foreign-born population - Brazil (%)
Place of birth for the foreign-born population - Chile (%)
Place of birth for the foreign-born population - Colombia (%)
Place of birth for the foreign-born population - Ecuador (%)
Place of birth for the foreign-born population - Guyana (%)
Place of birth for the foreign-born population - Peru (%)
Place of birth for the foreign-born population - Uruguay (%)
Place of birth for the foreign-born population - Venezuela (%)
Place of birth for the foreign-born population - Other South America (%)
Place of birth for the foreign-born population - Canada (%)
Place of birth for the foreign-born population - Other Northern America (%)
Place of birth for the foreign-born population - Other (%)
Latest news about races in Granger, IN collected exclusively by city-data.com from local newspapers, TV, and radio stations
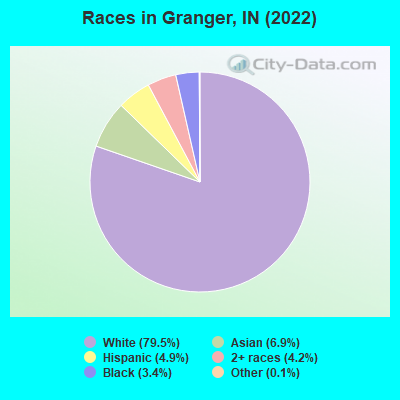
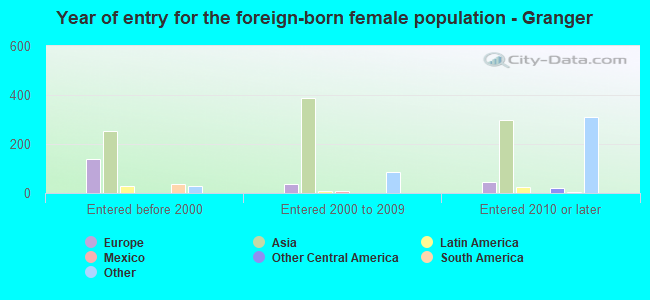
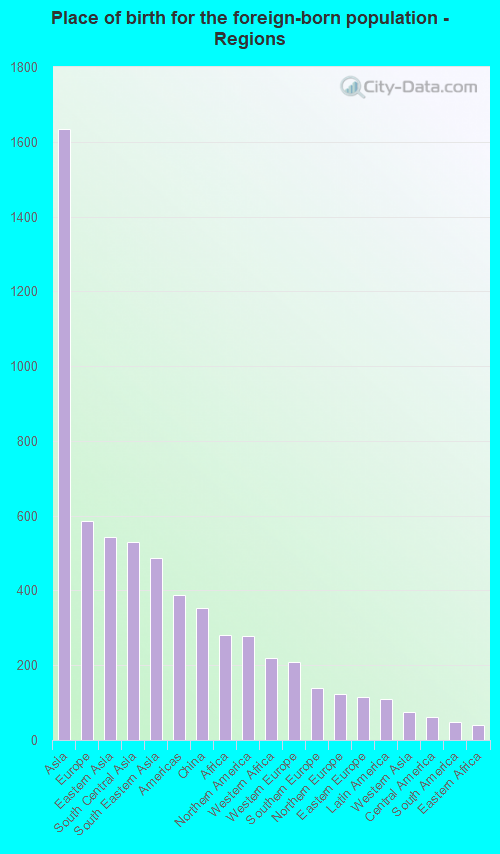
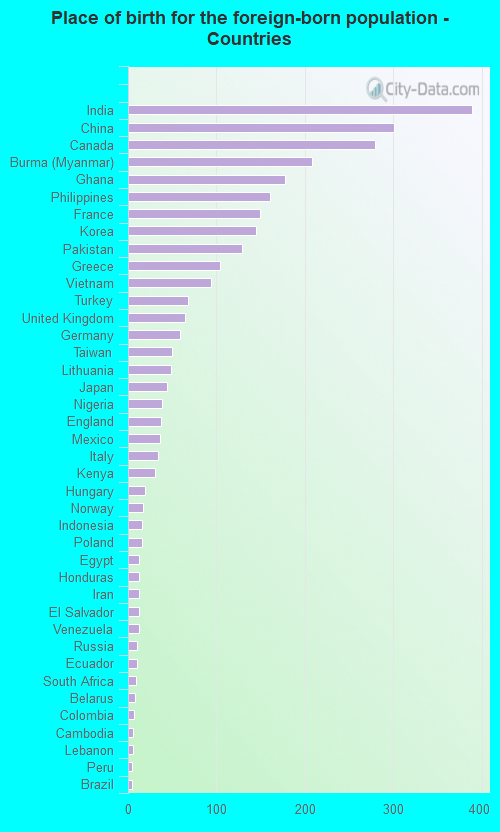
According to 2022 data, the most numerous races in Granger, IN are White alone (23,855 residents), Black alone (1,030 residents), and Hispanic (1,481 residents). 88.4% of Granger residents speak English at home. 9.6% of Granger, IN residents are foreign-born (5.0% born in Asia, 1.8% born in Europe), which is 37.8% greater than the foreign-born rate of 6.0% across the entire state of Indiana.
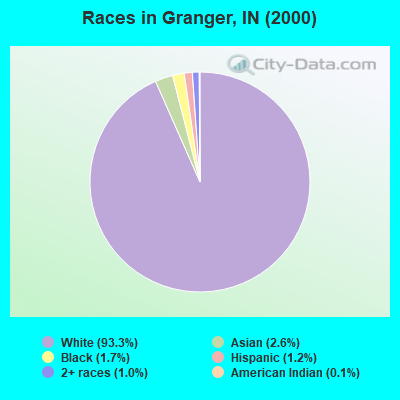
Race distribution in Granger
2000 2022
5,219,373 85.8% White alone 505,462 8.3% Black alone 214,536 3.5% Hispanic 61,115 1.0% Two or more races 58,424 1.0% Asian alone 13,654 0.2% American Indian alone 6,348 0.1% Other race alone 1,573 0.03% Native Hawaiian and Other
5,192,455 76.0% White alone 628,054 9.2% Black alone 534,528 7.8% Hispanic 263,242 3.9% Two or more races 172,880 2.5% Asian alone 33,467 0.5% Other race alone 5,866 0.09% American Indian alone 2,545 0.04% Native Hawaiian and Other
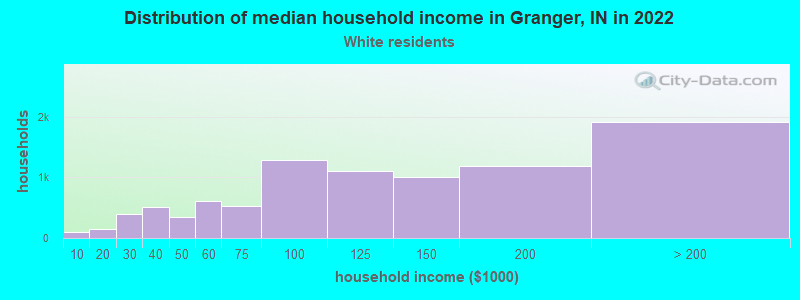
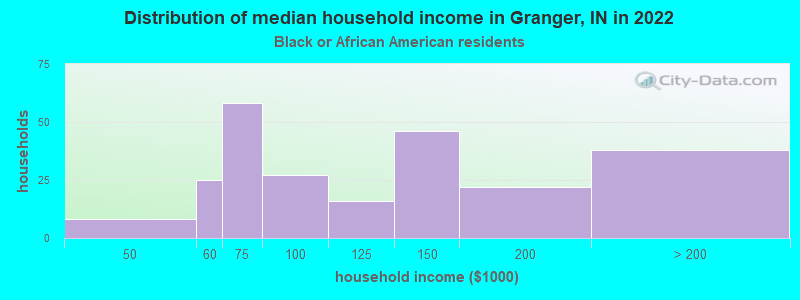
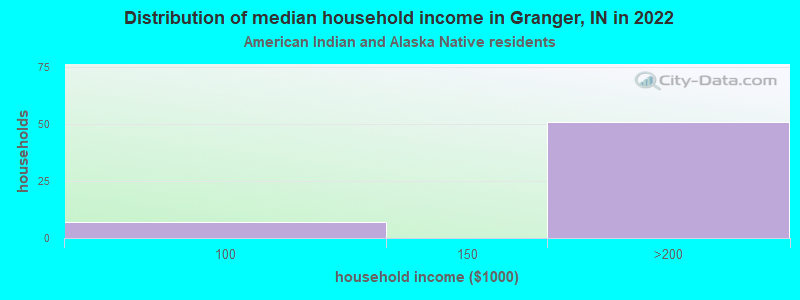
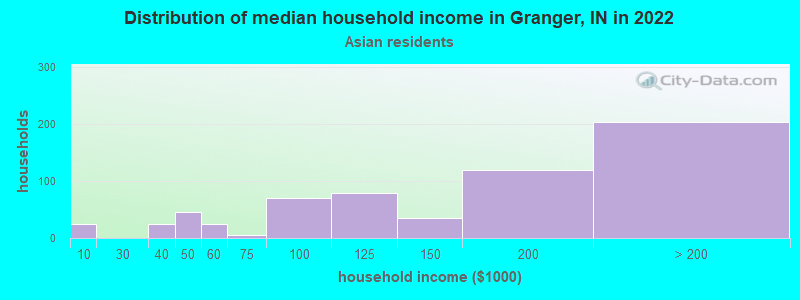
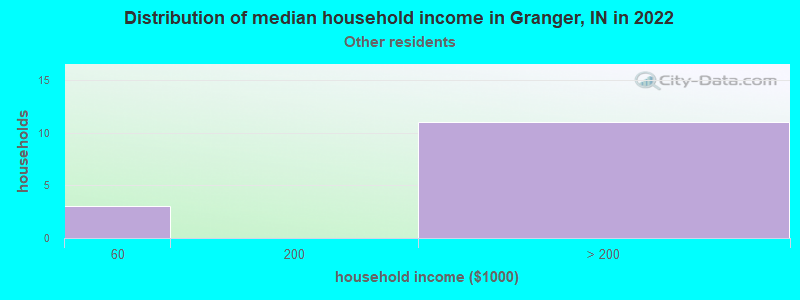
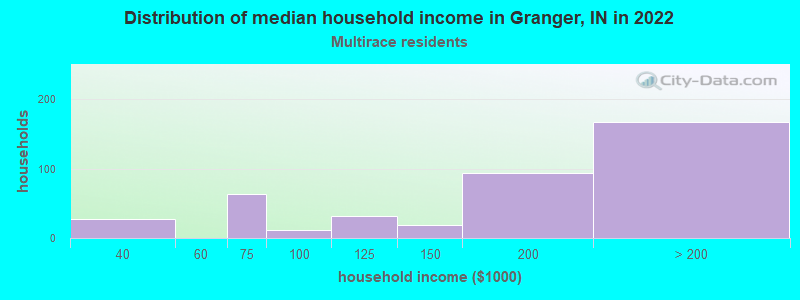
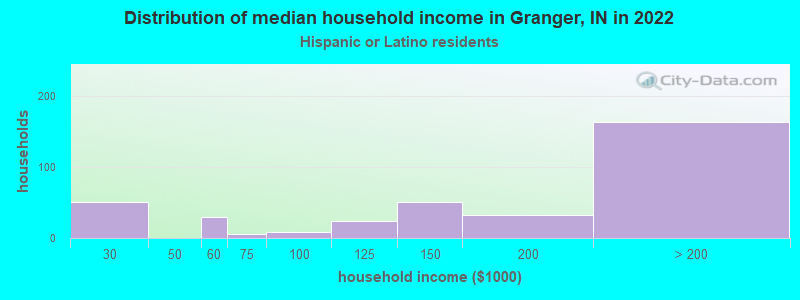
Income and house value in Granger Median household income in 2022 $107,101 White non-Hispanic householders$133,816 Black householders$154,607 American Indian and Alaska Native householders$91,787 Asian householders$196,848 Two or more races householders$161,446 Hispanic or Latino race householdersMedian 2022 house value $315,219 White Non-Hispanic householders$319,498 Black or African American householders$331,113 American Indian or Alaska Native householders $328,464 Asian householders$152,821 Native Hawaiian and other Pacific Islander householders$229,232 Some other race householders$221,896 Two or more races householders$444,608 Hispanic or Latino householders
Median age by race in Granger
42.9 Median age for White residents42.3 42.9 24.5 Median age for Black or African American residents12.5 39.7 59.0 Median age for American Indian / Alaska Native residents37.4 58.5 39.8 Median age for Asian residents44.3 31.1 -669,999,999.3 Median age for Native Hawaiian / Pacific Islander residents-644,025,156.6 -666,666,666.0 22.4 Median age for Other race residents22.6 16.7 18.6 Median age for Two or more races residents16.2 18.0 43.2 Median age for White alone residents42.3 44.0 16.3 Median age for Hispanic or Latino residents16.1 16.6
Owner/renter occupied households by race in Granger
House owners and renters - White residents 8,355 94.7% Owner occupied470 5.3% Renter occupiedHouse owners and renters - Black or African American residents 186 83.3% Owner occupied37 16.7% Renter occupiedHouse owners and renters - American Indian / Alaska Native residents 46 100.0% Owner occupiedHouse owners and renters - Asian residents 451 91.8% Owner occupied40 8.2% Renter occupiedHouse owners and renters - Other race residents 7 100.0% Owner occupiedHouse owners and renters - Two or more races residents 542 100.0% Owner occupiedHouse owners and renters - White alone residents 8,372 95.4% Owner occupied408 4.6% Renter occupiedHouse owners and renters - Hispanic or Latino residents 276 81.3% Owner occupied64 18.7% Renter occupied
Language usage in Granger
English speakers - Total 88.4% of residents of Granger speak English at home.
1.2% of residents speak Spanish at home 252 75.2% Speak English very well83 24.8% Speak English less than very well9.4% of residents speak other language at home 1,730 65.8% Speak English very well899 34.2% Speak English less than very well
English speakers - Born in the United States 96.3% of residents of Granger speak English at home.
0.8% of residents speak Spanish at home 79 100.0% Speak English very well2.9% of residents speak other language at home 237 78.7% Speak English very well64 21.3% Speak English less than very well
English speakers - Native, born elsewhere 66.9% of residents of Granger speak English at home.
27.6% of residents speak Spanish at home 162 100.0% Speak English very well6.1% of residents speak other language at home 11 30.6% Speak English very well25 69.4% Speak English less than very well
English speakers - Foreign-born 20.9% of residents of Granger speak English at home.
2.7% of residents speak Spanish at home 27 32.9% Speak English very well55 67.1% Speak English less than very well69.2% of residents speak other language at home 1,276 60.4% Speak English very well835 39.6% Speak English less than very well
White (Caucasian) - Speak only English Native:
98.8% (21,626)Foreign-born:
59.1% (330)
White (Caucasian) - Speak another language Native:
1.4% (308)Foreign-born:
46.8% (262)
Black or African American - Speak only English Native:
91.2% (547)Foreign-born:
11.9% (45)
Black or African American - Speak another language Native:
8.9% (54)Foreign-born:
100.0% (374)
Asian - Speak only English Native:
38.7% (200)Foreign-born:
15.8% (223)
Asian - Speak another language Native:
65.6% (340)Foreign-born:
77.4% (1,093)
Other race - Speak another language Native:
1.3% (2)Foreign-born:
100.0% (9)
Two or more races - Speak only English Native:
90.2% (1,584)Foreign-born:
12.2% (31)
Two or more races - Speak another language Native:
7.1% (125)Foreign-born:
78.7% (202)
White alone - Speak only English Native:
98.5% (21,307)Foreign-born:
53.1% (345)
White alone - Speak another language Native:
1.5% (320)Foreign-born:
46.8% (304)
Hispanic or Latino - Speak only English Native:
86.3% (1,036)Foreign-born:
26.3% (30)
Hispanic or Latino - Speak another language Native:
12.9% (155)Foreign-born:
65.5% (74)
Foreign-born residents in Granger 2,893 residents are foreign born (5.0% Asia , 1.8% Europe ).
This city:
9.6%Indiana:
5.6%
Marital status for residents in Granger Marital status - White (Caucasian) population 15 years and over
Males 23.2% Never married67.9% Now married0.0% Separated2.1% Widowed6.7% DivorcedFemales 18.1% Never married61.6% Now married0.3% Separated8.6% Widowed11.5% DivorcedWomen who gave birth in the past 12 months Now married:
88.5% (284)Unmarried:
11.5% (37)
Women who did not give birth in the past 12 months Now married:
56.3% (2,537)Unmarried:
43.7% (1,970)
Marital status - Black or African American population 15 years and over
Males 29.2% Never married60.9% Now married0.0% Separated0.0% Widowed9.9% DivorcedFemales 7.8% Never married70.0% Now married0.0% Separated2.7% Widowed19.5% DivorcedWomen who gave birth in the past 12 months Now married:
100.0% (52)Unmarried:
0.0% (0)
Women who did not give birth in the past 12 months Now married:
72.9% (64)Unmarried:
27.1% (24)
Marital status - American Indian / Alaska Native population 15 years and over
Males 0.0% Never married100.0% Now married0.0% Separated0.0% Widowed0.0% DivorcedFemales 35.7% Never married64.3% Now married0.0% Separated0.0% Widowed0.0% DivorcedWomen who did not give birth in the past 12 months Now married:
0.0% (0)Unmarried:
100.0% (12)
Marital status - Asian population 15 years and over
Males 9.3% Never married85.6% Now married0.0% Separated0.0% Widowed5.1% DivorcedFemales 15.3% Never married77.8% Now married1.1% Separated4.4% Widowed1.3% DivorcedWomen who gave birth in the past 12 months Now married:
100.0% (26)Unmarried:
0.0% (0)
Women who did not give birth in the past 12 months Now married:
81.6% (472)Unmarried:
18.4% (106)
Marital status - Other race population 15 years and over
Males 72.0% Never married28.0% Now married0.0% Separated0.0% Widowed0.0% DivorcedFemales 44.4% Never married55.6% Now married0.0% Separated0.0% Widowed0.0% DivorcedWomen who did not give birth in the past 12 months Now married:
55.6% (24)Unmarried:
44.4% (19)
Marital status - Two or more races population 15 years and over
Males 46.1% Never married42.8% Now married0.0% Separated4.7% Widowed6.4% DivorcedFemales 40.9% Never married57.5% Now married0.0% Separated0.2% Widowed1.3% DivorcedWomen who did not give birth in the past 12 months Now married:
47.8% (195)Unmarried:
52.2% (213)
Marital status - White alone, not Hispanic / Latino population 15 years and over
Males 23.1% Never married68.0% Now married0.0% Separated2.2% Widowed6.7% DivorcedFemales 17.9% Never married61.6% Now married0.3% Separated8.8% Widowed11.4% DivorcedWomen who gave birth in the past 12 months Now married:
88.5% (289)Unmarried:
11.5% (38)
Women who did not give birth in the past 12 months Now married:
56.5% (2,488)Unmarried:
43.5% (1,916)
Marital status - Hispanic or Latino population 15 years and over
Males 46.0% Never married51.9% Now married0.0% Separated0.0% Widowed2.1% DivorcedFemales 19.8% Never married70.9% Now married0.0% Separated1.7% Widowed7.7% DivorcedWomen who did not give birth in the past 12 months Now married:
61.5% (185)Unmarried:
38.5% (116)
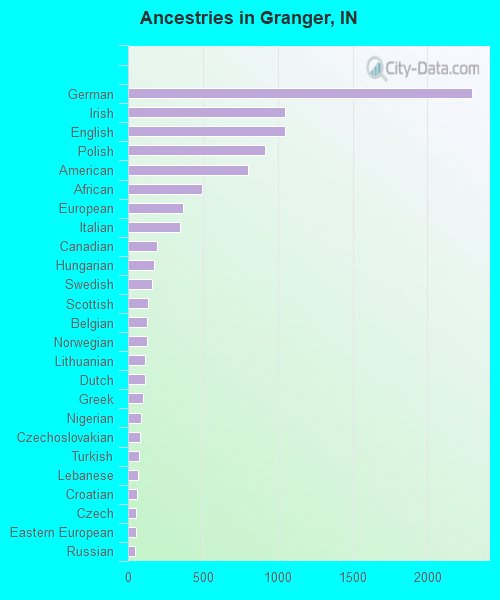
Ancestries in Granger
2,296 17.4% German1,050 8.0% Irish1,050 8.0% English912 6.9% Polish799 6.1% American495 3.8% African370 2.8% European345 2.6% Italian197 1.5% Canadian171 1.3% Hungarian160 1.2% Swedish136 1.0% Scottish129 1.0% Belgian127 1.0% Norwegian115 0.9% Lithuanian111 0.8% Dutch97 0.7% Greek90 0.7% Nigerian77 0.6% Czechoslovakian75 0.6% Turkish67 0.5% Lebanese63 0.5% Croatian54 0.4% Czech52 0.4% Eastern European47 0.4% Russian46 0.3% Cajun44 0.3% Danish41 0.3% French39 0.3% British33 0.3% Kenyan31 0.2% Iranian31 0.2% Swiss28 0.2% Pennsylvania German25 0.2% Welsh19 0.1% Scotch-Irish17 0.1% Maltese15 0.1% Yugoslavian14 0.1% South African13 0.10% Romanian12 0.09% Scandinavian12 0.09% Slovak10 0.08% Arab9 0.07% French Canadian9 0.07% Slavic7 0.05% Austrian7 0.05% Serbian
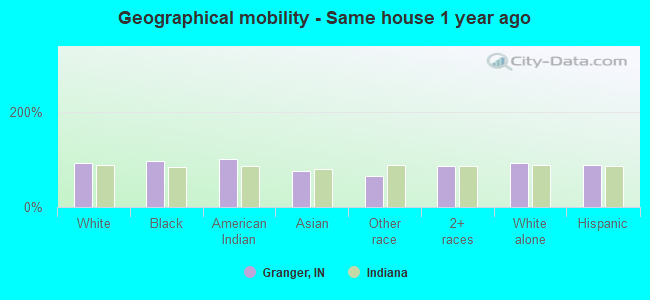
Geographical mobility in Granger Same house 1 year ago 22,091 92.7% White (Caucasian)999 97.0% Black or African American72 100.0% American Indian / Alaska Native1,550 75.8% Asian94 65.8% Other race1,926 84.8% Two or more races21,889 92.5% White alone, not Hispanic / Latino1,263 87.8% Hispanic or LatinoMoved within same county 668 2.8% White / Caucasian67 6.5% Black or African American508 24.8% Asian299 13.2% Two or more races647 2.7% White alone, not Hispanic / Latino62 4.3% Hispanic or LatinoMoved within same state 300 1.3% White / Caucasian3 0.2% Asian38 26.6% Other race72 3.2% Two or more races325 1.4% White alone, not Hispanic / Latino75 5.2% Hispanic or LatinoMoved from different state 809 3.4% White / Caucasian1 0.8% American Indian / Alaska Native24 1.2% Asian807 3.4% White alone, not Hispanic / Latino6 0.4% Hispanic or LatinoMoved from abroad 10 0.0% White10 6.8% Other race10 0.0% White alone, not Hispanic / Latino18 1.3% Hispanic or Latino
Children Nativity (place of birth) in Granger
Children under 6 years - Living with two parents Both parents native 1,861 98.3% Native31 1.7% Foreign-bornBoth parents foreign-born 281 92.1% Native24 7.9% Foreign-bornOne native, one foreign-born parent 94 100.0% NativeChildren under 6 years - Living with one parent Native parent 224 100.0% NativeForeign-born parent 7 100.0% NativeChildren 6 to 17 years - Living with two parents Both parents native 3,987 95.9% Native171 4.1% Foreign-bornBoth parents foreign-born 369 58.0% Native267 42.0% Foreign-bornOne native, one foreign-born parent 406 100.0% NativeChildren 6 to 17 years - Living with one parent Native parent 573 97.8% Native13 2.2% Foreign-bornForeign-born parent 49 63.9% Native27 36.1% Foreign-born
Grandparents responsible for own grandchildren in Granger
Grandparents (30 to 59 years) White / Caucasian 27 14.0% Responsible for grandchildren164 86.0% Not responsible for grandchildrenAmerican Indian / Alaska Native 2 100.0% Responsible for grandchildrenAsian 10 100.0% Not responsible for grandchildrenWhite alone, not Hispanic / Latino 27 15.2% Responsible for grandchildren153 84.8% Not responsible for grandchildren
Grandparents (60 years and over) White / Caucasian 193 100.0% Not responsible for grandchildrenAsian 74 100.0% Not responsible for grandchildrenWhite alone, not Hispanic / Latino 203 100.0% Not responsible for grandchildren