Estimated zip code population in 2022: 6,578 Zip code population in 2010: 6,654 Zip code population in 2000: 7,072
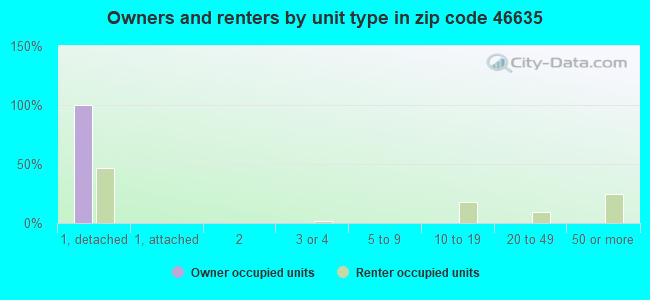
Houses and condos: 3,024 Renter-occupied apartments: 655
% of renters here:
24%
State:
29%
March 2022 cost of living index in zip code 46635: 83.9 (less than average, U.S. average is 100)
Land area: 3.1 sq. mi. Water area: 0.0 sq. mi.
Population density: 2,102 people per square mile
(low).
OSM Map
General Map
Google Map
MSN Map
OSM Map
General Map
Google Map
MSN Map
OSM Map
General Map
Google Map
MSN Map
OSM Map
General Map
Google Map
MSN Map
Please wait while loading the map...
Real estate property taxes paid for housing units in 2022:
This zip code:
0.9% ($1,694)
Indiana:
0.7% ($1,467)
Median real estate property taxes paid for housing units with mortgages in 2022: $1,733 (0.9%) Median real estate property taxes paid for housing units with no mortgage in 2022: $1,661 (0.9%)
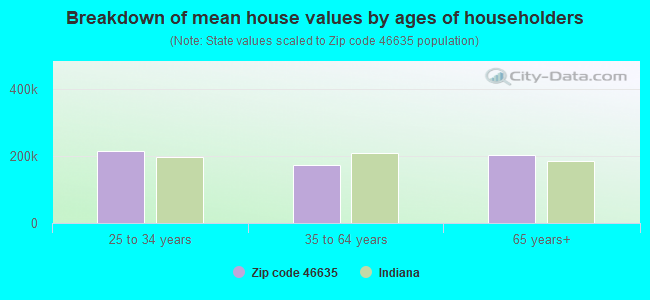
Estimated median house/condo value in 2022: $191,649
46635:
$191,649
Indiana:
$208,700
According to our research of Indiana and other state lists, there was 1 registered sex offender living in 46635 zip code as of May 16, 2024. The ratio of all residents to sex offenders in zip code 46635 is 6,592 to 1. The ratio of registered sex offenders to all residents in this zip code is much lower than the state average.
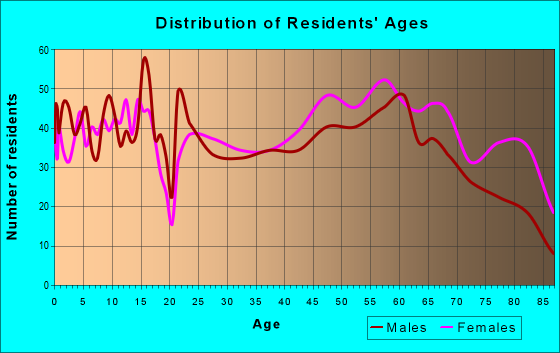
Median resident age:
This zip code:
45.0 years
Indiana median age:
38.2 years
Average household size:
This zip code:
2.3 people
Indiana:
2.4 people
Averages for the 2020 tax year for zip code 46635, filed in 2021:
Average Adjusted Gross Income (AGI) in 2020: $59,134 (Individual Income Tax Returns)
Here:
$59,134
State:
$64,978
Salary/wage: $51,247 (reported on 77.1% of returns)
Here:
$51,247
State:
$55,245
(% of AGI for various income ranges: 981.1% for AGIs below $25k, 3361.1% for AGIs $25k-50k, 6244.3% for AGIs $50k-75k, 9203.9% for AGIs $75k-100k, 15301.7% for AGIs $100k-200k, 46713.3% for AGIs over 200k)
Taxable interest for individuals: $1,290 (reported on 34.2% of returns)
This zip code:
$1,290
Indiana:
$1,351
(% of AGI for various income ranges: 25.2% for AGIs below $25k, 22.6% for AGIs $25k-50k, 49.7% for AGIs $50k-75k, 101.7% for AGIs $75k-100k, 170.4% for AGIs $100k-200k, 743.3% for AGIs over 200k)
Ordinary dividends: $5,684 (reported on 22.3% of returns)
Here:
$5,684
State:
$5,827
(% of AGI for various income ranges: 36.5% for AGIs below $25k, 55.4% for AGIs $25k-50k, 90.5% for AGIs $50k-75k, 197.0% for AGIs $75k-100k, 607.9% for AGIs $100k-200k, 3593.3% for AGIs over 200k)
Net capital gain/loss in AGI: +$10,860 (reported on 18.7% of returns)
Here:
+$10,860
State:
+$17,730
(% of AGI for various income ranges: 8.6% for AGIs below $25k, 44.9% for AGIs $25k-50k, 94.1% for AGIs $50k-75k, 186.1% for AGIs $75k-100k, 638.3% for AGIs $100k-200k, 12186.7% for AGIs over 200k)
Profit/loss from business: +$10,241 (reported on 13.2% of returns)
Here:
+$10,241
State:
+$12,144
(% of AGI for various income ranges: 130.8% for AGIs below $25k, 109.5% for AGIs $25k-50k, 161.1% for AGIs $50k-75k, 274.3% for AGIs $75k-100k, 572.9% for AGIs $100k-200k)
Taxable individual retirement arrangement distribution: $18,272 (reported on 15.2% of returns)
46635:
$18,272
Indiana:
$18,302
(% of AGI for various income ranges: 93.9% for AGIs below $25k, 189.2% for AGIs $25k-50k, 351.6% for AGIs $50k-75k, 345.7% for AGIs $75k-100k, 1946.2% for AGIs $100k-200k)
Total itemized deductions: $32,013 (reported on 4.8% of returns)
Here:
$32,013
State:
$35,601
(% of AGI for various income ranges: 90.7% for AGIs below $25k, 204.1% for AGIs $50k-75k, 249.6% for AGIs $75k-100k, 581.2% for AGIs $100k-200k, 4780.0% for AGIs over 200k)
Charity contributions: $12,631 (reported on 4.2% of returns)
Here:
$12,631
State:
$15,596
(% of AGI for various income ranges: 123.2% for AGIs $50k-75k, 191.7% for AGIs $100k-200k, 2420.0% for AGIs over 200k)
Taxes paid: $6,333 (reported on 4.8% of returns)
46635:
$6,333
State:
$7,542
(% of AGI for various income ranges: 9.9% for AGIs below $25k, 34.6% for AGIs $50k-75k, 56.1% for AGIs $75k-100k, 152.1% for AGIs $100k-200k, 860.0% for AGIs over 200k)
Earned income credit: $2,188 (reported on 13.2% of returns)
Here:
$2,188
State:
$2,298
(% of AGI for various income ranges: 78.9% for AGIs below $25k, 55.2% for AGIs $25k-50k)
Percentage of individuals using paid preparers for their 2020 taxes: 91.6%
Here:
92%
State:
94%
(% for various income ranges: 90.1% for AGIs below $25k, 90.9% for AGIs $25k-50k, 96.0% for AGIs $50k-75k, 93.9% for AGIs $75k-100k, 90.2% for AGIs $100k-200k, 87.5% for AGIs over 200k)
Averages for the 2012 tax year for zip code 46635, filed in 2013:
Average Adjusted Gross Income (AGI) in 2012: $52,870 (Individual Income Tax Returns)
Here:
$52,870
State:
$52,932
Salary/wage: $44,706 (reported on 79.0% of returns)
Here:
$44,706
State:
$45,173
(% of AGI for various income ranges: 65.9% for AGIs below $25k, 71.5% for AGIs $25k-50k, 73.1% for AGIs $50k-75k, 74.1% for AGIs $75k-100k, 69.2% for AGIs $100k-200k, 40.5% for AGIs over 200k)
Taxable interest for individuals: $1,501 (reported on 41.0% of returns)
This zip code:
$1,501
Indiana:
$1,311
(% of AGI for various income ranges: 2.5% for AGIs below $25k, 1.2% for AGIs $25k-50k, 0.6% for AGIs $50k-75k, 0.7% for AGIs $75k-100k, 1.0% for AGIs $100k-200k, 2.1% for AGIs over 200k)
Ordinary dividends: $5,077 (reported on 25.1% of returns)
Here:
$5,077
State:
$4,690
(% of AGI for various income ranges: 2.5% for AGIs below $25k, 1.8% for AGIs $25k-50k, 1.6% for AGIs $50k-75k, 1.8% for AGIs $75k-100k, 3.1% for AGIs $100k-200k, 3.7% for AGIs over 200k)
Net capital gain/loss in AGI: +$3,964 (reported on 18.6% of returns)
Here:
+$3,964
State:
+$10,406
(% of AGI for various income ranges: 0.8% for AGIs $25k-50k, 0.2% for AGIs $50k-75k, 0.5% for AGIs $75k-100k, 2.2% for AGIs $100k-200k, 4.0% for AGIs over 200k)
Profit/loss from business: +$12,182 (reported on 13.2% of returns)
Here:
+$12,182
State:
+$11,105
(% of AGI for various income ranges: 5.8% for AGIs below $25k, 2.0% for AGIs $25k-50k, 2.7% for AGIs $50k-75k, 1.4% for AGIs $75k-100k, 5.8% for AGIs $100k-200k)
Taxable individual retirement arrangement distribution: $15,328 (reported on 19.7% of returns)
46635:
$15,328
Indiana:
$13,841
(% of AGI for various income ranges: 6.9% for AGIs below $25k, 4.9% for AGIs $25k-50k, 4.6% for AGIs $50k-75k, 5.9% for AGIs $75k-100k, 9.6% for AGIs $100k-200k)
Total itemized deductions: $18,448 (19% of AGI, reported on 29.2% of returns)
Here:
$18,448
State:
$20,913
Here:
19.2% of AGI
State:
18.2% of AGI
(% of AGI for various income ranges: 10.1% for AGIs below $25k, 10.1% for AGIs $25k-50k, 9.6% for AGIs $50k-75k, 8.7% for AGIs $75k-100k, 12.1% for AGIs $100k-200k, 9.2% for AGIs over 200k)
Charity contributions: $3,667 (reported on 24.4% of returns)
Here:
$3,667
State:
$4,697
(% of AGI for various income ranges: 1.1% for AGIs below $25k, 1.2% for AGIs $25k-50k, 1.3% for AGIs $50k-75k, 1.5% for AGIs $75k-100k, 2.6% for AGIs $100k-200k, 1.8% for AGIs over 200k)
Taxes paid: $6,899 (reported on 28.8% of returns)
46635:
$6,899
State:
$7,456
(% of AGI for various income ranges: 1.5% for AGIs below $25k, 2.5% for AGIs $25k-50k, 2.9% for AGIs $50k-75k, 3.1% for AGIs $75k-100k, 5.1% for AGIs $100k-200k, 5.9% for AGIs over 200k)
Earned income credit: $2,169 (reported on 14.2% of returns)
Here:
$2,169
State:
$2,265
(% of AGI for various income ranges: 5.5% for AGIs below $25k, 0.9% for AGIs $25k-50k)
Percentage of individuals using paid preparers for their 2012 taxes: 43.4%
Here:
43%
State:
53%
(% for various income ranges: 36.6% for AGIs below $25k, 43.3% for AGIs $25k-50k, 45.8% for AGIs $50k-75k, 48.4% for AGIs $75k-100k, 54.8% for AGIs $100k-200k, 66.7% for AGIs over 200k)
Averages for the 2004 tax year for zip code 46635, filed in 2005:
Average Adjusted Gross Income (AGI) in 2004: $55,329 (Individual Income Tax Returns)
Here:
$55,329
State:
$44,790
Salary/wage: $42,273 (reported on 79.1% of returns)
Here:
$42,273
State:
$39,615
(% of AGI for various income ranges: 124.1% for AGIs below $10k, 65.5% for AGIs $10k-25k, 72.6% for AGIs $25k-50k, 76.6% for AGIs $50k-75k, 79.7% for AGIs $75k-100k, 40.6% for AGIs over 100k)
Taxable interest for individuals: $2,589 (reported on 56.5% of returns)
This zip code:
$2,589
Indiana:
$1,535
(% of AGI for various income ranges: 9.5% for AGIs below $10k, 5.5% for AGIs $10k-25k, 2.8% for AGIs $25k-50k, 1.6% for AGIs $50k-75k, 1.5% for AGIs $75k-100k, 2.8% for AGIs over 100k)
Taxable dividends: $5,810 (reported on 32.0% of returns)
Here:
$5,810
State:
$2,998
(% of AGI for various income ranges: 4.7% for AGIs below $10k, 3.2% for AGIs $10k-25k, 1.9% for AGIs $25k-50k, 1.3% for AGIs $50k-75k, 1.3% for AGIs $75k-100k, 5.4% for AGIs over 100k)
Net capital gain/loss: +$10,587 (reported on 23.5% of returns)
Here:
+$10,587
State:
+$8,619
(% of AGI for various income ranges: -3.5% for AGIs below $10k, 1.0% for AGIs $10k-25k, 1.4% for AGIs $25k-50k, 1.0% for AGIs $50k-75k, 0.7% for AGIs $75k-100k, 8.9% for AGIs over 100k)
Profit/loss from business: +$12,472 (reported on 14.2% of returns)
Here:
+$12,472
State:
+$10,071
(% of AGI for various income ranges: 6.9% for AGIs below $10k, 3.9% for AGIs $10k-25k, 2.3% for AGIs $25k-50k, 3.7% for AGIs $50k-75k, 3.2% for AGIs $75k-100k, 3.1% for AGIs over 100k)
IRA payment deduction: $3,273 (reported on 3.9% of returns)
46635:
$3,273
Indiana:
$2,840
(% of AGI for various income ranges: 0.6% for AGIs $10k-25k, 0.5% for AGIs $25k-50k, 0.3% for AGIs $50k-75k, 0.3% for AGIs $75k-100k, 0.1% for AGIs over 100k)
Self-employed pension: $12,323 (reported on 1.0% of returns)
Here:
$12,323
Indiana:
$15,305
Total itemized deductions: $19,145 (18% of AGI, reported on 36.4% of returns)
Here:
$19,145
State:
$17,065
Here:
18.3% of AGI
State:
19.5% of AGI
(% of AGI for various income ranges: 18.8% for AGIs below $10k, 9.6% for AGIs $10k-25k, 13.7% for AGIs $25k-50k, 12.9% for AGIs $50k-75k, 13.6% for AGIs $75k-100k, 12.0% for AGIs over 100k)
Charity contributions deductions: $4,190 (4% of AGI, reported on 32.2% of returns)
Here:
$4,190
State:
$3,550
Here:
3.7% of AGI
State:
3.8% of AGI
(% of AGI for various income ranges: 0.9% for AGIs below $10k, 1.3% for AGIs $10k-25k, 1.9% for AGIs $25k-50k, 2.0% for AGIs $50k-75k, 2.6% for AGIs $75k-100k, 3.0% for AGIs over 100k)
Total tax: $9,664 (reported on 76.3% of returns)
46635:
$9,664
State:
$6,914
(% of AGI for various income ranges: 3.1% for AGIs below $10k, 4.1% for AGIs $10k-25k, 6.8% for AGIs $25k-50k, 8.6% for AGIs $50k-75k, 10.8% for AGIs $75k-100k, 19.9% for AGIs over 100k)
Earned income credit: $1,477 (reported on 9.0% of returns)
Here:
$1,477
State:
$1,685
Percentage of individuals using paid preparers for their 2004 taxes: 48.6%
Here:
49%
State:
59%
(% for various income ranges: 39.7% for AGIs below $10k, 47.5% for AGIs $10k-25k, 50.5% for AGIs $25k-50k, 51.6% for AGIs $50k-75k, 50.2% for AGIs $75k-100k, 59.6% for AGIs over 100k)
Likely homosexual households (counted as self-reported same-sex unmarried-partner households)
Lesbian couples: 2.5% of all households
Gay men: 0.0% of all households
Household received Food Stamps/SNAP in the past 12 months: 221 Household did not receive Food Stamps/SNAP in the past 12 months: 2,542
Women who had a birth in the past 12 months: 92 (49 now married, 39 unmarried) Women who did not have a birth in the past 12 months: 1,361 (500 now married, 858 unmarried)
Housing units in zip code 46635 with a mortgage: 1,355 (214 second mortgage, 24 home equity loan, 171 both second mortgage and home equity loan) Houses without a mortgage: 37
Median monthly owner costs for units with a mortgage: $1,171 Median monthly owner costs for units without a mortgage: $504
Residents with income below the poverty level in 2022:
This zip code:
6.3%
Whole state:
12.6%
Residents with income below 50% of the poverty level in 2022:
This zip code:
2.1%
Whole state:
6.3%
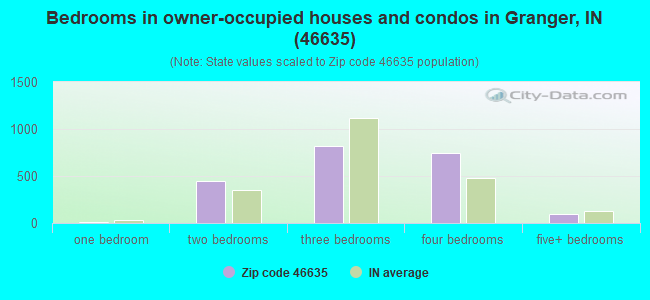
Median number of rooms in houses and condos:
Here:
7.0
State:
6.6
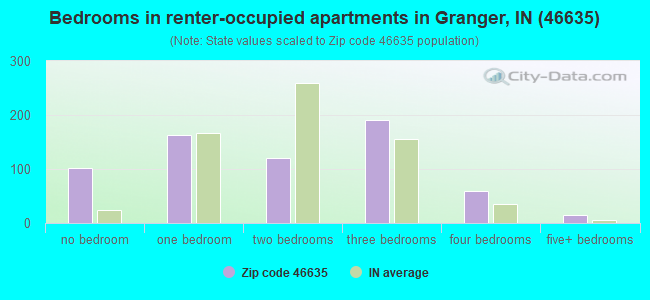
Median number of rooms in apartments:
Here:
4.0
State:
4.3
Notable locations in this zip code not listed on our city pages
In group quarters: 127 (-1 institutionalized population)
Size of family households: 643 2-persons, 377 3-persons, 353 4-persons, 120 5-persons, 58 6-persons, 26 7-or-more-persons
Size of nonfamily households: 1,024 1-person, 160 2-persons
976 married couples with children.
249 single-parent households (66 men, 183 women).
95.0% of residents of 46635 zip code speak English at home.
0.9% of residents speak Spanish at home (73% very well, 7% well, 20% not well).
1.8% of residents speak other Indo-European language at home (89% very well, 11% well).
1.7% of residents speak Asian or Pacific Island language at home (83% very well, 17% well).
0.4% of residents speak other language at home (56% very well, 44% well).
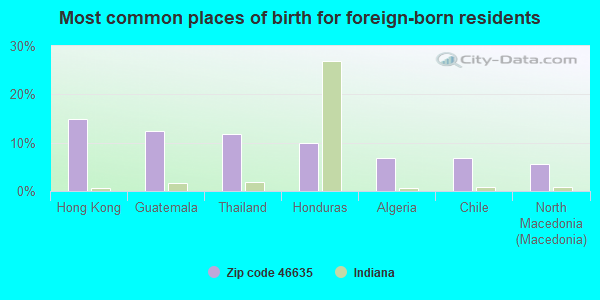
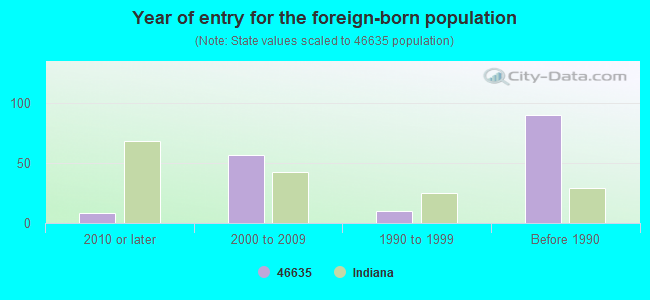
Foreign born population: 163 (2.5%) (86.9% of them are naturalized citizens)
Facilities with environmental interests located in this zip code:
BOOTH TARKINGTON ELEMENTARY SCHL (3414 HEPLER ST in SOUTH BEND, IN)
STATE MASTER (Indiana facility tracking) - CRTK-8974, EPCRA (National Center for Education Statistics) - STATE ID-7621 Organizations: SOUTH BEND COMMUNITY SCH CORP (SCHOOL DISTRICT)
CONCORD CUSTOM CLEANERS 6142 (17917 ST RD 23 in SOUTH BEND, IN)
STATE MASTER (Indiana facility tracking) (Resource Conservation and Recovery Act (tracking hazardous waste)) Organizations: BEGLEY CO (CONTACT/OWNER)
OSI ENVIRONMENTAL INC (2004 IRONWOOD CIR in SOUTH BEND, IN)
STATE MASTER (Indiana facility tracking) (Resource Conservation and Recovery Act (tracking hazardous waste)) Organizations: PREMIER COMMERCIAL RENTALS LLC (CONTACT/OWNER)
REGENCY PLACE OF SOUTH BEND (52654 N IRONWOOD in SOUTH BEND, IN)
STATE MASTER (Indiana facility tracking) (Resource Conservation and Recovery Act (tracking hazardous waste)) Organizations: VENCOR (CONTACT/OWNER)
AMERICAN BIOGENETIC SCIENCES (1539 N IRONWOOD DR STE 200 in SOUTH BEND, IN)
STATE MASTER (Indiana facility tracking) Conditionally Exempt Small Quantity Generators, less than 100 kg/month of hazardous waste (Resource Conservation and Recovery Act (tracking hazardous waste)) - notification TRANSPORTER (Resource Conservation and Recovery Act (tracking hazardous waste)) - notification Organizations: VAN E GATES (CONTACT/OWNER)
MICHIANA ENDOSCOPY (53830 GENERATIONS DR in SOUTH BEND, IN)
STATE MASTER (Indiana facility tracking) Conditionally Exempt Small Quantity Generators, less than 100 kg/month of hazardous waste (Resource Conservation and Recovery Act (tracking hazardous waste)) - notification
Housing units lacking complete kitchen facilities: 3.3%
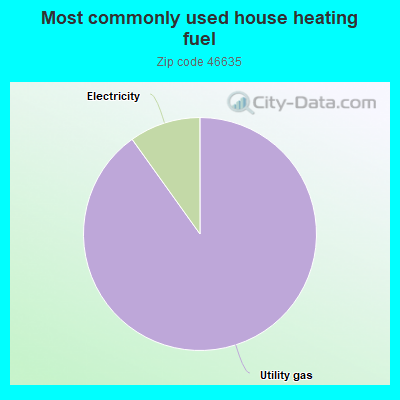
90.2%Utility gas
9.9%Electricity
Population in 1990: 6,989. Population change in the 1990s: +83 (+1.2%).
Place of birth for U.S.-born residents:
This state: 4,766
Northeast: 150
Midwest: 960
South: 325
West: 177
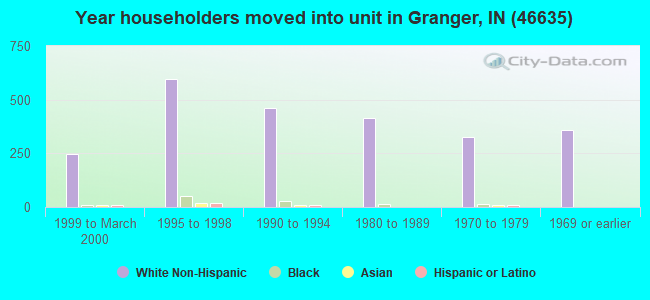
65% of the 46635 zip code residents lived in the same house 5 years ago. Out of people who lived in different houses, 68% lived in this county. Out of people who lived in different counties, 50% lived in Indiana.
90% of the 46635 zip code residents lived in the same house 1 year ago. Out of people who lived in different houses, 69% moved from this county. Out of people who lived in different houses, 6% moved from different county within same state. Out of people who lived in different houses, 25% moved from different state.
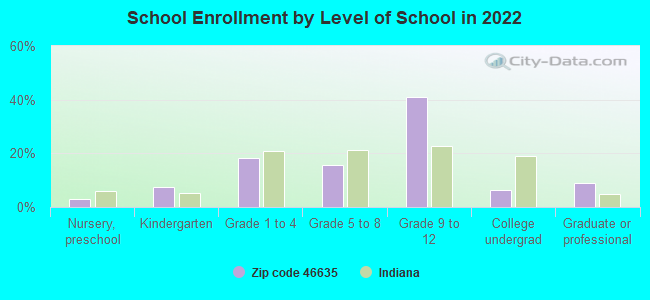
Private vs. public school enrollment:
Students in private schools in grades 1 to 8 (elementary and middle school): 270
Here:
51.1%
Indiana:
14.9%
Students in private schools in grades 9 to 12 (high school): 138
Here:
21.9%
Indiana:
11.4%
Students in private undergraduate colleges: 38
Here:
39.8%
Indiana:
22.3%
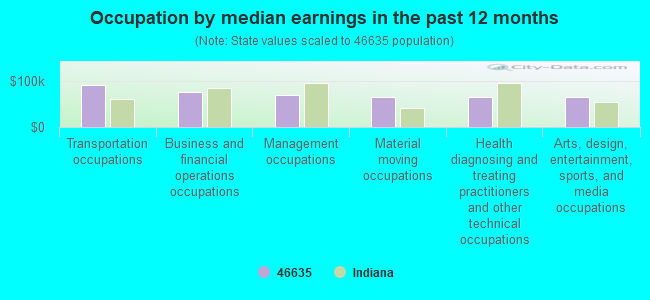
Occupation by median earnings in the past 12 months ($)
90,720Transportation occupations
76,092Business and financial operations occupations
69,363Management occupations
65,315Material moving occupations
64,929Health diagnosing and treating practitioners and other technical occupations
64,530Arts, design, entertainment, sports, and media occupations
Companies with federal contracts located in this zip code:
EIS ENVIRONMENTAL ENGINEERS, I (1701 N IRONWOOD DR in SOUTH BEND, IN; small business) : $63,568 in 26 contractsfrom 2001 to 2006
Contracts for Other Professional Services, Water Quality Studies by Army, U.S. Army Corps of Engineers - civil program financing only Signed by year:2000: $0; 2001: $1,769; 2002: $263; 2003: $6,639; 2004: $25,642; 2005: $17,162; 2006: $12,093.
Biggest contracts:
$12,330 with Army for Other Professional Services. Signed on 2006-05-03. Completion date: 2007-05-14.
$7,213 with Army for Water Quality Studies. Signed on 2005-04-27. Completion date: 2005-05-02.
$7,213 with U.S. Army Corps of Engineers - civil program financing only for Water Quality Studies. Signed on 2005-04-27. Completion date: 2005-05-02.
$6,808 with U.S. Army Corps of Engineers - civil program financing only for Other Professional Services. Taking place in IL. Signed on 2004-04-08. Completion date: 2004-05-17.
Top industries in this zip code by the number of employees in 2005:
Health Care and Social Assistance: Home Health Care Services (250-499 employees: 1 establishment)
Health Care and Social Assistance: Nursing Care Facilities (100-249: 2)
Other Services (except Public Administration): Religious Organizations (50-99: 1, 20-49: 1, 10-19: 2, 5-9: 2, 1-4: 3)
Health Care and Social Assistance: Offices of Dentists (20-49: 1, 10-19: 5, 5-9: 2, 1-4: 1)
Construction: Drywall and Insulation Contractors (50-99: 1)
Other Services (except Public Administration): Diet and Weight Reducing Centers (50-99: 1)
Health Care and Social Assistance: Diagnostic Imaging Centers (50-99: 1)
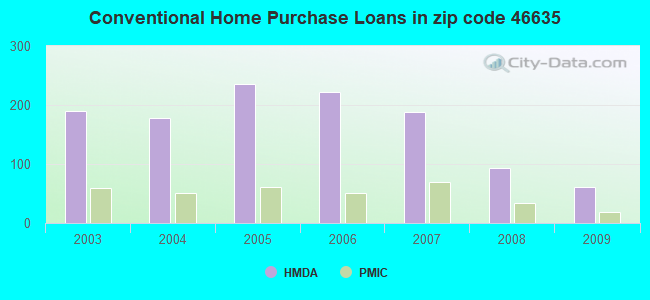
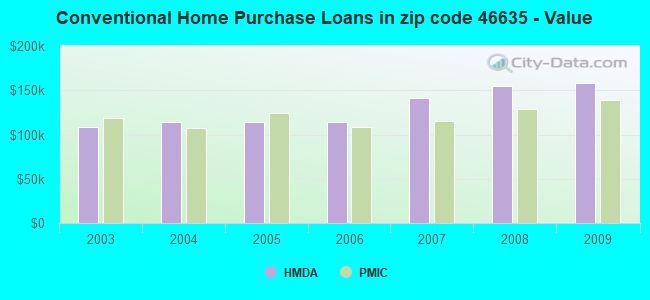
Detailed PMIC statistics for the following Tracts:0113.01
, 0113.05
2003 - 2018 National Fire Incident Reporting System (NFIRS) incidents
Based on the data from the years 2003 - 2018 the average number of fires per year is 12. The highest number of reported fire incidents - 22 took place in 2017, and the least - 1 in 2014. The data has a rising trend.
When looking into fire subcategories, the most reports belonged to: Outside Fires (43.8%), and Structure Fires (41.7%).
Fire incident types reported to NFIRS in Zip Code 46635
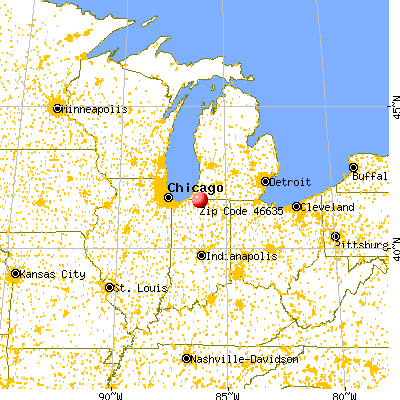


 Nearest zip codes: 46615, 46637, 46617, 46556, 46545, 46616.


 Based on the data from the years 2003 - 2018 the average number of fires per year is 12. The highest number of reported fire incidents - 22 took place in 2017, and the least - 1 in 2014. The data has a rising trend.
 When looking into fire subcategories, the most reports belonged to: Outside Fires (43.8%), and Structure Fires (41.7%).