Races in Gray-Griswold, Georgia (GA) Detailed Stats
Ancestries, Foreign-born residents, place of birth
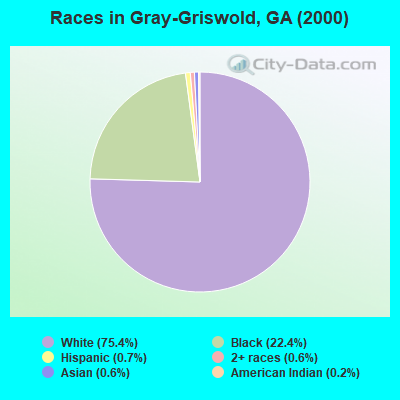
Race distribution in Gray-Griswold

- 15,48275.4%White alone
- 4,60422.4%Black alone
- 1460.7%Hispanic
- 1210.6%Asian alone
- 1270.6%Two or more races
- 310.2%American Indian alone
- 130.06%Other race alone
- 20.01%Native Hawaiian and Other
Pacific Islander alone
2000
2022
-
- 5,128,66162.6%White alone
- 2,331,46528.5%Black alone
- 435,2275.3%Hispanic
- 171,5132.1%Asian alone
- 87,3641.1%Two or more races
- 17,6700.2%American Indian alone
- 11,2750.1%Other race alone
- 3,2780.04%Native Hawaiian and Other
Pacific Islander alone

-
- 5,415,65749.6%White alone
- 3,349,24030.7%Black alone
- 1,132,60410.4%Hispanic
- 479,1564.4%Asian alone
- 462,9234.2%Two or more races
- 54,4160.5%Other race alone
- 11,9230.1%American Indian alone
- 6,9570.06%Native Hawaiian and Other
Pacific Islander alone

Income and house value in Gray-Griswold
- Median household income in 2022
- $82,851White non-Hispanic householders
- $64,213Black householders
- $50,676American Indian and Alaska Native householders
- $74,986Asian householders
- $9,304Some other race householders
- $148,860Two or more races householders
- $17,903Hispanic or Latino race householders
- Median 2022 house value
- $242,474White Non-Hispanic householders
- $185,335Black or African American householders
- $255,171American Indian or Alaska Native householders
- $229,532Asian householders
- $183,137Some other race householders
- $186,800Two or more races householders
- $177,032Hispanic or Latino householders
Household income for White non-Hispanic householders

Household income for Black householders

Household income for American Indian and Alaska Native householders

Household income for Asian householders

Household income for Two or more races householders

Household income for Hispanic or Latino race householders

Zip code: 31032