Races in Harrisburg, Pennsylvania (PA) Detailed Stats
Data:
Races - White alone (%)
Races - White alone (% change since 2000)
Races - Black alone (%)
Races - Black alone (% change since 2000)
Races - American Indian alone (%)
Races - American Indian alone (% change since 2000)
Races - Asian alone (%)
Races - Asian alone (% change since 2000)
Races - Hispanic (%)
Races - Hispanic (% change since 2000)
Races - Native Hawaiian and Other Pacific Islander alone (%)
Races - Native Hawaiian and Other Pacific Islander alone (% change since 2000)
Races - Two or more races(%)
Races - Two or more races(% change since 2000)
Races - Other race alone (%)
Races - Other race alone (% change since 2000)
Racial diversity
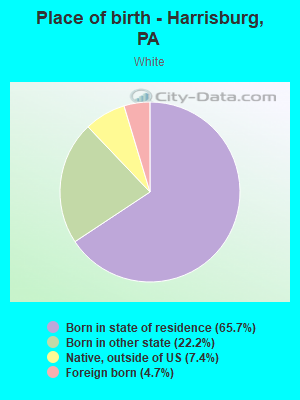
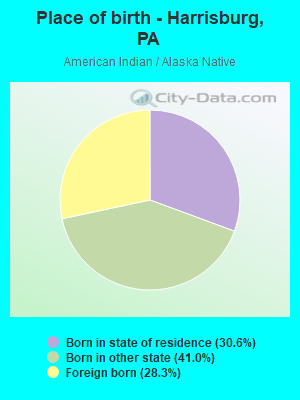
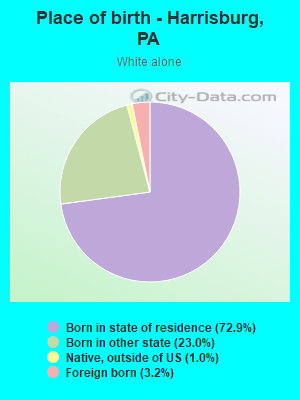
Place of birth - Born in state of residence (%)
Place of birth - Born in state of residence (%) - White
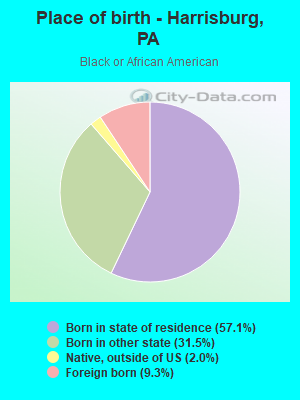
Place of birth - Born in state of residence (%) - Black or African American
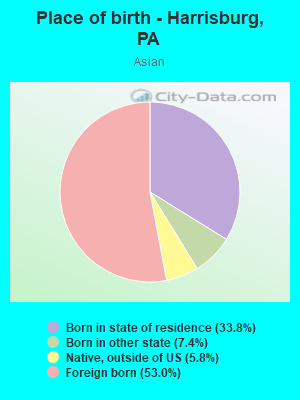
Place of birth - Born in state of residence (%) - Asian
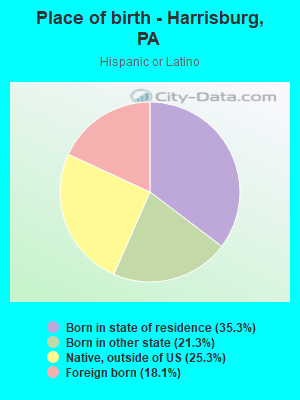
Place of birth - Born in state of residence (%) - Hispanic or Latino
Place of birth - Born in state of residence (%) - American Indian and Alaska Native
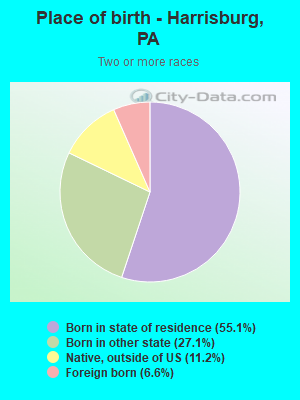
Place of birth - Born in state of residence (%) - Multirace
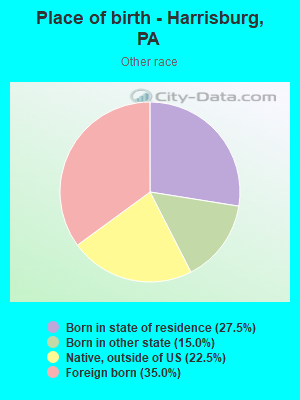
Place of birth - Born in state of residence (%) - Other Race
Place of birth - Born in other state (%)
Place of birth - Born in other state (%) - White
Place of birth - Born in other state (%) - Black or African American
Place of birth - Born in other state (%) - Asian
Place of birth - Born in other state (%) - Hispanic or Latino
Place of birth - Born in other state (%) - American Indian and Alaska Native
Place of birth - Born in other state (%) - Multirace
Place of birth - Born in other state (%) - Other Race
Place of birth - Native, outside of US (%)
Place of birth - Native, outside of US (%) - White
Place of birth - Native, outside of US (%) - Black or African American
Place of birth - Native, outside of US (%) - Asian
Place of birth - Native, outside of US (%) - Hispanic or Latino
Place of birth - Native, outside of US (%) - American Indian and Alaska Native
Place of birth - Native, outside of US (%) - Multirace
Place of birth - Native, outside of US (%) - Other Race
Place of birth - Foreign born (%)
Place of birth - Foreign born (%) - White
Place of birth - Foreign born (%) - Black or African American
Place of birth - Foreign born (%) - Asian
Place of birth - Foreign born (%) - Hispanic or Latino
Place of birth - Foreign born (%) - American Indian and Alaska Native
Place of birth - Foreign born (%) - Multirace
Place of birth - Foreign born (%) - Other Race
Residents speaking English at home (%)
Residents speaking English at home - Born in the United States (%)
Residents speaking English at home - Native, born elsewhere (%)
Residents speaking English at home - Foreign born (%)
Residents speaking Spanish at home (%)
Residents speaking Spanish at home - Born in the United States (%)
Residents speaking Spanish at home - Native, born elsewhere (%)
Residents speaking Spanish at home - Foreign born (%)
Residents speaking other language at home (%)
Residents speaking other language at home - Born in the United States (%)
Residents speaking other language at home - Native, born elsewhere (%)
Residents speaking other language at home - Foreign born (%)
Marital status - Never married (%)
Marital status - Now married (%)
Marital status - Separated (%)
Marital status - Widowed (%)
Marital status - Divorced (%)
Ancestries Reported - Arab (%)
Ancestries Reported - Czech (%)
Ancestries Reported - Danish (%)
Ancestries Reported - Dutch (%)
Ancestries Reported - English (%)
Ancestries Reported - French (%)
Ancestries Reported - French Canadian (%)
Ancestries Reported - German (%)
Ancestries Reported - Greek (%)
Ancestries Reported - Hungarian (%)
Ancestries Reported - Irish (%)
Ancestries Reported - Italian (%)
Ancestries Reported - Lithuanian (%)
Ancestries Reported - Norwegian (%)
Ancestries Reported - Polish (%)
Ancestries Reported - Portuguese (%)
Ancestries Reported - Russian (%)
Ancestries Reported - Scotch-Irish (%)
Ancestries Reported - Scottish (%)
Ancestries Reported - Slovak (%)
Ancestries Reported - Subsaharan African (%)
Ancestries Reported - Swedish (%)
Ancestries Reported - Swiss (%)
Ancestries Reported - Ukrainian (%)
Ancestries Reported - United States (%)
Ancestries Reported - Welsh (%)
Ancestries Reported - West Indian (%)
Ancestries Reported - Other (%)
Geographical mobility - Same house 1 year ago (%)
Geographical mobility - Same house 1 year ago (%) - White
Geographical mobility - Same house 1 year ago (%) - Black or African American
Geographical mobility - Same house 1 year ago (%) - Asian
Geographical mobility - Same house 1 year ago (%) - Hispanic or Latino
Geographical mobility - Same house 1 year ago (%) - American Indian and Alaska Native
Geographical mobility - Same house 1 year ago (%) - Multirace
Geographical mobility - Same house 1 year ago (%) - Other Race
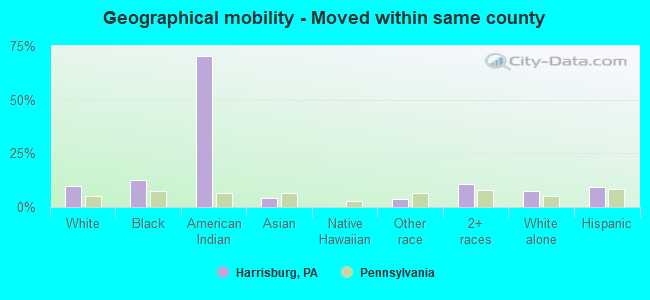
Geographical mobility - Moved within same county (%)
Geographical mobility - Moved within same county (%) - White
Geographical mobility - Moved within same county (%) - Black or African American
Geographical mobility - Moved within same county (%) - Asian
Geographical mobility - Moved within same county (%) - Hispanic or Latino
Geographical mobility - Moved within same county (%) - American Indian and Alaska Native
Geographical mobility - Moved within same county (%) - Multirace
Geographical mobility - Moved within same county (%) - Other Race
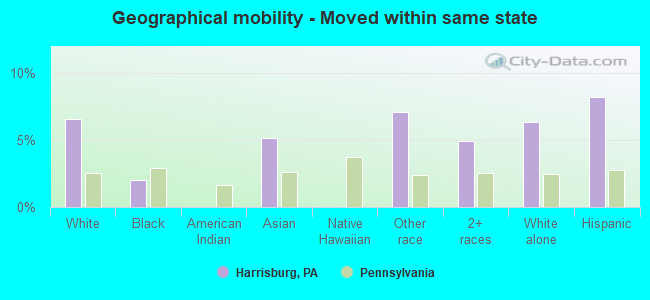
Geographical mobility - Moved from different county within same state (%)
Geographical mobility - Moved from different county within same state (%) - White
Geographical mobility - Moved from different county within same state (%) - Black or African American
Geographical mobility - Moved from different county within same state (%) - Asian
Geographical mobility - Moved from different county within same state (%) - Hispanic or Latino
Geographical mobility - Moved from different county within same state (%) - American Indian and Alaska Native
Geographical mobility - Moved from different county within same state (%) - Multirace
Geographical mobility - Moved from different county within same state (%) - Other Race
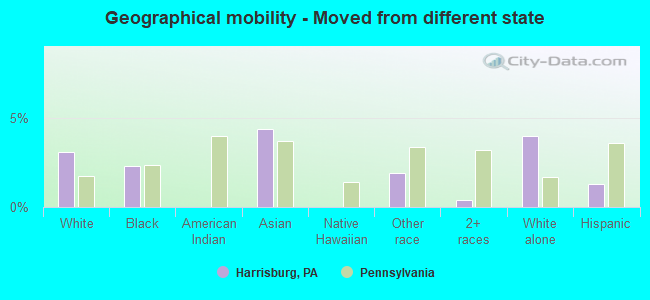
Geographical mobility - Moved from different state (%)
Geographical mobility - Moved from different state (%) - White
Geographical mobility - Moved from different state (%) - Black or African American
Geographical mobility - Moved from different state (%) - Asian
Geographical mobility - Moved from different state (%) - Hispanic or Latino
Geographical mobility - Moved from different state (%) - American Indian and Alaska Native
Geographical mobility - Moved from different state (%) - Multirace
Geographical mobility - Moved from different state (%) - Other Race
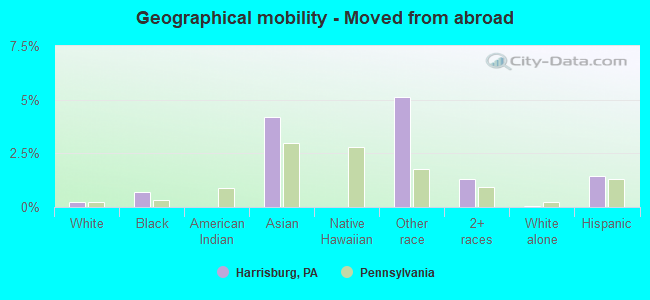
Geographical mobility - Moved from abroad (%)
Geographical mobility - Moved from abroad (%) - White
Geographical mobility - Moved from abroad (%) - Black or African American
Geographical mobility - Moved from abroad (%) - Asian
Geographical mobility - Moved from abroad (%) - Hispanic or Latino
Geographical mobility - Moved from abroad (%) - American Indian and Alaska Native
Geographical mobility - Moved from abroad (%) - Multirace
Geographical mobility - Moved from abroad (%) - Other Race
Place of birth for the foreign-born population - Ireland (%)
Place of birth for the foreign-born population - Denmark (%)
Place of birth for the foreign-born population - Norway (%)
Place of birth for the foreign-born population - Sweden (%)
Place of birth for the foreign-born population - United Kingdom (%)
Place of birth for the foreign-born population - England (%)
Place of birth for the foreign-born population - Scotland (%)
Place of birth for the foreign-born population - Other Northern Europe (%)
Place of birth for the foreign-born population - Austria (%)
Place of birth for the foreign-born population - Belgium (%)
Place of birth for the foreign-born population - France (%)
Place of birth for the foreign-born population - Germany (%)
Place of birth for the foreign-born population - Netherlands (%)
Place of birth for the foreign-born population - Switzerland (%)
Place of birth for the foreign-born population - Other Western Europe (%)
Place of birth for the foreign-born population - Greece (%)
Place of birth for the foreign-born population - Italy (%)
Place of birth for the foreign-born population - Portugal (%)
Place of birth for the foreign-born population - Spain (%)
Place of birth for the foreign-born population - Other Southern Europe (%)
Place of birth for the foreign-born population - Albania (%)
Place of birth for the foreign-born population - Belarus (%)
Place of birth for the foreign-born population - Bosnia and Herzegovina (%)
Place of birth for the foreign-born population - Bulgaria (%)
Place of birth for the foreign-born population - Croatia (%)
Place of birth for the foreign-born population - Czechoslovakia (%)
Place of birth for the foreign-born population - Hungary (%)
Place of birth for the foreign-born population - Latvia (%)
Place of birth for the foreign-born population - Lithuania (%)
Place of birth for the foreign-born population - North Macedonia (Macedonia) (%)
Place of birth for the foreign-born population - Moldova (%)
Place of birth for the foreign-born population - Poland (%)
Place of birth for the foreign-born population - Romania (%)
Place of birth for the foreign-born population - Russia (%)
Place of birth for the foreign-born population - Serbia (%)
Place of birth for the foreign-born population - Ukraine (%)
Place of birth for the foreign-born population - Other Eastern Europe (%)
Place of birth for the foreign-born population - China (%)
Place of birth for the foreign-born population - Hong Kong (%)
Place of birth for the foreign-born population - Taiwan (%)
Place of birth for the foreign-born population - Japan (%)
Place of birth for the foreign-born population - Korea (%)
Place of birth for the foreign-born population - Other Eastern Asia (%)
Place of birth for the foreign-born population - Afghanistan (%)
Place of birth for the foreign-born population - Bangladesh (%)
Place of birth for the foreign-born population - India (%)
Place of birth for the foreign-born population - Iran (%)
Place of birth for the foreign-born population - Kazakhstan (%)
Place of birth for the foreign-born population - Nepal (%)
Place of birth for the foreign-born population - Pakistan (%)
Place of birth for the foreign-born population - Sri Lanka (%)
Place of birth for the foreign-born population - Uzbekistan (%)
Place of birth for the foreign-born population - Other South Central Asia (%)
Place of birth for the foreign-born population - Burma (%)
Place of birth for the foreign-born population - Cambodia (%)
Place of birth for the foreign-born population - Indonesia (%)
Place of birth for the foreign-born population - Laos (%)
Place of birth for the foreign-born population - Malaysia (%)
Place of birth for the foreign-born population - Philippines (%)
Place of birth for the foreign-born population - Singapore (%)
Place of birth for the foreign-born population - Thailand (%)
Place of birth for the foreign-born population - Vietnam (%)
Place of birth for the foreign-born population - Other South Eastern Asia (%)
Place of birth for the foreign-born population - Armenia (%)
Place of birth for the foreign-born population - Iraq (%)
Place of birth for the foreign-born population - Israel (%)
Place of birth for the foreign-born population - Jordan (%)
Place of birth for the foreign-born population - Kuwait (%)
Place of birth for the foreign-born population - Lebanon (%)
Place of birth for the foreign-born population - Saudi Arabia (%)
Place of birth for the foreign-born population - Syria (%)
Place of birth for the foreign-born population - Turkey (%)
Place of birth for the foreign-born population - Yemen (%)
Place of birth for the foreign-born population - Other Western Asia (%)
Place of birth for the foreign-born population - Eritrea (%)
Place of birth for the foreign-born population - Ethiopia (%)
Place of birth for the foreign-born population - Kenya (%)
Place of birth for the foreign-born population - Somalia (%)
Place of birth for the foreign-born population - Uganda (%)
Place of birth for the foreign-born population - Zimbabwe (%)
Place of birth for the foreign-born population - Other Eastern Africa (%)
Place of birth for the foreign-born population - Cameroon (%)
Place of birth for the foreign-born population - Congo (%)
Place of birth for the foreign-born population - Democratic Republic of Congo (Zaire) (%)
Place of birth for the foreign-born population - Other Middle Africa (%)
Place of birth for the foreign-born population - Egypt (%)
Place of birth for the foreign-born population - Morocco (%)
Place of birth for the foreign-born population - Sudan (%)
Place of birth for the foreign-born population - Other Northern Africa (%)
Place of birth for the foreign-born population - South Africa (%)
Place of birth for the foreign-born population - Other Southern Africa (%)
Place of birth for the foreign-born population - Cabo Verde (%)
Place of birth for the foreign-born population - Ghana (%)
Place of birth for the foreign-born population - Liberia (%)
Place of birth for the foreign-born population - Nigeria (%)
Place of birth for the foreign-born population - Senegal (%)
Place of birth for the foreign-born population - Sierra Leone (%)
Place of birth for the foreign-born population - Other Western Africa (%)
Place of birth for the foreign-born population - Australia (%)
Place of birth for the foreign-born population - New Zealand (%)
Place of birth for the foreign-born population - Fiji (%)
Place of birth for the foreign-born population - Micronesia (%)
Place of birth for the foreign-born population - Bahamas (%)
Place of birth for the foreign-born population - Barbados (%)
Place of birth for the foreign-born population - Cuba (%)
Place of birth for the foreign-born population - Dominica (%)
Place of birth for the foreign-born population - Dominican Republic (%)
Place of birth for the foreign-born population - Grenada (%)
Place of birth for the foreign-born population - Haiti (%)
Place of birth for the foreign-born population - Jamaica (%)
Place of birth for the foreign-born population - St. Vincent and the Grenadines (%)
Place of birth for the foreign-born population - Trinidad and Tobago (%)
Place of birth for the foreign-born population - West Indies (%)
Place of birth for the foreign-born population - Other Caribbean (%)
Place of birth for the foreign-born population - Belize (%)
Place of birth for the foreign-born population - Costa Rica (%)
Place of birth for the foreign-born population - El Salvador (%)
Place of birth for the foreign-born population - Guatemala (%)
Place of birth for the foreign-born population - Honduras (%)
Place of birth for the foreign-born population - Mexico (%)
Place of birth for the foreign-born population - Nicaragua (%)
Place of birth for the foreign-born population - Panama (%)
Place of birth for the foreign-born population - Other Central America (%)
Place of birth for the foreign-born population - Argentina (%)
Place of birth for the foreign-born population - Bolivia (%)
Place of birth for the foreign-born population - Brazil (%)
Place of birth for the foreign-born population - Chile (%)
Place of birth for the foreign-born population - Colombia (%)
Place of birth for the foreign-born population - Ecuador (%)
Place of birth for the foreign-born population - Guyana (%)
Place of birth for the foreign-born population - Peru (%)
Place of birth for the foreign-born population - Uruguay (%)
Place of birth for the foreign-born population - Venezuela (%)
Place of birth for the foreign-born population - Other South America (%)
Place of birth for the foreign-born population - Canada (%)
Place of birth for the foreign-born population - Other Northern America (%)
Place of birth for the foreign-born population - Other (%)
Latest news about races in Harrisburg, PA collected exclusively by city-data.com from local newspapers, TV, and radio stations
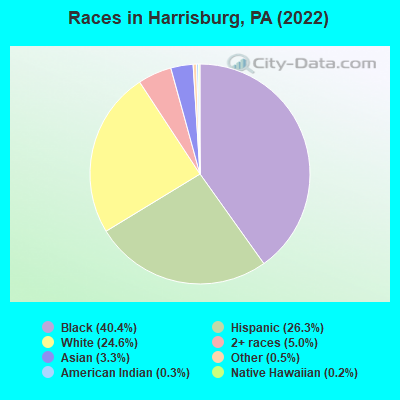
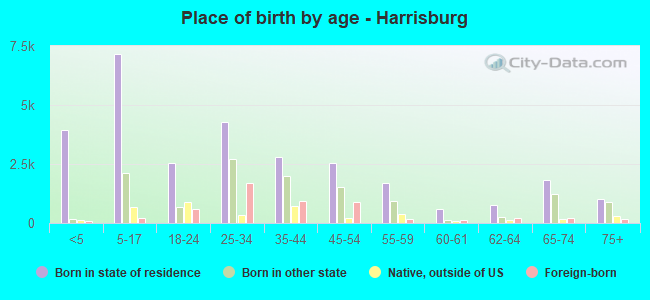
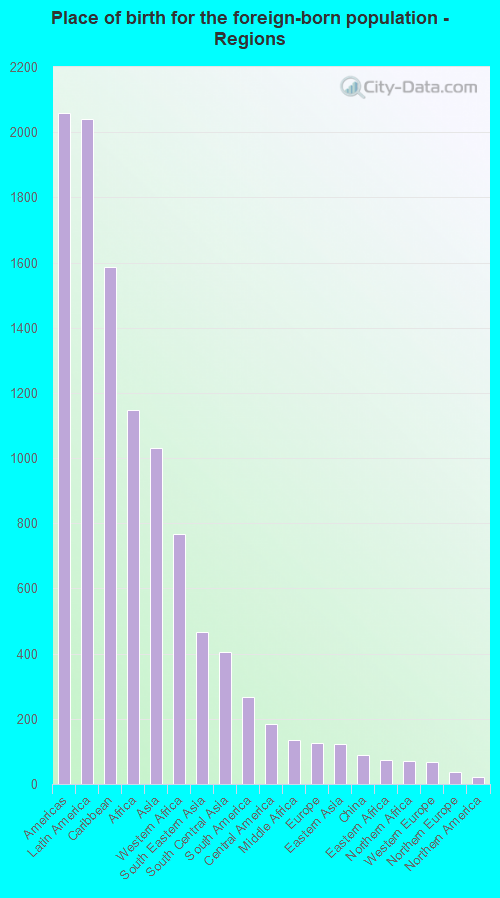
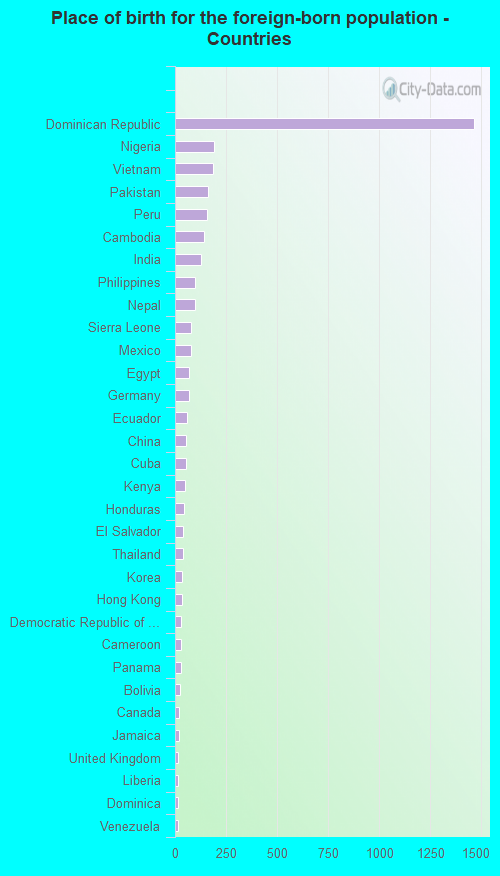
According to 2022 data, the most numerous races in Harrisburg, PA are White alone (12,425 residents), Black alone (20,434 residents), and Hispanic (13,271 residents). 77.0% of Harrisburg residents speak English at home. 8.6% of Harrisburg, PA residents are foreign-born (3.9% born in Latin America, 2.2% born in Africa, 2.0% born in Asia), which is 19.0% greater than the foreign-born rate of 7.0% across the entire state of Pennsylvania.
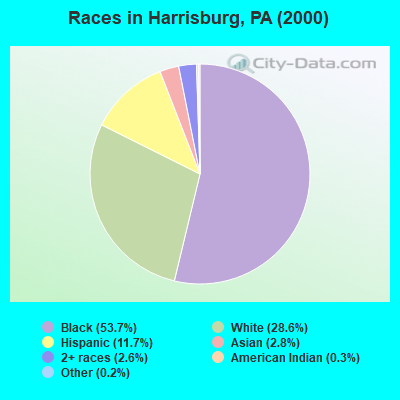
Race distribution in Harrisburg
2000 2022
26,292 53.7% Black alone 13,988 28.6% White alone 5,724 11.7% Hispanic 1,370 2.8% Asian alone 1,284 2.6% Two or more races 157 0.3% American Indian alone 115 0.2% Other race alone 20 0.04% Native Hawaiian and Other
20,434 40.4% Black alone 13,271 26.3% Hispanic 12,425 24.6% White alone 2,507 5.0% Two or more races 1,653 3.3% Asian alone 253 0.5% Other race alone 143 0.3% American Indian alone 89 0.2% Native Hawaiian and Other
2000 2022
10,322,455 84.1% White alone 1,202,437 9.8% Black alone 394,088 3.2% Hispanic 218,296 1.8% Asian alone 113,097 0.9% Two or more races 13,086 0.1% Other race alone 14,904 0.1% American Indian alone 2,691 0.02% Native Hawaiian and Other
9,487,228 73.1% White alone 1,311,581 10.1% Black alone 1,115,997 8.6% Hispanic 493,942 3.8% Two or more races 487,124 3.8% Asian alone 63,582 0.5% Other race alone 10,130 0.08% American Indian alone 2,424 0.02% Native Hawaiian and Other
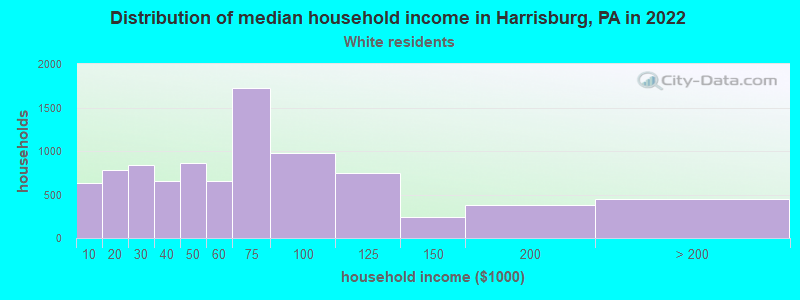
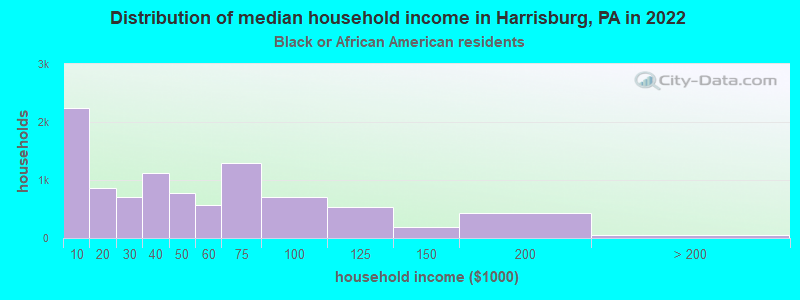
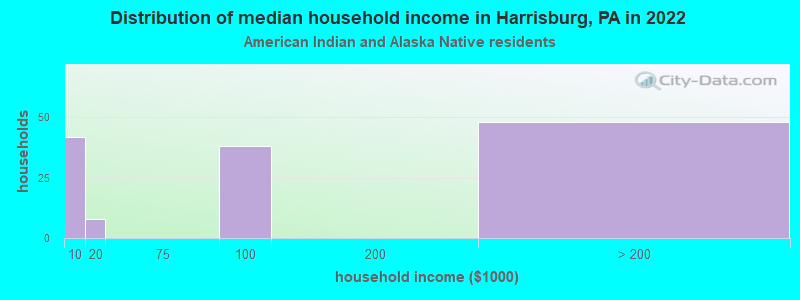
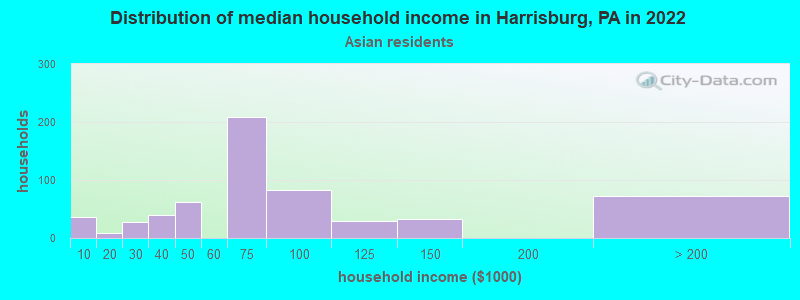
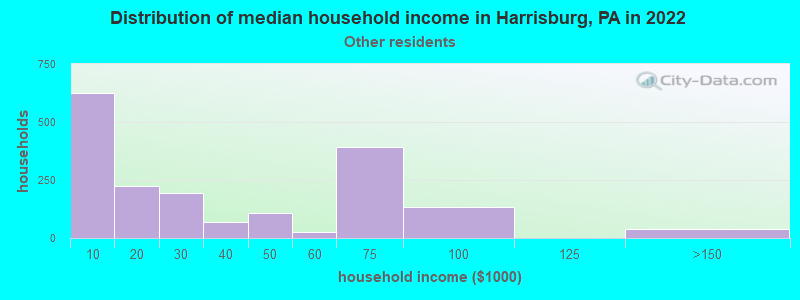
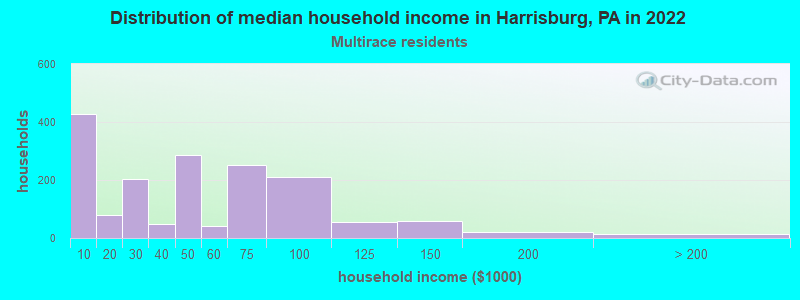
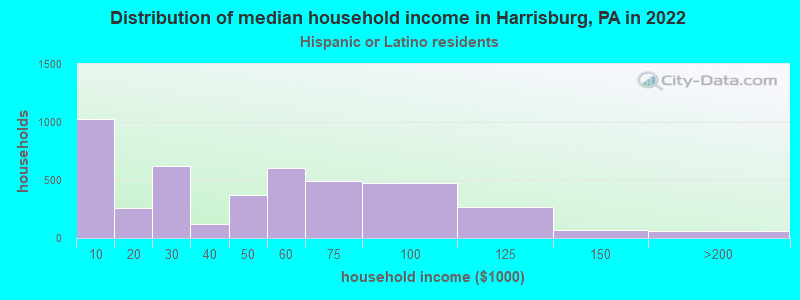
Income and house value in Harrisburg Median household income in 2022 $59,805 White non-Hispanic householders$39,683 Black householders$71,203 Asian householders$31,128 Some other race householders$36,928 Two or more races householders$41,192 Hispanic or Latino race householdersMedian 2022 house value $128,573 White Non-Hispanic householders$111,087 Black or African American householders$114,790 American Indian or Alaska Native householders $114,790 Asian householders$97,304 Some other race householders$118,082 Two or more races householders$103,270 Hispanic or Latino householders
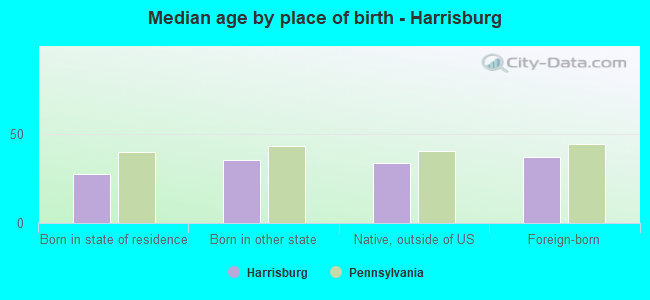
Median age by race in Harrisburg
35.5 Median age for White residents36.1 35.0 33.4 Median age for Black or African American residents32.2 34.3 32.5 Median age for American Indian / Alaska Native residents40.3 47.4 33.0 Median age for Asian residents39.3 30.0 -680,432,644.4 Median age for Native Hawaiian / Pacific Islander residents-649,523,808.9 -747,474,746.7 22.6 Median age for Other race residents20.7 30.5 24.8 Median age for Two or more races residents25.1 25.4 39.4 Median age for White alone residents40.1 38.6 28.4 Median age for Hispanic or Latino residents27.8 30.3
Owner/renter occupied households by race in Harrisburg
House owners and renters - White residents 3,762 42.9% Owner occupied4,997 57.1% Renter occupiedHouse owners and renters - Black or African American residents 3,513 38.1% Owner occupied5,707 61.9% Renter occupiedHouse owners and renters - American Indian / Alaska Native residents 20 13.9% Owner occupied121 86.1% Renter occupiedHouse owners and renters - Asian residents 214 27.5% Owner occupied566 72.5% Renter occupiedHouse owners and renters - Native Hawaiian / Pacific Islander residents 55 100.0% Owner occupiedHouse owners and renters - Other race residents 189 8.1% Owner occupied2,144 91.9% Renter occupiedHouse owners and renters - Two or more races residents 409 24.4% Owner occupied1,270 75.6% Renter occupiedHouse owners and renters - White alone residents 3,381 47.3% Owner occupied3,769 52.7% Renter occupiedHouse owners and renters - Hispanic or Latino residents 914 19.1% Owner occupied3,878 80.9% Renter occupied
Language usage in Harrisburg
English speakers - Total 77.0% of residents of Harrisburg speak English at home.
19.3% of residents speak Spanish at home 4,286 48.0% Speak English very well4,643 52.0% Speak English less than very well6.0% of residents speak other language at home 1,707 61.2% Speak English very well1,083 38.8% Speak English less than very well
English speakers - Born in the United States 88.0% of residents of Harrisburg speak English at home.
11.3% of residents speak Spanish at home 1,292 92.7% Speak English very well101 7.3% Speak English less than very well1.3% of residents speak other language at home 155 96.9% Speak English very well5 3.1% Speak English less than very well
English speakers - Native, born elsewhere 16.3% of residents of Harrisburg speak English at home.
80.7% of residents speak Spanish at home 981 30.5% Speak English very well2,239 69.5% Speak English less than very well3.1% of residents speak other language at home 68 55.3% Speak English very well55 44.7% Speak English less than very well
English speakers - Foreign-born 18.8% of residents of Harrisburg speak English at home.
45.1% of residents speak Spanish at home 719 30.9% Speak English very well1,610 69.1% Speak English less than very well33.7% of residents speak other language at home 805 46.2% Speak English very well936 53.8% Speak English less than very well
White (Caucasian) - Speak only English Native:
86.6% (12,680)Foreign-born:
9.1% (71)
White (Caucasian) - Speak another language Native:
13.5% (1,971)Foreign-born:
75.9% (591)
Black or African American - Speak only English Native:
98.0% (16,315)Foreign-born:
40.6% (774)
Black or African American - Speak another language Native:
5.8% (963)Foreign-born:
45.6% (869)
American Indian / Alaska Native - Speak another language Native:
6.1% (13)Foreign-born:
100.0% (91)
Asian - Speak only English Native:
46.2% (316)Foreign-born:
13.8% (127)
Asian - Speak another language Native:
49.2% (337)Foreign-born:
86.3% (792)
Other race - Speak only English Native:
22.1% (745)Foreign-born:
0.5% (9)
Other race - Speak another language Native:
79.5% (2,675)Foreign-born:
86.7% (1,534)
Two or more races - Speak only English Native:
61.0% (2,897)Foreign-born:
11.2% (40)
Two or more races - Speak another language Native:
25.4% (1,207)Foreign-born:
89.0% (320)
White alone - Speak only English Native:
95.8% (11,164)Foreign-born:
19.3% (76)
White alone - Speak another language Native:
4.3% (498)Foreign-born:
70.4% (277)
Hispanic or Latino - Speak only English Native:
33.2% (3,080)Foreign-born:
2.6% (63)
Hispanic or Latino - Speak another language Native:
70.8% (6,568)Foreign-born:
97.2% (2,327)
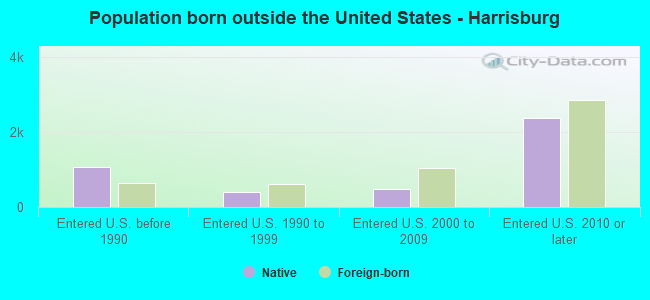
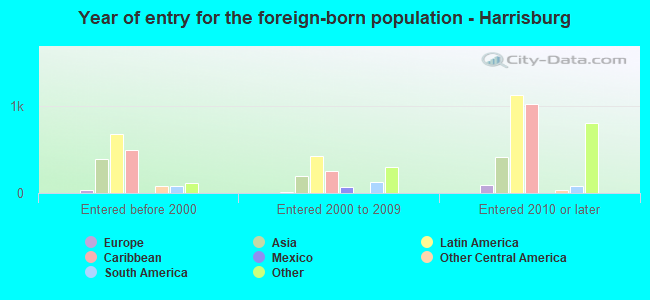
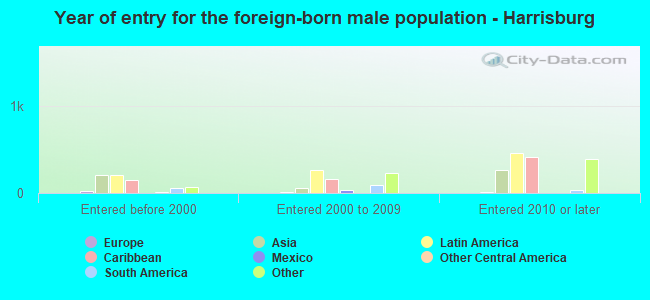
Foreign-born residents in Harrisburg 4,365 residents are foreign born (3.9% Latin America , 2.2% Africa , 2.0% Asia ).
This city:
8.6%Pennsylvania:
7.3%
Marital status for residents in Harrisburg Marital status - White (Caucasian) population 15 years and over
Males 51.3% Never married34.9% Now married1.3% Separated1.6% Widowed10.9% DivorcedFemales 35.8% Never married39.4% Now married3.2% Separated7.2% Widowed14.4% DivorcedWomen who gave birth in the past 12 months Now married:
86.6% (80)Unmarried:
13.4% (12)
Women who did not give birth in the past 12 months Now married:
41.8% (1,766)Unmarried:
58.2% (2,456)
Marital status - Black or African American population 15 years and over
Males 50.1% Never married24.5% Now married1.8% Separated6.2% Widowed17.4% DivorcedFemales 52.6% Never married19.2% Now married6.0% Separated8.3% Widowed13.8% DivorcedWomen who gave birth in the past 12 months Now married:
14.2% (34)Unmarried:
85.8% (204)
Women who did not give birth in the past 12 months Now married:
20.2% (1,020)Unmarried:
79.8% (4,031)
Marital status - American Indian / Alaska Native population 15 years and over
Males 57.1% Never married42.9% Now married0.0% Separated0.0% Widowed0.0% DivorcedFemales 7.3% Never married70.0% Now married0.0% Separated22.7% Widowed0.0% DivorcedWomen who did not give birth in the past 12 months Now married:
77.8% (38)Unmarried:
22.2% (11)
Marital status - Asian population 15 years and over
Males 46.7% Never married41.1% Now married2.0% Separated0.0% Widowed10.2% DivorcedFemales 38.0% Never married43.4% Now married3.1% Separated8.0% Widowed7.6% DivorcedWomen who gave birth in the past 12 months Now married:
100.0% (18)Unmarried:
0.0% (0)
Women who did not give birth in the past 12 months Now married:
38.6% (137)Unmarried:
61.4% (218)
Marital status - Native Hawaiian / Pacific Islander population 15 years and over
Males 0.0% Never married100.0% Now married0.0% Separated0.0% Widowed0.0% DivorcedFemales 0.0% Never married100.0% Now married0.0% Separated0.0% Widowed0.0% DivorcedMarital status - Other race population 15 years and over
Males 62.0% Never married28.5% Now married6.3% Separated0.0% Widowed3.3% DivorcedFemales 41.2% Never married28.0% Now married11.5% Separated8.5% Widowed10.9% DivorcedWomen who gave birth in the past 12 months Now married:
0.0% (0)Unmarried:
100.0% (74)
Women who did not give birth in the past 12 months Now married:
33.9% (437)Unmarried:
66.1% (852)
Marital status - Two or more races population 15 years and over
Males 54.8% Never married27.2% Now married11.2% Separated0.0% Widowed6.9% DivorcedFemales 42.2% Never married41.1% Now married0.0% Separated5.4% Widowed11.3% DivorcedWomen who gave birth in the past 12 months Now married:
0.0% (0)Unmarried:
100.0% (46)
Women who did not give birth in the past 12 months Now married:
46.0% (552)Unmarried:
54.0% (647)
Marital status - White alone, not Hispanic / Latino population 15 years and over
Males 50.2% Never married35.8% Now married1.6% Separated1.9% Widowed10.4% DivorcedFemales 35.1% Never married39.3% Now married3.3% Separated7.8% Widowed14.6% DivorcedWomen who gave birth in the past 12 months Now married:
86.6% (82)Unmarried:
13.4% (13)
Women who did not give birth in the past 12 months Now married:
41.2% (1,415)Unmarried:
58.8% (2,017)
Marital status - Hispanic or Latino population 15 years and over
Males 57.6% Never married28.2% Now married5.2% Separated0.0% Widowed9.0% DivorcedFemales 40.1% Never married34.1% Now married6.8% Separated6.7% Widowed12.4% DivorcedWomen who gave birth in the past 12 months Now married:
31.5% (35)Unmarried:
68.5% (77)
Women who did not give birth in the past 12 months Now married:
38.8% (1,073)Unmarried:
61.2% (1,694)
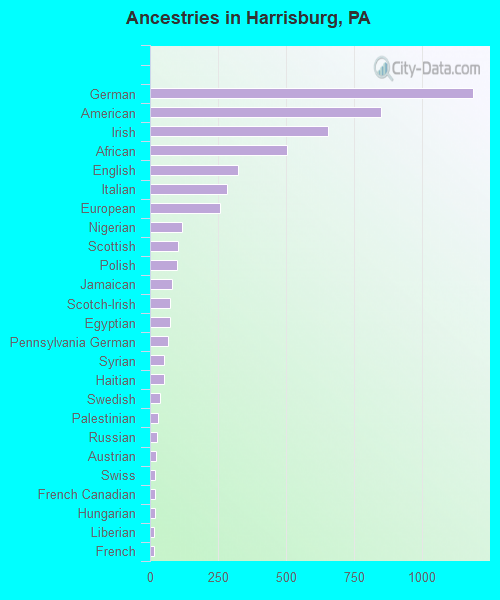
Ancestries in Harrisburg
1,189 4.6% German851 3.3% American657 2.5% Irish504 1.9% African323 1.2% English283 1.1% Italian256 1.0% European118 0.5% Nigerian104 0.4% Scottish100 0.4% Polish80 0.3% Jamaican75 0.3% Scotch-Irish74 0.3% Egyptian66 0.3% Pennsylvania German50 0.2% Syrian50 0.2% Haitian38 0.1% Swedish30 0.1% Palestinian27 0.1% Russian22 0.09% Austrian20 0.08% Swiss19 0.07% French Canadian18 0.07% Hungarian16 0.06% Liberian15 0.06% French15 0.06% Greek14 0.05% Slavic13 0.05% Carpatho Rusyn12 0.05% Ukrainian12 0.05% British West Indian11 0.04% Eastern European11 0.04% West Indian10 0.04% Serbian10 0.04% Iranian8 0.03% German Russian5 0.02% Northern European4 0.02% British4 0.02% Israeli3 0.01% Scandinavian
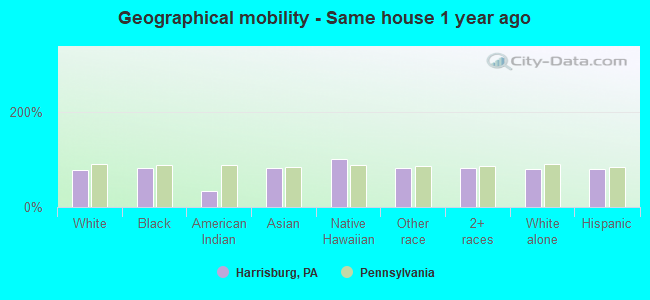
Geographical mobility in Harrisburg Same house 1 year ago 12,783 77.2% White (Caucasian)17,052 81.3% Black or African American98 32.6% American Indian / Alaska Native1,154 81.7% Asian96 100.0% Native Hawaiian / Pacific Islander4,045 81.1% Other race4,328 81.9% Two or more races9,894 80.2% White alone, not Hispanic / Latino10,369 80.1% Hispanic or LatinoMoved within same county 1,639 9.9% White / Caucasian2,648 12.6% Black or African American212 70.6% American Indian / Alaska Native61 4.3% Asian193 3.9% Other race570 10.8% Two or more races943 7.6% White alone, not Hispanic / Latino1,218 9.4% Hispanic or LatinoMoved within same state 1,091 6.6% White / Caucasian417 2.0% Black or African American73 5.1% Asian353 7.1% Other race261 4.9% Two or more races784 6.4% White alone, not Hispanic / Latino1,062 8.2% Hispanic or LatinoMoved from different state 510 3.1% White / Caucasian482 2.3% Black or African American62 4.4% Asian94 1.9% Other race22 0.4% Two or more races487 3.9% White alone, not Hispanic / Latino168 1.3% Hispanic or LatinoMoved from abroad 37 0.2% White149 0.7% Black or African American59 4.2% Asian257 5.1% Other race70 1.3% Two or more races7 0.1% White alone, not Hispanic / Latino184 1.4% Hispanic or Latino
Children Nativity (place of birth) in Harrisburg
Children under 6 years - Living with two parents Both parents native 1,443 100.0% Native0 0.0% Foreign-bornBoth parents foreign-born 143 95.3% Native7 4.7% Foreign-bornOne native, one foreign-born parent 436 100.0% NativeChildren under 6 years - Living with one parent Native parent 2,423 100.0% NativeForeign-born parent 136 90.1% Native15 9.9% Foreign-bornChildren 6 to 17 years - Living with two parents Both parents native 1,843 100.0% NativeBoth parents foreign-born 351 73.4% Native128 26.6% Foreign-bornOne native, one foreign-born parent 315 100.0% NativeChildren 6 to 17 years - Living with one parent Native parent 5,487 100.0% NativeForeign-born parent 559 58.3% Native400 41.7% Foreign-born
Grandparents responsible for own grandchildren in Harrisburg
Grandparents (30 to 59 years) White / Caucasian 14 20.3% Responsible for grandchildren56 79.7% Not responsible for grandchildrenBlack or African American 281 62.8% Responsible for grandchildren166 37.2% Not responsible for grandchildrenOther race 79 100.0% Not responsible for grandchildrenTwo or more races 170 85.2% Responsible for grandchildren30 14.8% Not responsible for grandchildrenWhite alone, not Hispanic / Latino 15 20.5% Responsible for grandchildren59 79.5% Not responsible for grandchildrenHispanic or Latino 95 100.0% Not responsible for grandchildrenGrandparents (60 years and over) White / Caucasian 41 52.8% Responsible for grandchildren37 47.2% Not responsible for grandchildrenBlack or African American 84 36.3% Responsible for grandchildren147 63.7% Not responsible for grandchildrenOther race 58 100.0% Not responsible for grandchildrenTwo or more races 28 100.0% Not responsible for grandchildrenWhite alone, not Hispanic / Latino 7 15.0% Responsible for grandchildren38 85.0% Not responsible for grandchildrenHispanic or Latino 39 33.0% Responsible for grandchildren78 67.0% Not responsible for grandchildren