Races in Helmville, Montana (MT) Detailed Stats
Ancestries, Foreign-born residents, place of birth
Race distribution in Helmville

- 49596.1%White alone
- 61.2%American Indian alone
- 61.2%Two or more races
- 61.2%Hispanic
- 10.2%Asian alone
- 10.2%Black alone
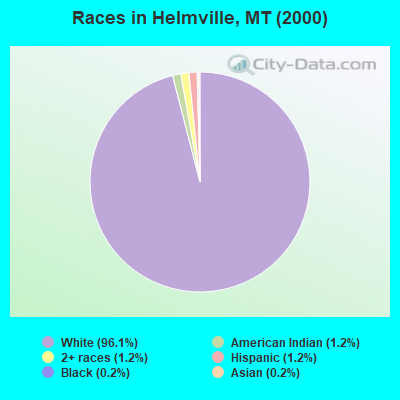
2000
2022
-
- 807,82389.5%White alone
- 54,4266.0%American Indian alone
- 18,0812.0%Hispanic
- 13,7681.5%Two or more races
- 4,5690.5%Asian alone
- 2,5340.3%Black alone
- 5690.06%Other race alone
- 4250.05%Native Hawaiian and Other
Pacific Islander alone

-
- 937,36583.5%White alone
- 58,7485.2%American Indian alone
- 55,1724.9%Two or more races
- 49,8304.4%Hispanic
- 9,0120.8%Other race alone
- 7,7000.7%Asian alone
- 3,4280.3%Black alone
- 1,6120.1%Native Hawaiian and Other
Pacific Islander alone

Income and house value in Helmville
- Median household income in 2022
- $56,398White non-Hispanic householders
- $15,794Asian householders
- $64,546Two or more races householders
- Median 2022 house value
- $385,234White Non-Hispanic householders
- $160,812Asian householders
- $268,020Two or more races householders
Household income for White non-Hispanic householders

Household income for Asian householders

Household income for Two or more races householders

Zip code: 59854