Races in Hermiston, Oregon (OR) Detailed Stats
Data:
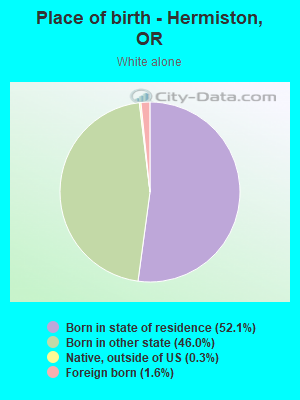
Races - White alone (%)
Races - White alone (% change since 2000)
Races - Black alone (%)
Races - Black alone (% change since 2000)
Races - American Indian alone (%)
Races - American Indian alone (% change since 2000)
Races - Asian alone (%)
Races - Asian alone (% change since 2000)
Races - Hispanic (%)
Races - Hispanic (% change since 2000)
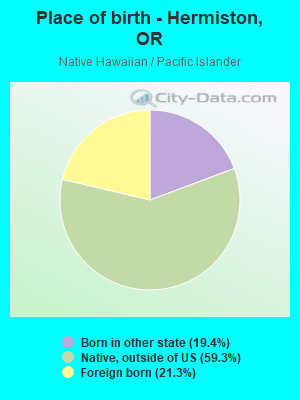
Races - Native Hawaiian and Other Pacific Islander alone (%)
Races - Native Hawaiian and Other Pacific Islander alone (% change since 2000)
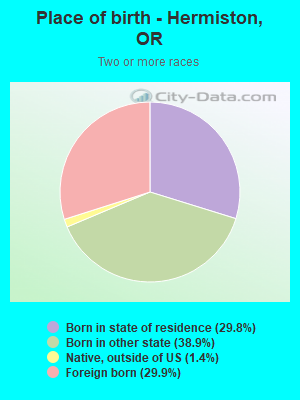
Races - Two or more races(%)
Races - Two or more races(% change since 2000)
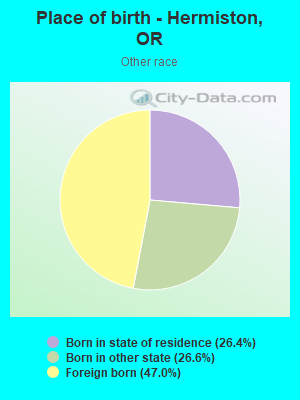
Races - Other race alone (%)
Races - Other race alone (% change since 2000)
Racial diversity
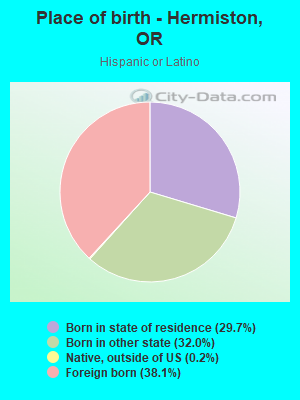
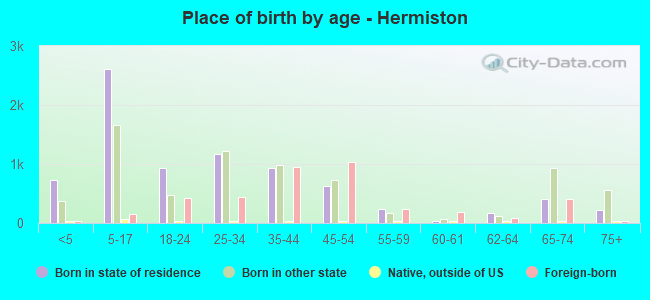
Place of birth - Born in state of residence (%)
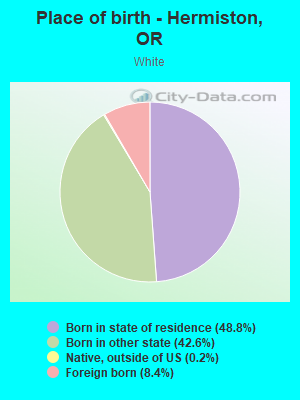
Place of birth - Born in state of residence (%) - White
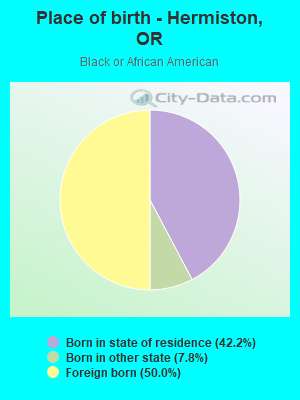
Place of birth - Born in state of residence (%) - Black or African American
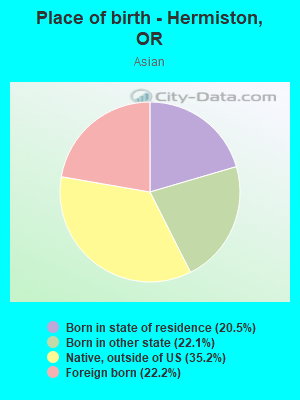
Place of birth - Born in state of residence (%) - Asian
Place of birth - Born in state of residence (%) - Hispanic or Latino
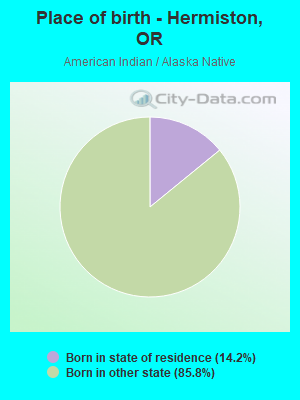
Place of birth - Born in state of residence (%) - American Indian and Alaska Native
Place of birth - Born in state of residence (%) - Multirace
Place of birth - Born in state of residence (%) - Other Race
Place of birth - Born in other state (%)
Place of birth - Born in other state (%) - White
Place of birth - Born in other state (%) - Black or African American
Place of birth - Born in other state (%) - Asian
Place of birth - Born in other state (%) - Hispanic or Latino
Place of birth - Born in other state (%) - American Indian and Alaska Native
Place of birth - Born in other state (%) - Multirace
Place of birth - Born in other state (%) - Other Race
Place of birth - Native, outside of US (%)
Place of birth - Native, outside of US (%) - White
Place of birth - Native, outside of US (%) - Black or African American
Place of birth - Native, outside of US (%) - Asian
Place of birth - Native, outside of US (%) - Hispanic or Latino
Place of birth - Native, outside of US (%) - American Indian and Alaska Native
Place of birth - Native, outside of US (%) - Multirace
Place of birth - Native, outside of US (%) - Other Race
Place of birth - Foreign born (%)
Place of birth - Foreign born (%) - White
Place of birth - Foreign born (%) - Black or African American
Place of birth - Foreign born (%) - Asian
Place of birth - Foreign born (%) - Hispanic or Latino
Place of birth - Foreign born (%) - American Indian and Alaska Native
Place of birth - Foreign born (%) - Multirace
Place of birth - Foreign born (%) - Other Race
Residents speaking English at home (%)
Residents speaking English at home - Born in the United States (%)
Residents speaking English at home - Native, born elsewhere (%)
Residents speaking English at home - Foreign born (%)
Residents speaking Spanish at home (%)
Residents speaking Spanish at home - Born in the United States (%)
Residents speaking Spanish at home - Native, born elsewhere (%)
Residents speaking Spanish at home - Foreign born (%)
Residents speaking other language at home (%)
Residents speaking other language at home - Born in the United States (%)
Residents speaking other language at home - Native, born elsewhere (%)
Residents speaking other language at home - Foreign born (%)
Marital status - Never married (%)
Marital status - Now married (%)
Marital status - Separated (%)
Marital status - Widowed (%)
Marital status - Divorced (%)
Ancestries Reported - Arab (%)
Ancestries Reported - Czech (%)
Ancestries Reported - Danish (%)
Ancestries Reported - Dutch (%)
Ancestries Reported - English (%)
Ancestries Reported - French (%)
Ancestries Reported - French Canadian (%)
Ancestries Reported - German (%)
Ancestries Reported - Greek (%)
Ancestries Reported - Hungarian (%)
Ancestries Reported - Irish (%)
Ancestries Reported - Italian (%)
Ancestries Reported - Lithuanian (%)
Ancestries Reported - Norwegian (%)
Ancestries Reported - Polish (%)
Ancestries Reported - Portuguese (%)
Ancestries Reported - Russian (%)
Ancestries Reported - Scotch-Irish (%)
Ancestries Reported - Scottish (%)
Ancestries Reported - Slovak (%)
Ancestries Reported - Subsaharan African (%)
Ancestries Reported - Swedish (%)
Ancestries Reported - Swiss (%)
Ancestries Reported - Ukrainian (%)
Ancestries Reported - United States (%)
Ancestries Reported - Welsh (%)
Ancestries Reported - West Indian (%)
Ancestries Reported - Other (%)
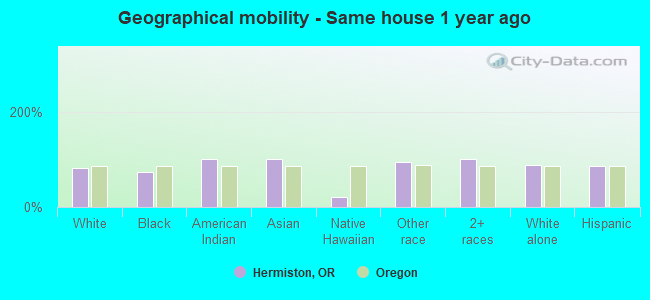
Geographical mobility - Same house 1 year ago (%)
Geographical mobility - Same house 1 year ago (%) - White
Geographical mobility - Same house 1 year ago (%) - Black or African American
Geographical mobility - Same house 1 year ago (%) - Asian
Geographical mobility - Same house 1 year ago (%) - Hispanic or Latino
Geographical mobility - Same house 1 year ago (%) - American Indian and Alaska Native
Geographical mobility - Same house 1 year ago (%) - Multirace
Geographical mobility - Same house 1 year ago (%) - Other Race
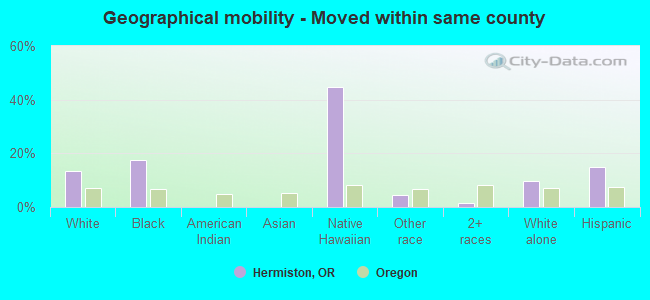
Geographical mobility - Moved within same county (%)
Geographical mobility - Moved within same county (%) - White
Geographical mobility - Moved within same county (%) - Black or African American
Geographical mobility - Moved within same county (%) - Asian
Geographical mobility - Moved within same county (%) - Hispanic or Latino
Geographical mobility - Moved within same county (%) - American Indian and Alaska Native
Geographical mobility - Moved within same county (%) - Multirace
Geographical mobility - Moved within same county (%) - Other Race
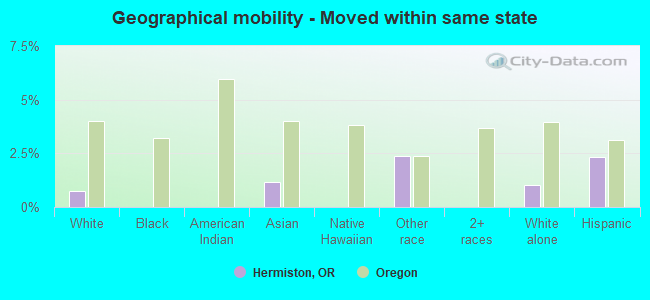
Geographical mobility - Moved from different county within same state (%)
Geographical mobility - Moved from different county within same state (%) - White
Geographical mobility - Moved from different county within same state (%) - Black or African American
Geographical mobility - Moved from different county within same state (%) - Asian
Geographical mobility - Moved from different county within same state (%) - Hispanic or Latino
Geographical mobility - Moved from different county within same state (%) - American Indian and Alaska Native
Geographical mobility - Moved from different county within same state (%) - Multirace
Geographical mobility - Moved from different county within same state (%) - Other Race
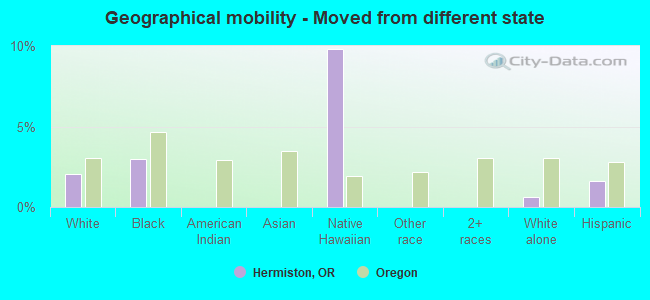
Geographical mobility - Moved from different state (%)
Geographical mobility - Moved from different state (%) - White
Geographical mobility - Moved from different state (%) - Black or African American
Geographical mobility - Moved from different state (%) - Asian
Geographical mobility - Moved from different state (%) - Hispanic or Latino
Geographical mobility - Moved from different state (%) - American Indian and Alaska Native
Geographical mobility - Moved from different state (%) - Multirace
Geographical mobility - Moved from different state (%) - Other Race
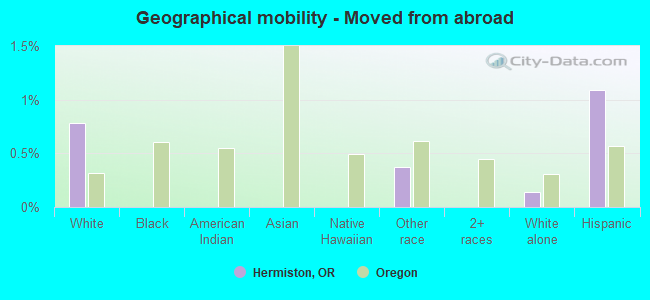
Geographical mobility - Moved from abroad (%)
Geographical mobility - Moved from abroad (%) - White
Geographical mobility - Moved from abroad (%) - Black or African American
Geographical mobility - Moved from abroad (%) - Asian
Geographical mobility - Moved from abroad (%) - Hispanic or Latino
Geographical mobility - Moved from abroad (%) - American Indian and Alaska Native
Geographical mobility - Moved from abroad (%) - Multirace
Geographical mobility - Moved from abroad (%) - Other Race
Place of birth for the foreign-born population - Ireland (%)
Place of birth for the foreign-born population - Denmark (%)
Place of birth for the foreign-born population - Norway (%)
Place of birth for the foreign-born population - Sweden (%)
Place of birth for the foreign-born population - United Kingdom (%)
Place of birth for the foreign-born population - England (%)
Place of birth for the foreign-born population - Scotland (%)
Place of birth for the foreign-born population - Other Northern Europe (%)
Place of birth for the foreign-born population - Austria (%)
Place of birth for the foreign-born population - Belgium (%)
Place of birth for the foreign-born population - France (%)
Place of birth for the foreign-born population - Germany (%)
Place of birth for the foreign-born population - Netherlands (%)
Place of birth for the foreign-born population - Switzerland (%)
Place of birth for the foreign-born population - Other Western Europe (%)
Place of birth for the foreign-born population - Greece (%)
Place of birth for the foreign-born population - Italy (%)
Place of birth for the foreign-born population - Portugal (%)
Place of birth for the foreign-born population - Spain (%)
Place of birth for the foreign-born population - Other Southern Europe (%)
Place of birth for the foreign-born population - Albania (%)
Place of birth for the foreign-born population - Belarus (%)
Place of birth for the foreign-born population - Bosnia and Herzegovina (%)
Place of birth for the foreign-born population - Bulgaria (%)
Place of birth for the foreign-born population - Croatia (%)
Place of birth for the foreign-born population - Czechoslovakia (%)
Place of birth for the foreign-born population - Hungary (%)
Place of birth for the foreign-born population - Latvia (%)
Place of birth for the foreign-born population - Lithuania (%)
Place of birth for the foreign-born population - North Macedonia (Macedonia) (%)
Place of birth for the foreign-born population - Moldova (%)
Place of birth for the foreign-born population - Poland (%)
Place of birth for the foreign-born population - Romania (%)
Place of birth for the foreign-born population - Russia (%)
Place of birth for the foreign-born population - Serbia (%)
Place of birth for the foreign-born population - Ukraine (%)
Place of birth for the foreign-born population - Other Eastern Europe (%)
Place of birth for the foreign-born population - China (%)
Place of birth for the foreign-born population - Hong Kong (%)
Place of birth for the foreign-born population - Taiwan (%)
Place of birth for the foreign-born population - Japan (%)
Place of birth for the foreign-born population - Korea (%)
Place of birth for the foreign-born population - Other Eastern Asia (%)
Place of birth for the foreign-born population - Afghanistan (%)
Place of birth for the foreign-born population - Bangladesh (%)
Place of birth for the foreign-born population - India (%)
Place of birth for the foreign-born population - Iran (%)
Place of birth for the foreign-born population - Kazakhstan (%)
Place of birth for the foreign-born population - Nepal (%)
Place of birth for the foreign-born population - Pakistan (%)
Place of birth for the foreign-born population - Sri Lanka (%)
Place of birth for the foreign-born population - Uzbekistan (%)
Place of birth for the foreign-born population - Other South Central Asia (%)
Place of birth for the foreign-born population - Burma (%)
Place of birth for the foreign-born population - Cambodia (%)
Place of birth for the foreign-born population - Indonesia (%)
Place of birth for the foreign-born population - Laos (%)
Place of birth for the foreign-born population - Malaysia (%)
Place of birth for the foreign-born population - Philippines (%)
Place of birth for the foreign-born population - Singapore (%)
Place of birth for the foreign-born population - Thailand (%)
Place of birth for the foreign-born population - Vietnam (%)
Place of birth for the foreign-born population - Other South Eastern Asia (%)
Place of birth for the foreign-born population - Armenia (%)
Place of birth for the foreign-born population - Iraq (%)
Place of birth for the foreign-born population - Israel (%)
Place of birth for the foreign-born population - Jordan (%)
Place of birth for the foreign-born population - Kuwait (%)
Place of birth for the foreign-born population - Lebanon (%)
Place of birth for the foreign-born population - Saudi Arabia (%)
Place of birth for the foreign-born population - Syria (%)
Place of birth for the foreign-born population - Turkey (%)
Place of birth for the foreign-born population - Yemen (%)
Place of birth for the foreign-born population - Other Western Asia (%)
Place of birth for the foreign-born population - Eritrea (%)
Place of birth for the foreign-born population - Ethiopia (%)
Place of birth for the foreign-born population - Kenya (%)
Place of birth for the foreign-born population - Somalia (%)
Place of birth for the foreign-born population - Uganda (%)
Place of birth for the foreign-born population - Zimbabwe (%)
Place of birth for the foreign-born population - Other Eastern Africa (%)
Place of birth for the foreign-born population - Cameroon (%)
Place of birth for the foreign-born population - Congo (%)
Place of birth for the foreign-born population - Democratic Republic of Congo (Zaire) (%)
Place of birth for the foreign-born population - Other Middle Africa (%)
Place of birth for the foreign-born population - Egypt (%)
Place of birth for the foreign-born population - Morocco (%)
Place of birth for the foreign-born population - Sudan (%)
Place of birth for the foreign-born population - Other Northern Africa (%)
Place of birth for the foreign-born population - South Africa (%)
Place of birth for the foreign-born population - Other Southern Africa (%)
Place of birth for the foreign-born population - Cabo Verde (%)
Place of birth for the foreign-born population - Ghana (%)
Place of birth for the foreign-born population - Liberia (%)
Place of birth for the foreign-born population - Nigeria (%)
Place of birth for the foreign-born population - Senegal (%)
Place of birth for the foreign-born population - Sierra Leone (%)
Place of birth for the foreign-born population - Other Western Africa (%)
Place of birth for the foreign-born population - Australia (%)
Place of birth for the foreign-born population - New Zealand (%)
Place of birth for the foreign-born population - Fiji (%)
Place of birth for the foreign-born population - Micronesia (%)
Place of birth for the foreign-born population - Bahamas (%)
Place of birth for the foreign-born population - Barbados (%)
Place of birth for the foreign-born population - Cuba (%)
Place of birth for the foreign-born population - Dominica (%)
Place of birth for the foreign-born population - Dominican Republic (%)
Place of birth for the foreign-born population - Grenada (%)
Place of birth for the foreign-born population - Haiti (%)
Place of birth for the foreign-born population - Jamaica (%)
Place of birth for the foreign-born population - St. Vincent and the Grenadines (%)
Place of birth for the foreign-born population - Trinidad and Tobago (%)
Place of birth for the foreign-born population - West Indies (%)
Place of birth for the foreign-born population - Other Caribbean (%)
Place of birth for the foreign-born population - Belize (%)
Place of birth for the foreign-born population - Costa Rica (%)
Place of birth for the foreign-born population - El Salvador (%)
Place of birth for the foreign-born population - Guatemala (%)
Place of birth for the foreign-born population - Honduras (%)
Place of birth for the foreign-born population - Mexico (%)
Place of birth for the foreign-born population - Nicaragua (%)
Place of birth for the foreign-born population - Panama (%)
Place of birth for the foreign-born population - Other Central America (%)
Place of birth for the foreign-born population - Argentina (%)
Place of birth for the foreign-born population - Bolivia (%)
Place of birth for the foreign-born population - Brazil (%)
Place of birth for the foreign-born population - Chile (%)
Place of birth for the foreign-born population - Colombia (%)
Place of birth for the foreign-born population - Ecuador (%)
Place of birth for the foreign-born population - Guyana (%)
Place of birth for the foreign-born population - Peru (%)
Place of birth for the foreign-born population - Uruguay (%)
Place of birth for the foreign-born population - Venezuela (%)
Place of birth for the foreign-born population - Other South America (%)
Place of birth for the foreign-born population - Canada (%)
Place of birth for the foreign-born population - Other Northern America (%)
Place of birth for the foreign-born population - Other (%)
Latest news about races in Hermiston, OR collected exclusively by city-data.com from local newspapers, TV, and radio stations
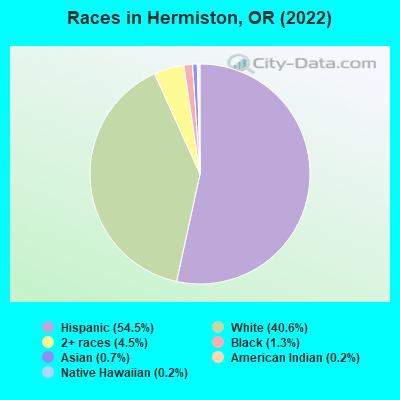
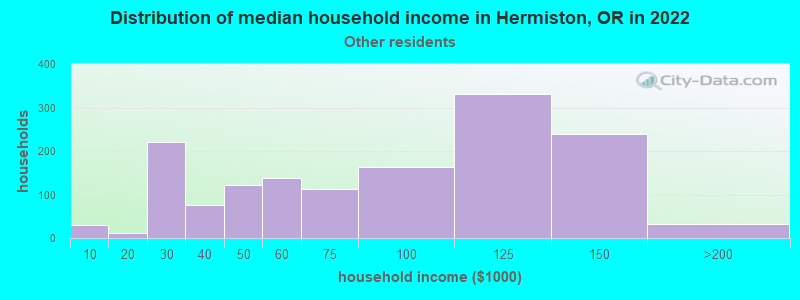
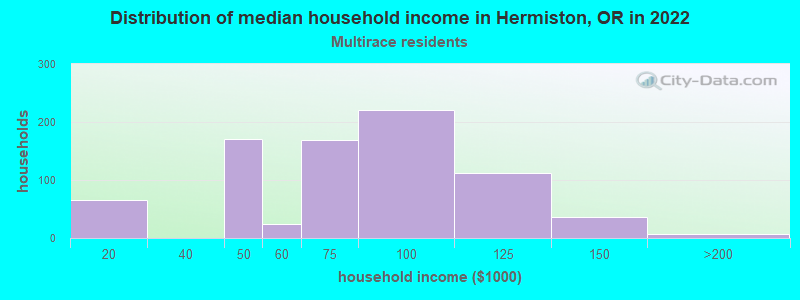
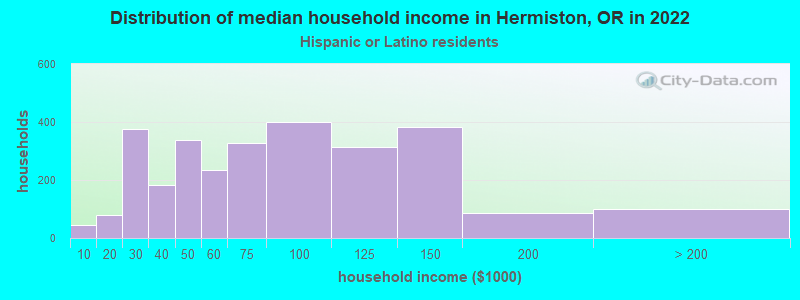
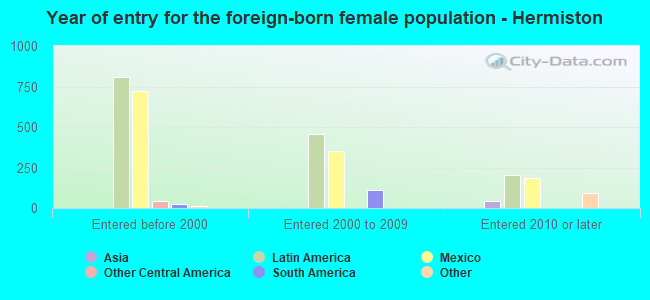
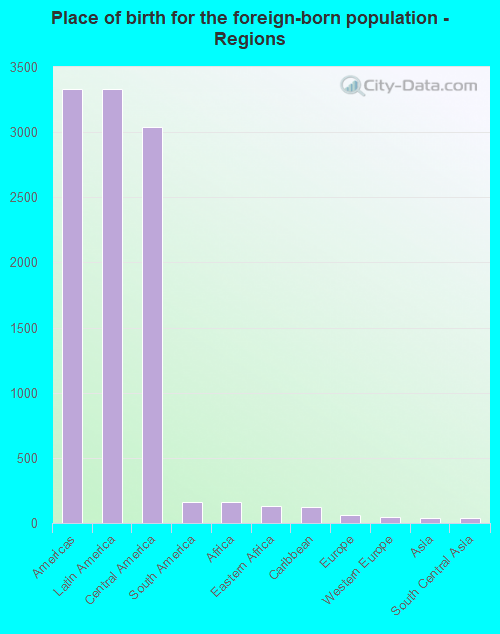
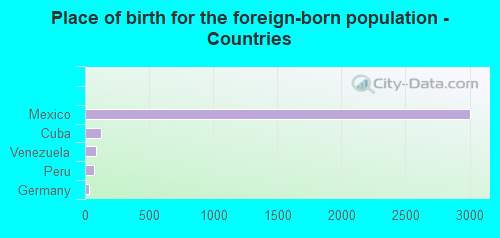
According to 2022 data, the most numerous races in Hermiston, OR are White alone (7,834 residents), Hispanic (10,518 residents), and Two or more races (867 residents). 53.2% of Hermiston residents speak English at home. 18.6% of Hermiston, OR residents are foreign-born (16.9% born in Latin America), which is 51.7% greater than the foreign-born rate of 9.0% across the entire state of Oregon.
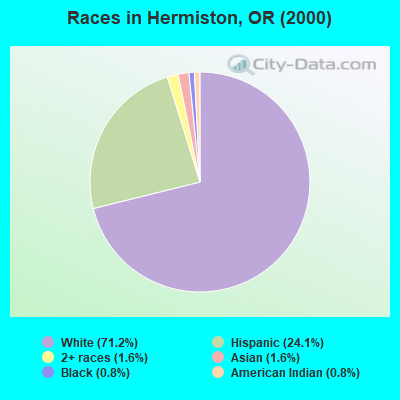
Race distribution in Hermiston
2000 2022
2,857,616 83.5% White alone 275,314 8.0% Hispanic 100,333 2.9% Asian alone 82,733 2.4% Two or more races 53,325 1.6% Black alone 40,130 1.2% American Indian alone 7,398 0.2% Native Hawaiian and Other 4,550 0.1% Other race alone
3,037,571 71.6% White alone 609,538 14.4% Hispanic 252,744 6.0% Two or more races 191,283 4.5% Asian alone 78,228 1.8% Black alone 29,399 0.7% American Indian alone 25,731 0.6% Other race alone 15,643 0.4% Native Hawaiian and Other
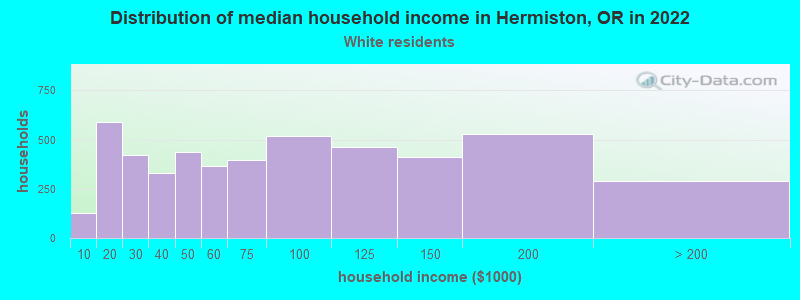
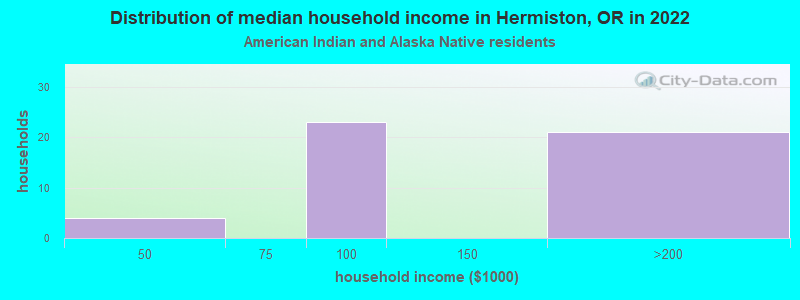
Income and house value in Hermiston Median household income in 2022 $67,882 White non-Hispanic householders$108,293 Some other race householders$69,472 Two or more races householders$90,617 Hispanic or Latino race householdersMedian 2022 house value $330,724 White Non-Hispanic householders$362,636 American Indian or Alaska Native householders $317,831 Asian householders$265,289 Some other race householders$362,636 Two or more races householders$267,545 Hispanic or Latino householders
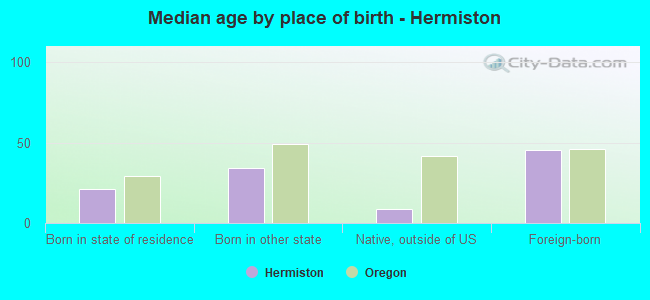
Median age by race in Hermiston
35.3 Median age for White residents35.3 35.5 32.1 Median age for Black or African American residents32.4 33.0 41.7 Median age for American Indian / Alaska Native residents36.0 99.0 69.9 Median age for Asian residents58.1 37.3 40.7 Median age for Native Hawaiian / Pacific Islander residents-764,119,600.6 -774,891,774.1 27.4 Median age for Other race residents29.0 31.2 31.3 Median age for Two or more races residents42.4 27.3 44.6 Median age for White alone residents41.2 46.4 26.8 Median age for Hispanic or Latino residents28.1 25.1
Owner/renter occupied households by race in Hermiston
House owners and renters - White residents 2,797 59.8% Owner occupied1,880 40.2% Renter occupiedHouse owners and renters - Black or African American residents 57 100.0% Owner occupiedHouse owners and renters - American Indian / Alaska Native residents 31 95.1% Owner occupied2 4.9% Renter occupiedHouse owners and renters - Asian residents 27 100.0% Renter occupiedHouse owners and renters - Other race residents 893 48.8% Owner occupied936 51.2% Renter occupiedHouse owners and renters - Two or more races residents 967 82.3% Owner occupied208 17.7% Renter occupiedHouse owners and renters - White alone residents 2,375 62.8% Owner occupied1,405 37.2% Renter occupiedHouse owners and renters - Hispanic or Latino residents 1,518 51.3% Owner occupied1,442 48.7% Renter occupied
Language usage in Hermiston
English speakers - Total 53.2% of residents of Hermiston speak English at home.
46.8% of residents speak Spanish at home 5,516 64.8% Speak English very well2,992 35.2% Speak English less than very well1.6% of residents speak other language at home 161 54.6% Speak English very well134 45.4% Speak English less than very well
English speakers - Born in the United States 62.8% of residents of Hermiston speak English at home.
39.9% of residents speak Spanish at home 1,729 62.7% Speak English very well1,030 37.3% Speak English less than very well0.8% of residents speak other language at home 37 63.8% Speak English very well21 36.2% Speak English less than very well
English speakers - Native, born elsewhere 30.2% of residents of Hermiston speak English at home.
32.6% of residents speak Spanish at home 15 53.6% Speak English very well13 46.4% Speak English less than very well41.9% of residents speak other language at home 36 100.0% Speak English very well
English speakers - Foreign-born 3.2% of residents of Hermiston speak English at home.
96.2% of residents speak Spanish at home 1,886 47.6% Speak English very well2,080 52.4% Speak English less than very well3.2% of residents speak other language at home 93 70.5% Speak English very well39 29.5% Speak English less than very well
White (Caucasian) - Speak only English Native:
79.6% (8,132)Foreign-born:
9.6% (94)
White (Caucasian) - Speak another language Native:
21.5% (2,195)Foreign-born:
82.5% (808)
Asian - Speak another language Native:
32.1% (25)Foreign-born:
98.8% (28)
Native Hawaiian / Pacific Islander - Speak only English Native:
26.8% (7)Foreign-born:
100.0% (8)
Other race - Speak only English Native:
19.2% (552)Foreign-born:
2.3% (66)
Other race - Speak another language Native:
81.7% (2,349)Foreign-born:
100.0% (2,816)
Two or more races - Speak only English Native:
42.0% (764)Foreign-born:
1.3% (13)
Two or more races - Speak another language Native:
72.1% (1,311)Foreign-born:
62.7% (601)
White alone - Speak only English Native:
96.7% (7,249)Foreign-born:
23.7% (27)
White alone - Speak another language Native:
3.3% (244)Foreign-born:
78.8% (88)
Hispanic or Latino - Speak only English Native:
25.6% (1,493)Foreign-born:
2.1% (85)
Hispanic or Latino - Speak another language Native:
75.2% (4,379)Foreign-born:
98.7% (3,988)
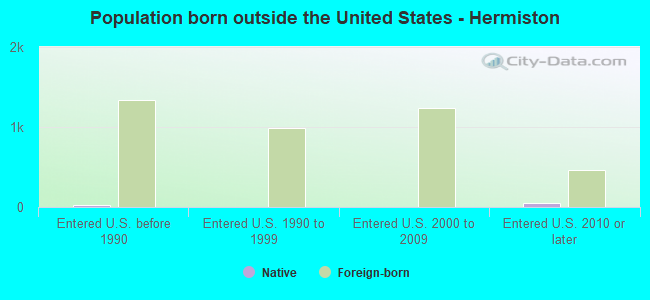
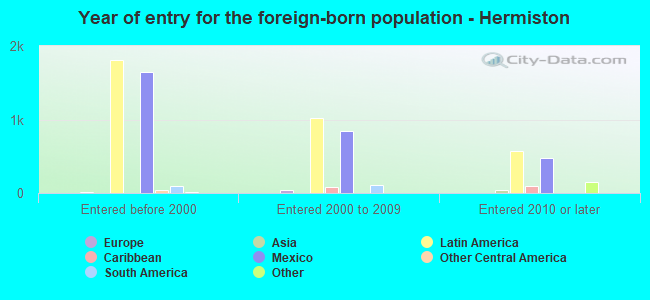
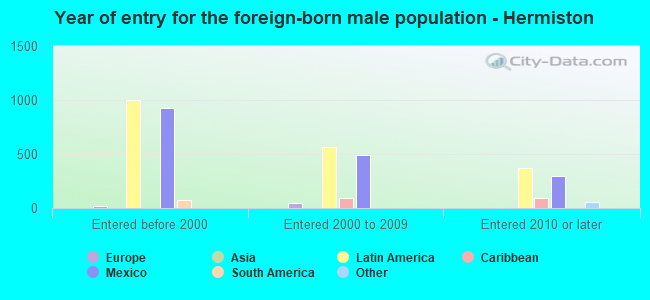
Foreign-born residents in Hermiston 3,604 residents are foreign born (16.9% Latin America ).
This city:
18.6%Oregon:
9.8%
Marital status for residents in Hermiston Marital status - White (Caucasian) population 15 years and over
Males 38.3% Never married46.0% Now married0.3% Separated1.7% Widowed13.7% DivorcedFemales 29.8% Never married43.0% Now married2.7% Separated7.7% Widowed16.9% DivorcedWomen who gave birth in the past 12 months Now married:
93.8% (75)Unmarried:
6.2% (5)
Women who did not give birth in the past 12 months Now married:
36.6% (895)Unmarried:
63.4% (1,549)
Marital status - Black or African American population 15 years and over
Males 10.5% Never married89.5% Now married0.0% Separated0.0% Widowed0.0% DivorcedFemales 47.5% Never married49.2% Now married0.0% Separated0.0% Widowed3.4% DivorcedWomen who did not give birth in the past 12 months Now married:
54.2% (62)Unmarried:
45.8% (52)
Marital status - American Indian / Alaska Native population 15 years and over
Males 43.3% Never married56.7% Now married0.0% Separated0.0% Widowed0.0% DivorcedFemales 41.9% Never married41.9% Now married0.0% Separated0.0% Widowed16.3% DivorcedWomen who did not give birth in the past 12 months Now married:
0.0% (0)Unmarried:
100.0% (22)
Marital status - Asian population 15 years and over
Males 3.8% Never married96.2% Now married0.0% Separated0.0% Widowed0.0% DivorcedFemales 0.0% Never married100.0% Now married0.0% Separated0.0% Widowed0.0% DivorcedWomen who gave birth in the past 12 months Now married:
100.0% (28)Unmarried:
0.0% (0)
Women who did not give birth in the past 12 months Now married:
100.0% (25)Unmarried:
0.0% (0)
Marital status - Native Hawaiian / Pacific Islander population 15 years and over
Males 0.0% Never married100.0% Now married0.0% Separated0.0% Widowed0.0% DivorcedFemales 0.0% Never married100.0% Now married0.0% Separated0.0% Widowed0.0% DivorcedWomen who did not give birth in the past 12 months Now married:
100.0% (27)Unmarried:
0.0% (0)
Marital status - Other race population 15 years and over
Males 55.3% Never married42.6% Now married0.0% Separated0.0% Widowed2.1% DivorcedFemales 48.4% Never married37.9% Now married0.0% Separated3.3% Widowed10.4% DivorcedWomen who gave birth in the past 12 months Now married:
0.0% (0)Unmarried:
100.0% (42)
Women who did not give birth in the past 12 months Now married:
35.6% (415)Unmarried:
64.4% (751)
Marital status - Two or more races population 15 years and over
Males 30.0% Never married58.8% Now married0.0% Separated0.0% Widowed11.2% DivorcedFemales 32.3% Never married63.5% Now married0.0% Separated0.0% Widowed4.2% DivorcedWomen who gave birth in the past 12 months Now married:
100.0% (6)Unmarried:
0.0% (0)
Women who did not give birth in the past 12 months Now married:
48.4% (243)Unmarried:
51.6% (260)
Marital status - White alone, not Hispanic / Latino population 15 years and over
Males 32.3% Never married49.4% Now married0.4% Separated2.5% Widowed15.3% DivorcedFemales 19.9% Never married47.1% Now married1.1% Separated11.5% Widowed20.4% DivorcedWomen who gave birth in the past 12 months Now married:
84.6% (32)Unmarried:
15.4% (6)
Women who did not give birth in the past 12 months Now married:
42.6% (679)Unmarried:
57.4% (914)
Marital status - Hispanic or Latino population 15 years and over
Males 48.4% Never married43.7% Now married0.0% Separated0.1% Widowed7.8% DivorcedFemales 46.5% Never married40.0% Now married2.9% Separated1.2% Widowed9.4% DivorcedWomen who gave birth in the past 12 months Now married:
65.2% (61)Unmarried:
34.8% (33)
Women who did not give birth in the past 12 months Now married:
32.8% (842)Unmarried:
67.2% (1,728)
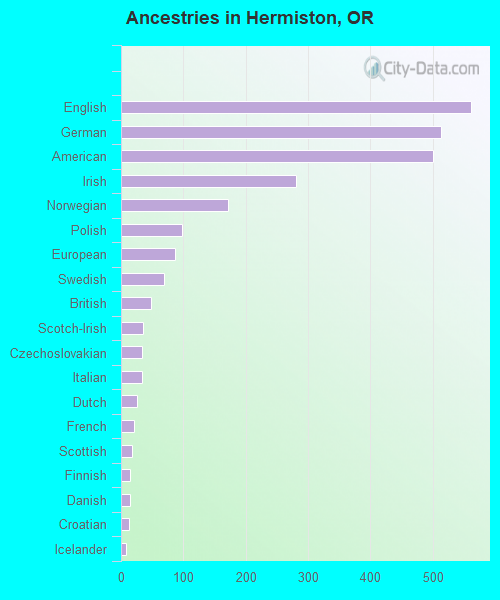
Ancestries in Hermiston
562 5.7% English513 5.2% German501 5.1% American280 2.9% Irish171 1.7% Norwegian98 1.0% Polish86 0.9% European69 0.7% Swedish48 0.5% British36 0.4% Scotch-Irish33 0.3% Czechoslovakian33 0.3% Italian26 0.3% Dutch21 0.2% French18 0.2% Scottish15 0.2% Finnish14 0.1% Danish13 0.1% Croatian8 0.08% Icelander5 0.05% French Canadian3 0.03% Swiss2 0.02% Romanian
Geographical mobility in Hermiston Same house 1 year ago 9,488 81.7% White (Caucasian)187 73.4% Black or African American83 100.0% American Indian / Alaska Native106 100.0% Asian7 22.3% Native Hawaiian / Pacific Islander4,147 93.6% Other race2,673 100.0% Two or more races7,029 89.2% White alone, not Hispanic / Latino8,942 84.7% Hispanic or LatinoMoved within same county 1,540 13.3% White / Caucasian45 17.6% Black or African American15 44.7% Native Hawaiian / Pacific Islander199 4.5% Other race44 1.6% Two or more races750 9.5% White alone, not Hispanic / Latino1,571 14.9% Hispanic or LatinoMoved within same state 88 0.8% White / Caucasian1 1.2% Asian105 2.4% Other race81 1.0% White alone, not Hispanic / Latino247 2.3% Hispanic or LatinoMoved from different state 240 2.1% White / Caucasian8 3.0% Black or African American3 9.8% Native Hawaiian / Pacific Islander48 0.6% White alone, not Hispanic / Latino169 1.6% Hispanic or LatinoMoved from abroad 90 0.8% White17 0.4% Other race11 0.1% White alone, not Hispanic / Latino115 1.1% Hispanic or Latino
Children Nativity (place of birth) in Hermiston
Children under 6 years - Living with two parents Both parents native 547 100.0% NativeBoth parents foreign-born 338 100.0% NativeOne native, one foreign-born parent 133 100.0% NativeChildren under 6 years - Living with one parent Native parent 316 100.0% NativeForeign-born parent 159 100.0% NativeChildren 6 to 17 years - Living with two parents Both parents native 1,449 100.0% NativeBoth parents foreign-born 307 95.4% Native15 4.6% Foreign-bornOne native, one foreign-born parent 323 100.0% NativeChildren 6 to 17 years - Living with one parent Native parent 1,473 100.0% NativeForeign-born parent 359 53.8% Native308 46.2% Foreign-born
Grandparents responsible for own grandchildren in Hermiston
Grandparents (30 to 59 years) White / Caucasian 71 80.3% Responsible for grandchildren18 19.7% Not responsible for grandchildrenOther race 45 58.3% Responsible for grandchildren32 41.7% Not responsible for grandchildrenWhite alone, not Hispanic / Latino 34 62.5% Responsible for grandchildren20 37.5% Not responsible for grandchildrenHispanic or Latino 73 76.1% Responsible for grandchildren23 23.9% Not responsible for grandchildrenGrandparents (60 years and over) White / Caucasian 11 15.0% Responsible for grandchildren64 85.0% Not responsible for grandchildrenOther race 7 8.9% Responsible for grandchildren70 91.1% Not responsible for grandchildrenWhite alone, not Hispanic / Latino 12 14.9% Responsible for grandchildren68 85.1% Not responsible for grandchildrenHispanic or Latino 4 5.3% Responsible for grandchildren75 94.7% Not responsible for grandchildren