Races in Houghton, Michigan (MI) Detailed Stats
Ancestries, Foreign-born residents, place of birth
Settings
X


Recent posts about races in Houghton, Michigan on our local forum with over 2,400,000 registered users:
 | Asian grocery in the upper peninsula (5 replies) |
| Looking to move to the UP soon. (37 replies) |
| Thinking of taking a vacation to the U.P. of Michigan next summer (6 replies) |
| Did the UP ever have its own congressional district? (2 replies) |
| Yoopers, Beware! (31 replies) |
| Investigating Houghton for possible move (15 replies) |
Latest news about races in Houghton, MI collected exclusively by city-data.com from local newspapers, TV, and radio stations
According to 2022 data, the most numerous races in Houghton, MI are White alone (6,360 residents), Black alone (262 residents), and Hispanic (282 residents). 81.6% of Houghton residents speak English at home. 16.2% of Houghton, MI residents are foreign-born (11.5% born in Asia, 2.3% born in Africa), which is 62.9% greater than the foreign-born rate of 6.0% across the entire state of Michigan.
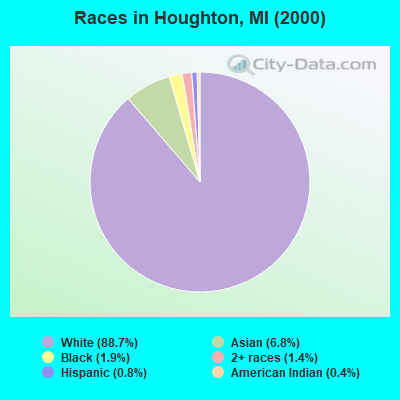
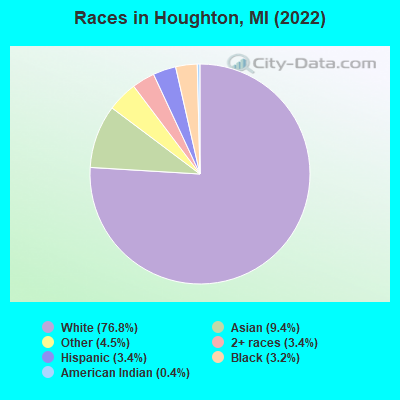
Race distribution in Houghton
2000
2022

- 6,22188.7%White alone
- 4756.8%Asian alone
- 1311.9%Black alone
- 951.4%Two or more races
- 540.8%Hispanic
- 260.4%American Indian alone
- 70.10%Other race alone
- 10.01%Native Hawaiian and Other
Pacific Islander alone
-
- 6,36076.8%White alone
- 7809.4%Asian alone
- 3704.5%Other race alone
- 2823.4%Hispanic
- 2833.4%Two or more races
- 2623.2%Black alone
- 340.4%American Indian alone
2000
2022
-
- 7,806,69178.6%White alone
- 1,402,04714.1%Black alone
- 323,8773.3%Hispanic
- 175,3111.8%Asian alone
- 163,4871.6%Two or more races
- 53,4210.5%American Indian alone
- 11,4650.1%Other race alone
- 2,1450.02%Native Hawaiian and Other
Pacific Islander alone

-
- 7,289,05172.6%White alone
- 1,310,46413.1%Black alone
- 572,4055.7%Hispanic
- 450,0314.5%Two or more races
- 335,7323.3%Asian alone
- 45,2170.5%Other race alone
- 29,0110.3%American Indian alone
- 2,2070.02%Native Hawaiian and Other
Pacific Islander alone

Income and house value in Houghton
- Median household income in 2022
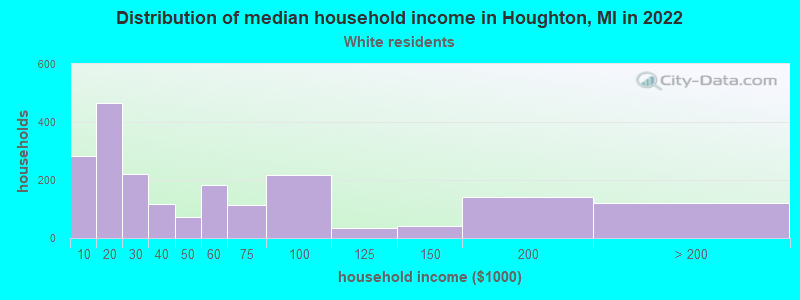
- $34,250White non-Hispanic householders
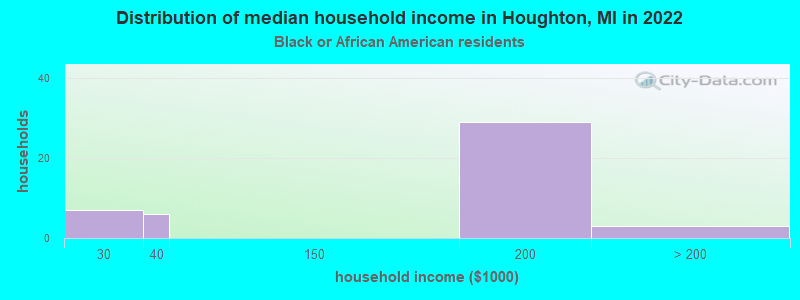
- $187,762Black householders
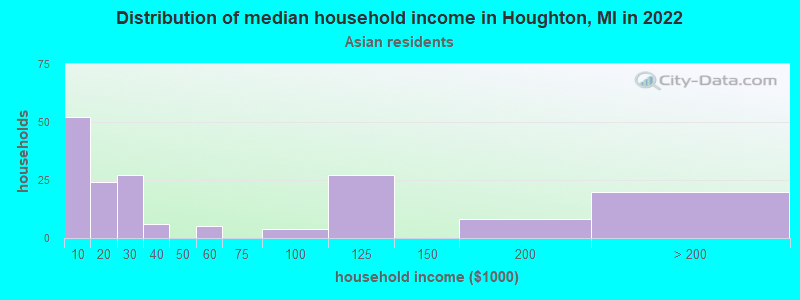
- $23,512Asian householders
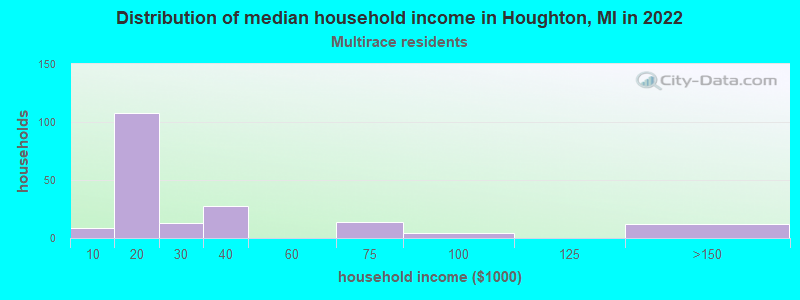
- $15,600Two or more races householders
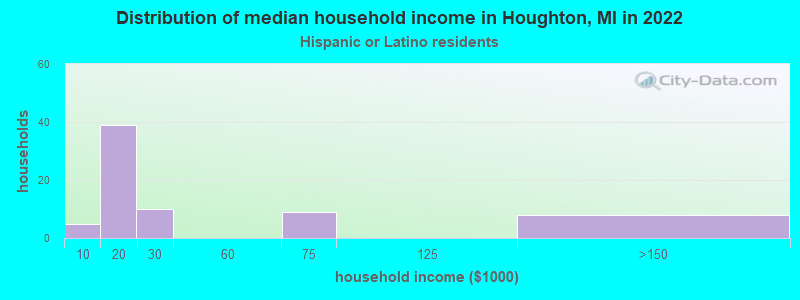
- $12,346Hispanic or Latino race householders
- Median 2022 house value
- $229,257White Non-Hispanic householders
- $266,146Asian householders
- $439,451Two or more races householders
Household income for White non-Hispanic householders
Household income for Black householders
Household income for Asian householders
Household income for Two or more races householders
Household income for Hispanic or Latino race householders
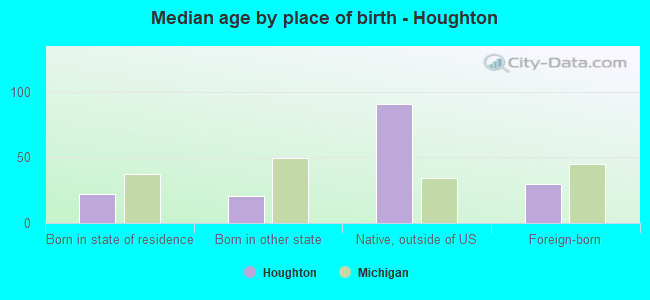
Median age by race in Houghton
- 21.8Median age for White residents
- 21.7Males
- 22.6Females
- 30.0Median age for Black or African American residents
- 34.1Males
- 27.0Females
- -675,799,086.1Median age for American Indian / Alaska Native residents
- -672,284,643.5Males
- -673,835,124.8Females
- 28.1Median age for Asian residents
- 28.6Males
- 26.9Females
- -670,531,400.3Median age for Native Hawaiian / Pacific Islander residents
- -674,772,035.8Males
- -699,588,476.7Females
- 30.9Median age for Other race residents
- 31.5Males
- 27.0Females
- 21.5Median age for Two or more races residents
- 20.8Males
- 22.8Females
- 21.8Median age for White alone residents
- 21.6Males
- 22.4Females
- 21.4Median age for Hispanic or Latino residents
- 20.8Males
- 28.3Females
Owner/renter occupied households by race in Houghton
- House owners and renters - White residents
- 77239.3%Owner occupied
- 1,19460.7%Renter occupied
- House owners and renters - Black or African American residents
- 920.5%Owner occupied
- 3679.5%Renter occupied
- House owners and renters - American Indian / Alaska Native residents
- 43100.0%Renter occupied
- House owners and renters - Asian residents
- 6134.1%Owner occupied
- 11765.9%Renter occupied
- House owners and renters - Two or more races residents
- 179.3%Owner occupied
- 16990.7%Renter occupied
- House owners and renters - White alone residents
- 77739.4%Owner occupied
- 1,19360.6%Renter occupied
- House owners and renters - Hispanic or Latino residents
- 1012.5%Owner occupied
- 6787.5%Renter occupied
Language usage in Houghton
- English speakers - Total
- 81.6% of residents of Houghton speak English at home.
- 1.4% of residents speak Spanish at home
- 114100.0%Speak English very well
- 17.1% of residents speak other language at home
- 75754.6%Speak English very well
- 62945.4%Speak English less than very well
- English speakers - Born in the United States
- 94.0% of residents of Houghton speak English at home.
- 0.6% of residents speak Spanish at home
- 13100.0%Speak English very well
- 5.1% of residents speak other language at home
- 8582.5%Speak English very well
- 1817.5%Speak English less than very well
- English speakers - Native, born elsewhere
- 11.4% of residents of Houghton speak English at home.
- 82.9% of residents speak Spanish at home
- 29100.0%Speak English very well
- English speakers - Foreign-born
- 5.9% of residents of Houghton speak English at home.
- 1.9% of residents speak Spanish at home
- 25100.0%Speak English very well
- 92.8% of residents speak other language at home
- 62050.6%Speak English very well
- 60649.4%Speak English less than very well
White (Caucasian) - Speak only English
| Native: | 98.1% (5,941) |
| Foreign-born: | 25.5% (41) |
White (Caucasian) - Speak another language
| Native: | 2.0% (123) |
| Foreign-born: | 74.5% (120) |
Asian - Speak only English
| Native: | 52.5% (59) |
| Foreign-born: | 5.6% (37) |
Asian - Speak another language
| Native: | 47.3% (53) |
| Foreign-born: | 94.9% (632) |
Two or more races - Speak another language
| Native: | 15.0% (71) |
| Foreign-born: | 100.0% (34) |
White alone - Speak only English
| Native: | 98.1% (5,889) |
| Foreign-born: | 20.6% (34) |
White alone - Speak another language
| Native: | 1.9% (115) |
| Foreign-born: | 79.9% (132) |
Hispanic or Latino - Speak only English
| Native: | 78.1% (197) |
| Foreign-born: | 24.1% (8) |
Hispanic or Latino - Speak another language
| Native: | 21.8% (55) |
| Foreign-born: | 75.3% (25) |
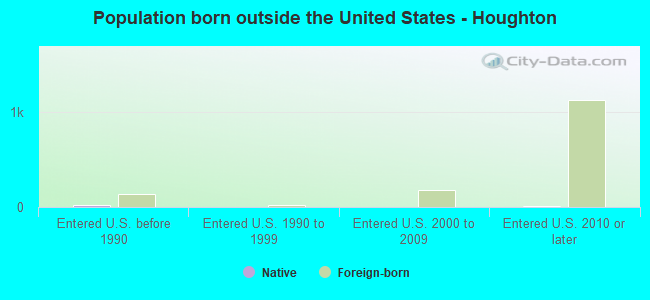
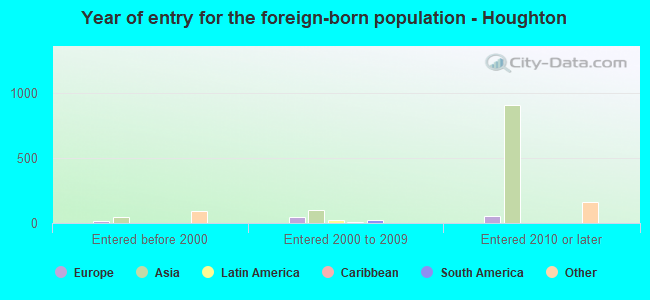
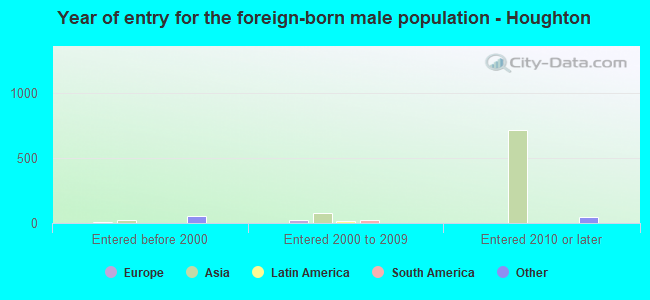
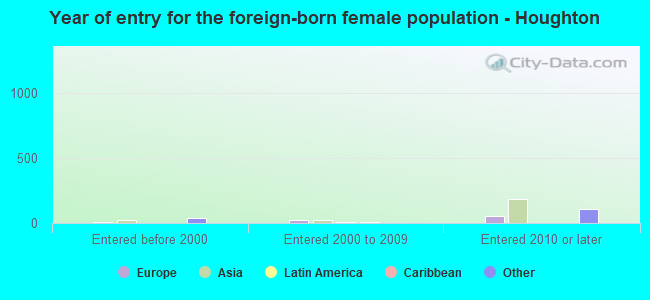
Foreign-born residents in Houghton
1,339 residents are foreign born (11.5% Asia, 2.3% Africa).
| This city: | 16.2% |
| Michigan: | 6.9% |

Marital status for residents in Houghton
Marital status - White (Caucasian) population 15 years and over
- Males
- 81.6%Never married
- 14.3%Now married
- 0.0%Separated
- 0.9%Widowed
- 3.2%Divorced
- Females
- 56.4%Never married
- 26.6%Now married
- 0.4%Separated
- 6.0%Widowed
- 10.6%Divorced
Women who gave birth in the past 12 months
| Now married: | 46.3% (18) |
| Unmarried: | 53.7% (21) |
Women who did not give birth in the past 12 months
| Now married: | 19.4% (276) |
| Unmarried: | 80.6% (1,148) |
Marital status - Black or African American population 15 years and over
- Males
- 36.9%Never married
- 59.4%Now married
- 0.0%Separated
- 0.0%Widowed
- 3.7%Divorced
- Females
- 69.5%Never married
- 30.5%Now married
- 0.0%Separated
- 0.0%Widowed
- 0.0%Divorced
Women who did not give birth in the past 12 months
| Now married: | 28.3% (25) |
| Unmarried: | 71.7% (63) |
Marital status - Asian population 15 years and over
- Males
- 74.7%Never married
- 25.3%Now married
- 0.0%Separated
- 0.0%Widowed
- 0.0%Divorced
- Females
- 59.8%Never married
- 34.3%Now married
- 0.0%Separated
- 0.0%Widowed
- 5.9%Divorced
Women who did not give birth in the past 12 months
| Now married: | 25.9% (38) |
| Unmarried: | 74.1% (110) |
Marital status - Other race population 15 years and over
- Males
- 70.7%Never married
- 29.3%Now married
- 0.0%Separated
- 0.0%Widowed
- 0.0%Divorced
- Females
- 100.0%Never married
- 0.0%Now married
- 0.0%Separated
- 0.0%Widowed
- 0.0%Divorced
Women who did not give birth in the past 12 months
| Now married: | 0.0% (0) |
| Unmarried: | 100.0% (124) |
Marital status - Two or more races population 15 years and over
- Males
- 73.6%Never married
- 26.4%Now married
- 0.0%Separated
- 0.0%Widowed
- 0.0%Divorced
- Females
- 94.5%Never married
- 5.5%Now married
- 0.0%Separated
- 0.0%Widowed
- 0.0%Divorced
Women who did not give birth in the past 12 months
| Now married: | 5.5% (12) |
| Unmarried: | 94.5% (206) |
Marital status - White alone, not Hispanic / Latino population 15 years and over
- Males
- 81.5%Never married
- 14.7%Now married
- 0.0%Separated
- 1.0%Widowed
- 2.8%Divorced
- Females
- 56.3%Never married
- 26.7%Now married
- 0.4%Separated
- 6.0%Widowed
- 10.6%Divorced
Women who gave birth in the past 12 months
| Now married: | 46.3% (19) |
| Unmarried: | 53.7% (21) |
Women who did not give birth in the past 12 months
| Now married: | 19.5% (280) |
| Unmarried: | 80.5% (1,156) |
Marital status - Hispanic or Latino population 15 years and over
- Males
- 80.8%Never married
- 9.6%Now married
- 0.0%Separated
- 0.0%Widowed
- 9.6%Divorced
- Females
- 89.5%Never married
- 10.5%Now married
- 0.0%Separated
- 0.0%Widowed
- 0.0%Divorced
Women who did not give birth in the past 12 months
| Now married: | 10.5% (9) |
| Unmarried: | 89.5% (80) |
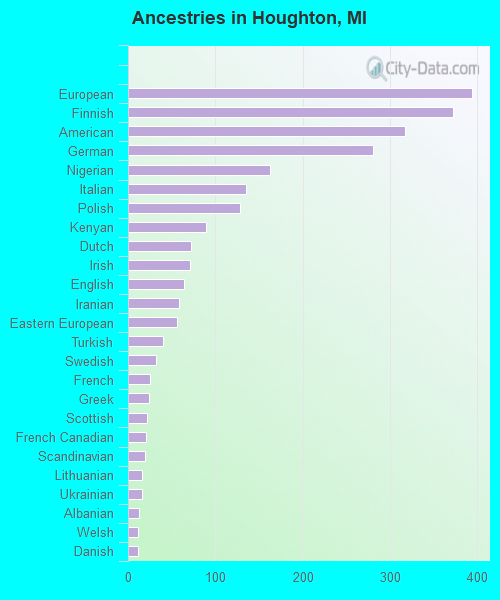
Ancestries in Houghton

- 39411.0%European
- 37210.4%Finnish
- 3178.8%American
- 2817.8%German
- 1634.5%Nigerian
- 1353.8%Italian
- 1283.6%Polish
- 892.5%Kenyan
- 722.0%Dutch
- 712.0%Irish
- 641.8%English
- 591.6%Iranian
- 561.6%Eastern European
- 401.1%Turkish
- 320.9%Swedish
- 250.7%French
- 240.7%Greek
- 220.6%Scottish
- 210.6%French Canadian
- 190.5%Scandinavian
- 160.4%Lithuanian
- 160.4%Ukrainian
- 130.4%Albanian
- 120.3%Welsh
- 110.3%Danish
- 80.2%African
- 70.2%Brazilian
- 40.1%Hungarian
- 20.06%Slovene
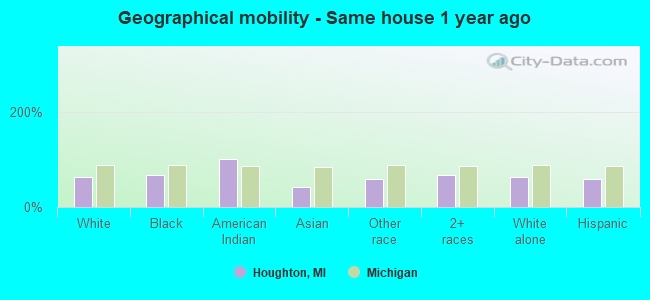
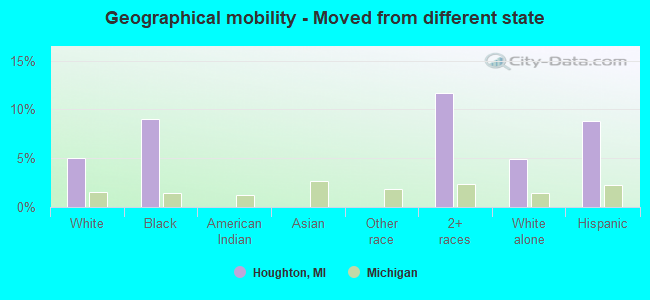
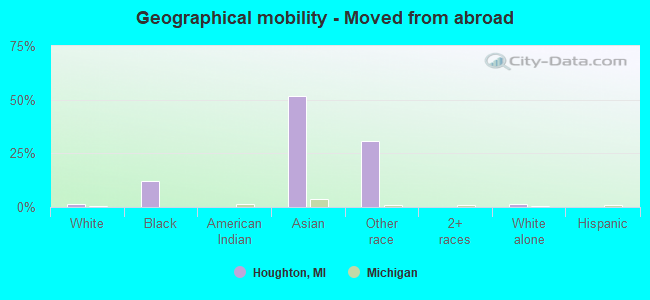
Geographical mobility in Houghton

- Same house 1 year ago
- 3,93061.8%White (Caucasian)
- 17666.8%Black or African American
- 44100.0%American Indian / Alaska Native
- 31740.7%Asian
- 20058.9%Other race
- 34167.8%Two or more races
- 3,94762.4%White alone, not Hispanic / Latino
- 16658.6%Hispanic or Latino
-
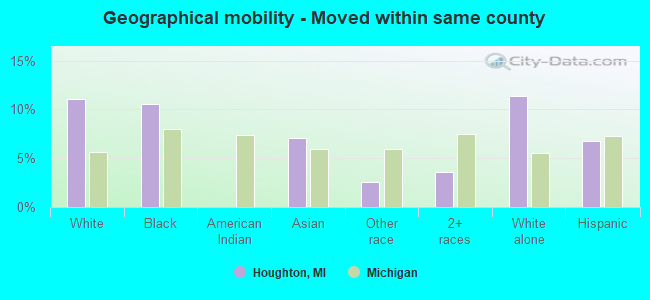
- Moved within same county
- 70511.1%White / Caucasian
- 2810.6%Black or African American
- 557.1%Asian
- 92.6%Other race
- 183.6%Two or more races
- 72011.4%White alone, not Hispanic / Latino
- 196.8%Hispanic or Latino
-
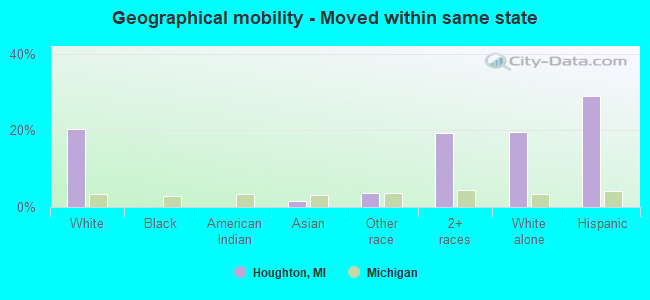
- Moved within same state
- 1,29220.3%White / Caucasian
- 131.6%Asian
- 133.8%Other race
- 9719.4%Two or more races
- 1,23219.5%White alone, not Hispanic / Latino
- 8229.0%Hispanic or Latino
-
- Moved from different state
- 3205.0%White / Caucasian
- 249.1%Black or African American
- 5911.7%Two or more races
- 3104.9%White alone, not Hispanic / Latino
- 258.8%Hispanic or Latino
-
- Moved from abroad
- 791.2%White
- 3212.1%Black or African American
- 40351.7%Asian
- 10530.9%Other race
- 851.4%White alone, not Hispanic / Latino
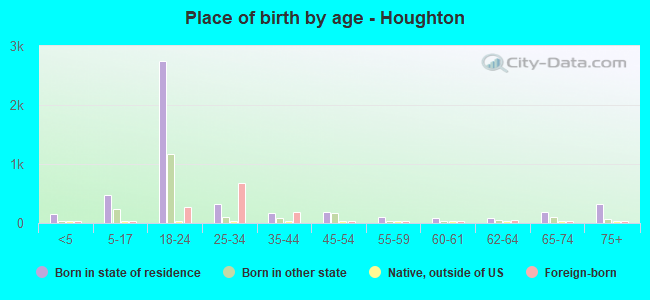
Children Nativity (place of birth) in Houghton
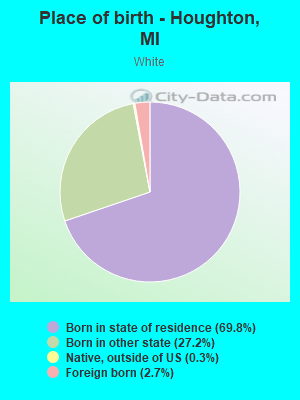
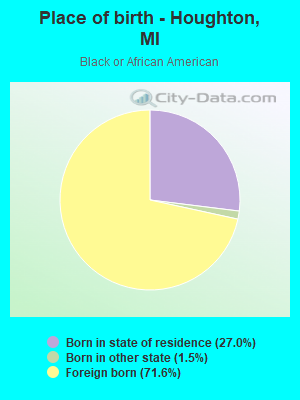
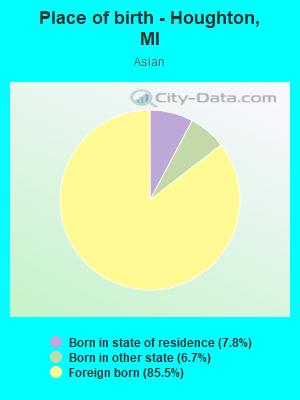
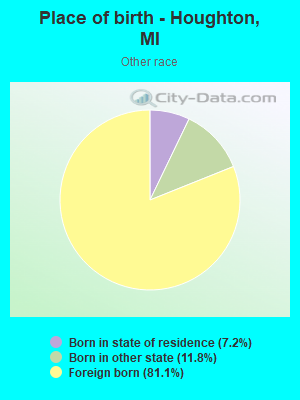
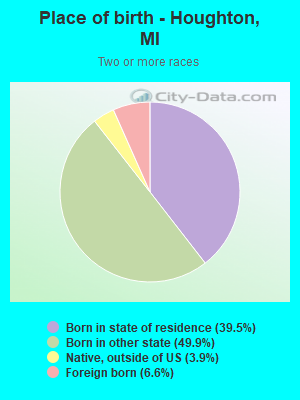
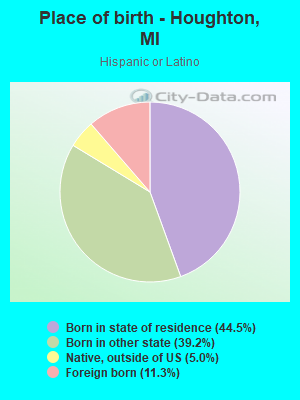
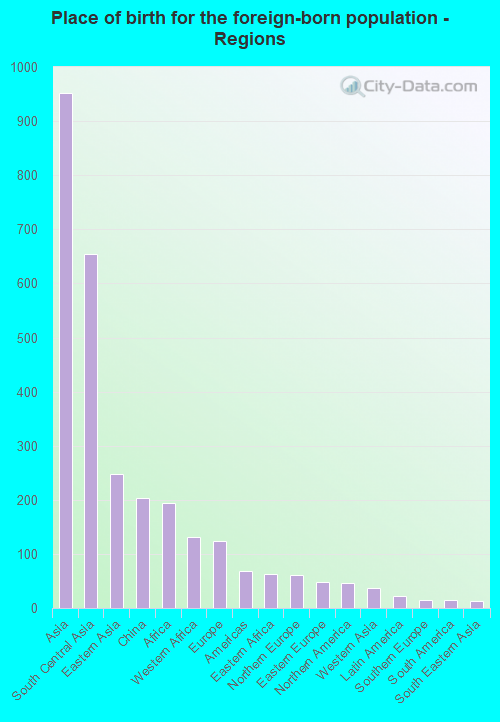
Place of birth for residents in Houghton
![Place of birth for the foreign-born population - Regions]()
- 952Asia
- 655South Central Asia
- 247Eastern Asia
- 204China
- 194Africa
- 132Western Africa
- 124Europe
- 69Americas
- 62Eastern Africa
- 61Northern Europe
- 48Eastern Europe
- 46Northern America
- 37Western Asia
- 23Latin America
- 15Southern Europe
- 15South America
- 13South Eastern Asia
- 8Caribbean
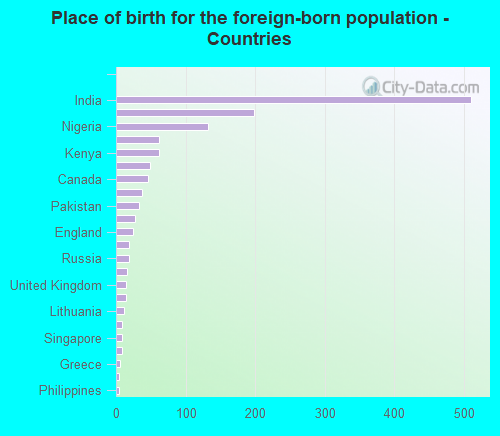
![Place of birth for the foreign-born population - Countries]()
- 511India
- 199China
- 132Nigeria
- 62Bangladesh
- 62Kenya
- 49Iran
- 46Canada
- 37Turkey
- 33Pakistan
- 27Korea
- 24England
- 19Ukraine
- 18Russia
- 16Japan
- 15United Kingdom
- 15Argentina
- 11Lithuania
- 9Spain
- 8Singapore
- 8Trinidad and Tobago
- 6Greece
- 5Taiwan
- 5Philippines