Races in Huntsville, Texas (TX) Detailed Stats
Data:
Races - White alone (%)
Races - White alone (% change since 2000)
Races - Black alone (%)
Races - Black alone (% change since 2000)
Races - American Indian alone (%)
Races - American Indian alone (% change since 2000)
Races - Asian alone (%)
Races - Asian alone (% change since 2000)
Races - Hispanic (%)
Races - Hispanic (% change since 2000)
Races - Native Hawaiian and Other Pacific Islander alone (%)
Races - Native Hawaiian and Other Pacific Islander alone (% change since 2000)
Races - Two or more races(%)
Races - Two or more races(% change since 2000)
Races - Other race alone (%)
Races - Other race alone (% change since 2000)
Racial diversity
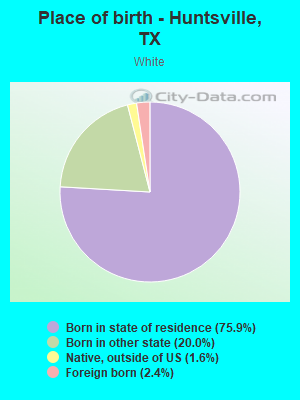
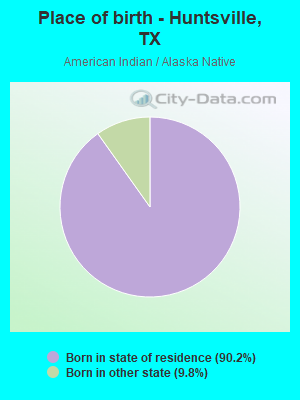
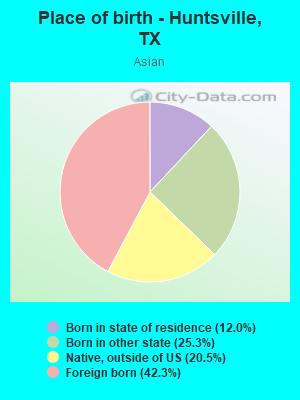
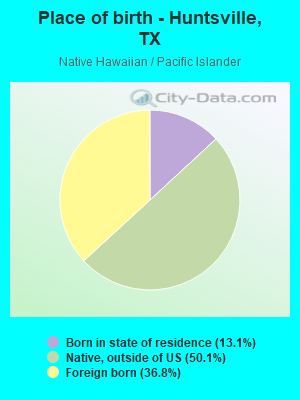
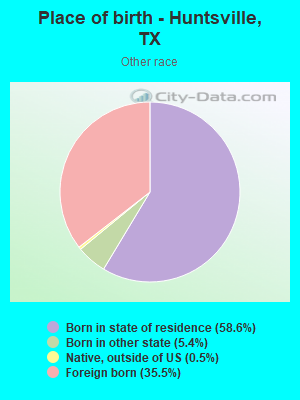
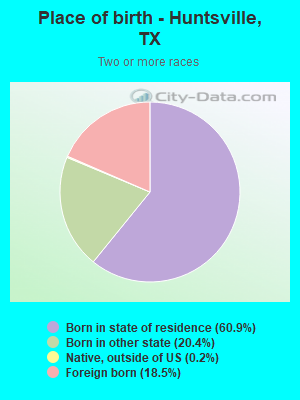
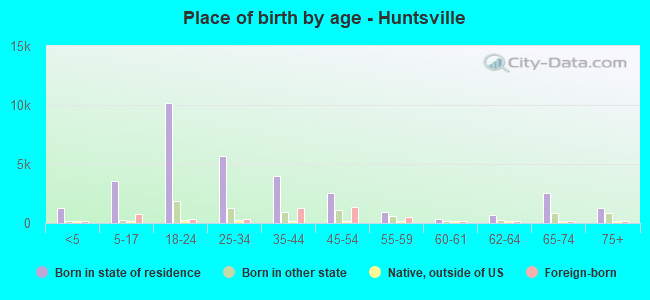
Place of birth - Born in state of residence (%)
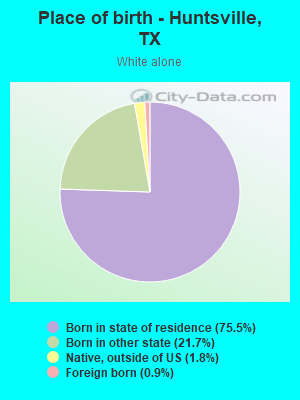
Place of birth - Born in state of residence (%) - White
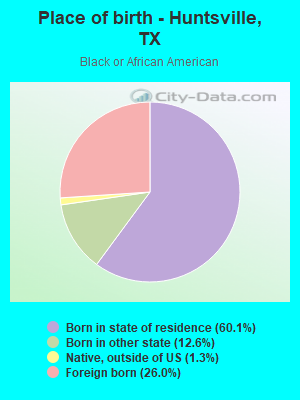
Place of birth - Born in state of residence (%) - Black or African American
Place of birth - Born in state of residence (%) - Asian
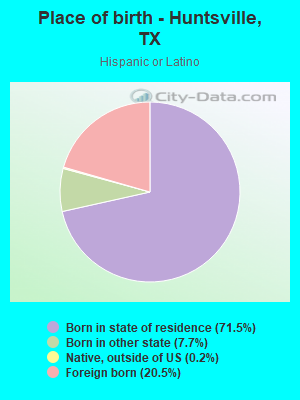
Place of birth - Born in state of residence (%) - Hispanic or Latino
Place of birth - Born in state of residence (%) - American Indian and Alaska Native
Place of birth - Born in state of residence (%) - Multirace
Place of birth - Born in state of residence (%) - Other Race
Place of birth - Born in other state (%)
Place of birth - Born in other state (%) - White
Place of birth - Born in other state (%) - Black or African American
Place of birth - Born in other state (%) - Asian
Place of birth - Born in other state (%) - Hispanic or Latino
Place of birth - Born in other state (%) - American Indian and Alaska Native
Place of birth - Born in other state (%) - Multirace
Place of birth - Born in other state (%) - Other Race
Place of birth - Native, outside of US (%)
Place of birth - Native, outside of US (%) - White
Place of birth - Native, outside of US (%) - Black or African American
Place of birth - Native, outside of US (%) - Asian
Place of birth - Native, outside of US (%) - Hispanic or Latino
Place of birth - Native, outside of US (%) - American Indian and Alaska Native
Place of birth - Native, outside of US (%) - Multirace
Place of birth - Native, outside of US (%) - Other Race
Place of birth - Foreign born (%)
Place of birth - Foreign born (%) - White
Place of birth - Foreign born (%) - Black or African American
Place of birth - Foreign born (%) - Asian
Place of birth - Foreign born (%) - Hispanic or Latino
Place of birth - Foreign born (%) - American Indian and Alaska Native
Place of birth - Foreign born (%) - Multirace
Place of birth - Foreign born (%) - Other Race
Residents speaking English at home (%)
Residents speaking English at home - Born in the United States (%)
Residents speaking English at home - Native, born elsewhere (%)
Residents speaking English at home - Foreign born (%)
Residents speaking Spanish at home (%)
Residents speaking Spanish at home - Born in the United States (%)
Residents speaking Spanish at home - Native, born elsewhere (%)
Residents speaking Spanish at home - Foreign born (%)
Residents speaking other language at home (%)
Residents speaking other language at home - Born in the United States (%)
Residents speaking other language at home - Native, born elsewhere (%)
Residents speaking other language at home - Foreign born (%)
Marital status - Never married (%)
Marital status - Now married (%)
Marital status - Separated (%)
Marital status - Widowed (%)
Marital status - Divorced (%)
Ancestries Reported - Arab (%)
Ancestries Reported - Czech (%)
Ancestries Reported - Danish (%)
Ancestries Reported - Dutch (%)
Ancestries Reported - English (%)
Ancestries Reported - French (%)
Ancestries Reported - French Canadian (%)
Ancestries Reported - German (%)
Ancestries Reported - Greek (%)
Ancestries Reported - Hungarian (%)
Ancestries Reported - Irish (%)
Ancestries Reported - Italian (%)
Ancestries Reported - Lithuanian (%)
Ancestries Reported - Norwegian (%)
Ancestries Reported - Polish (%)
Ancestries Reported - Portuguese (%)
Ancestries Reported - Russian (%)
Ancestries Reported - Scotch-Irish (%)
Ancestries Reported - Scottish (%)
Ancestries Reported - Slovak (%)
Ancestries Reported - Subsaharan African (%)
Ancestries Reported - Swedish (%)
Ancestries Reported - Swiss (%)
Ancestries Reported - Ukrainian (%)
Ancestries Reported - United States (%)
Ancestries Reported - Welsh (%)
Ancestries Reported - West Indian (%)
Ancestries Reported - Other (%)
Geographical mobility - Same house 1 year ago (%)
Geographical mobility - Same house 1 year ago (%) - White
Geographical mobility - Same house 1 year ago (%) - Black or African American
Geographical mobility - Same house 1 year ago (%) - Asian
Geographical mobility - Same house 1 year ago (%) - Hispanic or Latino
Geographical mobility - Same house 1 year ago (%) - American Indian and Alaska Native
Geographical mobility - Same house 1 year ago (%) - Multirace
Geographical mobility - Same house 1 year ago (%) - Other Race
Geographical mobility - Moved within same county (%)
Geographical mobility - Moved within same county (%) - White
Geographical mobility - Moved within same county (%) - Black or African American
Geographical mobility - Moved within same county (%) - Asian
Geographical mobility - Moved within same county (%) - Hispanic or Latino
Geographical mobility - Moved within same county (%) - American Indian and Alaska Native
Geographical mobility - Moved within same county (%) - Multirace
Geographical mobility - Moved within same county (%) - Other Race
Geographical mobility - Moved from different county within same state (%)
Geographical mobility - Moved from different county within same state (%) - White
Geographical mobility - Moved from different county within same state (%) - Black or African American
Geographical mobility - Moved from different county within same state (%) - Asian
Geographical mobility - Moved from different county within same state (%) - Hispanic or Latino
Geographical mobility - Moved from different county within same state (%) - American Indian and Alaska Native
Geographical mobility - Moved from different county within same state (%) - Multirace
Geographical mobility - Moved from different county within same state (%) - Other Race
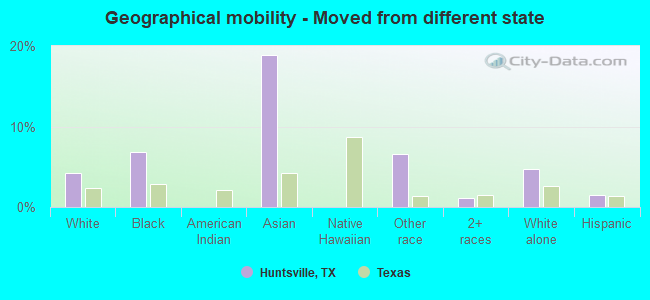
Geographical mobility - Moved from different state (%)
Geographical mobility - Moved from different state (%) - White
Geographical mobility - Moved from different state (%) - Black or African American
Geographical mobility - Moved from different state (%) - Asian
Geographical mobility - Moved from different state (%) - Hispanic or Latino
Geographical mobility - Moved from different state (%) - American Indian and Alaska Native
Geographical mobility - Moved from different state (%) - Multirace
Geographical mobility - Moved from different state (%) - Other Race
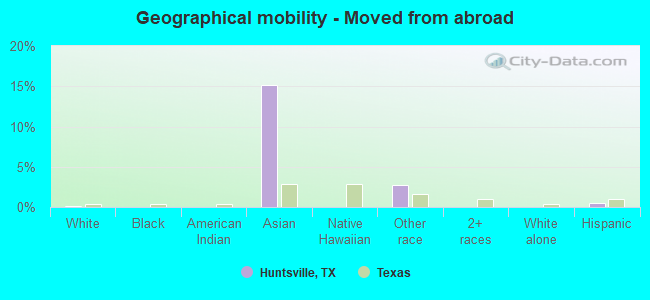
Geographical mobility - Moved from abroad (%)
Geographical mobility - Moved from abroad (%) - White
Geographical mobility - Moved from abroad (%) - Black or African American
Geographical mobility - Moved from abroad (%) - Asian
Geographical mobility - Moved from abroad (%) - Hispanic or Latino
Geographical mobility - Moved from abroad (%) - American Indian and Alaska Native
Geographical mobility - Moved from abroad (%) - Multirace
Geographical mobility - Moved from abroad (%) - Other Race
Place of birth for the foreign-born population - Ireland (%)
Place of birth for the foreign-born population - Denmark (%)
Place of birth for the foreign-born population - Norway (%)
Place of birth for the foreign-born population - Sweden (%)
Place of birth for the foreign-born population - United Kingdom (%)
Place of birth for the foreign-born population - England (%)
Place of birth for the foreign-born population - Scotland (%)
Place of birth for the foreign-born population - Other Northern Europe (%)
Place of birth for the foreign-born population - Austria (%)
Place of birth for the foreign-born population - Belgium (%)
Place of birth for the foreign-born population - France (%)
Place of birth for the foreign-born population - Germany (%)
Place of birth for the foreign-born population - Netherlands (%)
Place of birth for the foreign-born population - Switzerland (%)
Place of birth for the foreign-born population - Other Western Europe (%)
Place of birth for the foreign-born population - Greece (%)
Place of birth for the foreign-born population - Italy (%)
Place of birth for the foreign-born population - Portugal (%)
Place of birth for the foreign-born population - Spain (%)
Place of birth for the foreign-born population - Other Southern Europe (%)
Place of birth for the foreign-born population - Albania (%)
Place of birth for the foreign-born population - Belarus (%)
Place of birth for the foreign-born population - Bosnia and Herzegovina (%)
Place of birth for the foreign-born population - Bulgaria (%)
Place of birth for the foreign-born population - Croatia (%)
Place of birth for the foreign-born population - Czechoslovakia (%)
Place of birth for the foreign-born population - Hungary (%)
Place of birth for the foreign-born population - Latvia (%)
Place of birth for the foreign-born population - Lithuania (%)
Place of birth for the foreign-born population - North Macedonia (Macedonia) (%)
Place of birth for the foreign-born population - Moldova (%)
Place of birth for the foreign-born population - Poland (%)
Place of birth for the foreign-born population - Romania (%)
Place of birth for the foreign-born population - Russia (%)
Place of birth for the foreign-born population - Serbia (%)
Place of birth for the foreign-born population - Ukraine (%)
Place of birth for the foreign-born population - Other Eastern Europe (%)
Place of birth for the foreign-born population - China (%)
Place of birth for the foreign-born population - Hong Kong (%)
Place of birth for the foreign-born population - Taiwan (%)
Place of birth for the foreign-born population - Japan (%)
Place of birth for the foreign-born population - Korea (%)
Place of birth for the foreign-born population - Other Eastern Asia (%)
Place of birth for the foreign-born population - Afghanistan (%)
Place of birth for the foreign-born population - Bangladesh (%)
Place of birth for the foreign-born population - India (%)
Place of birth for the foreign-born population - Iran (%)
Place of birth for the foreign-born population - Kazakhstan (%)
Place of birth for the foreign-born population - Nepal (%)
Place of birth for the foreign-born population - Pakistan (%)
Place of birth for the foreign-born population - Sri Lanka (%)
Place of birth for the foreign-born population - Uzbekistan (%)
Place of birth for the foreign-born population - Other South Central Asia (%)
Place of birth for the foreign-born population - Burma (%)
Place of birth for the foreign-born population - Cambodia (%)
Place of birth for the foreign-born population - Indonesia (%)
Place of birth for the foreign-born population - Laos (%)
Place of birth for the foreign-born population - Malaysia (%)
Place of birth for the foreign-born population - Philippines (%)
Place of birth for the foreign-born population - Singapore (%)
Place of birth for the foreign-born population - Thailand (%)
Place of birth for the foreign-born population - Vietnam (%)
Place of birth for the foreign-born population - Other South Eastern Asia (%)
Place of birth for the foreign-born population - Armenia (%)
Place of birth for the foreign-born population - Iraq (%)
Place of birth for the foreign-born population - Israel (%)
Place of birth for the foreign-born population - Jordan (%)
Place of birth for the foreign-born population - Kuwait (%)
Place of birth for the foreign-born population - Lebanon (%)
Place of birth for the foreign-born population - Saudi Arabia (%)
Place of birth for the foreign-born population - Syria (%)
Place of birth for the foreign-born population - Turkey (%)
Place of birth for the foreign-born population - Yemen (%)
Place of birth for the foreign-born population - Other Western Asia (%)
Place of birth for the foreign-born population - Eritrea (%)
Place of birth for the foreign-born population - Ethiopia (%)
Place of birth for the foreign-born population - Kenya (%)
Place of birth for the foreign-born population - Somalia (%)
Place of birth for the foreign-born population - Uganda (%)
Place of birth for the foreign-born population - Zimbabwe (%)
Place of birth for the foreign-born population - Other Eastern Africa (%)
Place of birth for the foreign-born population - Cameroon (%)
Place of birth for the foreign-born population - Congo (%)
Place of birth for the foreign-born population - Democratic Republic of Congo (Zaire) (%)
Place of birth for the foreign-born population - Other Middle Africa (%)
Place of birth for the foreign-born population - Egypt (%)
Place of birth for the foreign-born population - Morocco (%)
Place of birth for the foreign-born population - Sudan (%)
Place of birth for the foreign-born population - Other Northern Africa (%)
Place of birth for the foreign-born population - South Africa (%)
Place of birth for the foreign-born population - Other Southern Africa (%)
Place of birth for the foreign-born population - Cabo Verde (%)
Place of birth for the foreign-born population - Ghana (%)
Place of birth for the foreign-born population - Liberia (%)
Place of birth for the foreign-born population - Nigeria (%)
Place of birth for the foreign-born population - Senegal (%)
Place of birth for the foreign-born population - Sierra Leone (%)
Place of birth for the foreign-born population - Other Western Africa (%)
Place of birth for the foreign-born population - Australia (%)
Place of birth for the foreign-born population - New Zealand (%)
Place of birth for the foreign-born population - Fiji (%)
Place of birth for the foreign-born population - Micronesia (%)
Place of birth for the foreign-born population - Bahamas (%)
Place of birth for the foreign-born population - Barbados (%)
Place of birth for the foreign-born population - Cuba (%)
Place of birth for the foreign-born population - Dominica (%)
Place of birth for the foreign-born population - Dominican Republic (%)
Place of birth for the foreign-born population - Grenada (%)
Place of birth for the foreign-born population - Haiti (%)
Place of birth for the foreign-born population - Jamaica (%)
Place of birth for the foreign-born population - St. Vincent and the Grenadines (%)
Place of birth for the foreign-born population - Trinidad and Tobago (%)
Place of birth for the foreign-born population - West Indies (%)
Place of birth for the foreign-born population - Other Caribbean (%)
Place of birth for the foreign-born population - Belize (%)
Place of birth for the foreign-born population - Costa Rica (%)
Place of birth for the foreign-born population - El Salvador (%)
Place of birth for the foreign-born population - Guatemala (%)
Place of birth for the foreign-born population - Honduras (%)
Place of birth for the foreign-born population - Mexico (%)
Place of birth for the foreign-born population - Nicaragua (%)
Place of birth for the foreign-born population - Panama (%)
Place of birth for the foreign-born population - Other Central America (%)
Place of birth for the foreign-born population - Argentina (%)
Place of birth for the foreign-born population - Bolivia (%)
Place of birth for the foreign-born population - Brazil (%)
Place of birth for the foreign-born population - Chile (%)
Place of birth for the foreign-born population - Colombia (%)
Place of birth for the foreign-born population - Ecuador (%)
Place of birth for the foreign-born population - Guyana (%)
Place of birth for the foreign-born population - Peru (%)
Place of birth for the foreign-born population - Uruguay (%)
Place of birth for the foreign-born population - Venezuela (%)
Place of birth for the foreign-born population - Other South America (%)
Place of birth for the foreign-born population - Canada (%)
Place of birth for the foreign-born population - Other Northern America (%)
Place of birth for the foreign-born population - Other (%)
Latest news about races in Huntsville, TX collected exclusively by city-data.com from local newspapers, TV, and radio stations
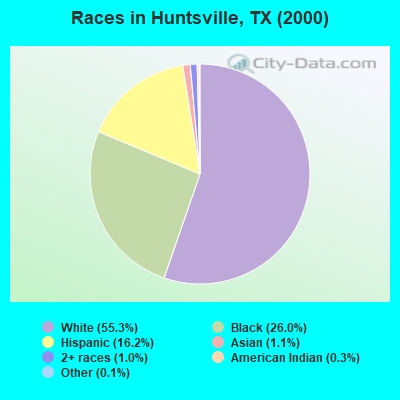
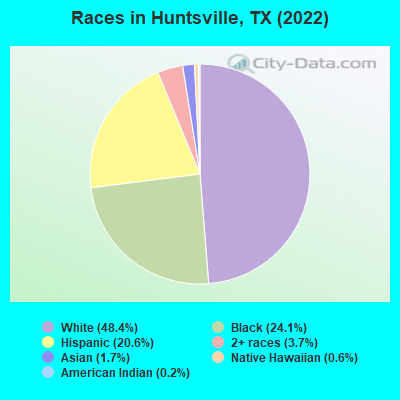
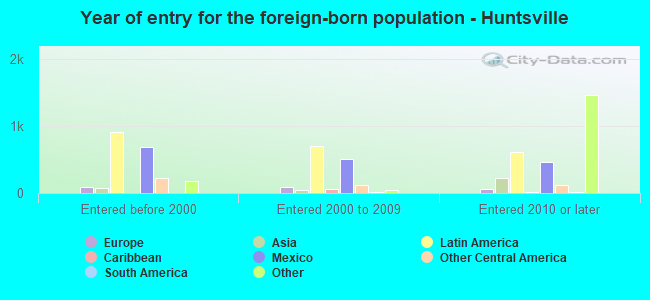
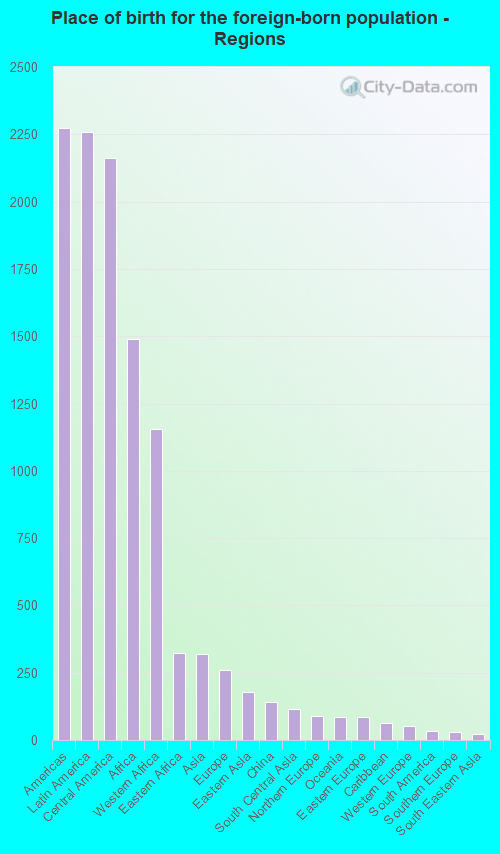
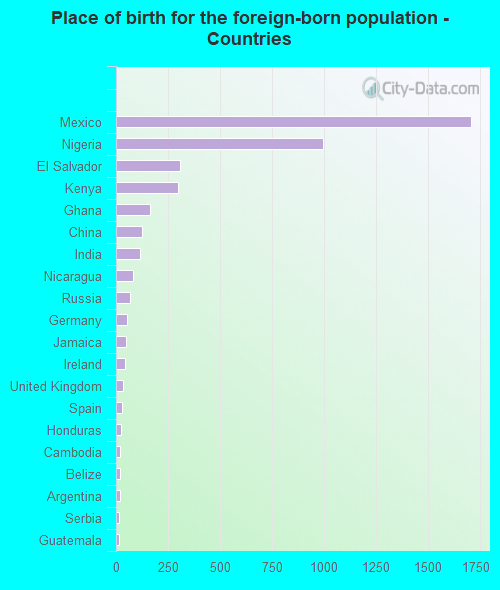
According to 2022 data, the most numerous races in Huntsville, TX are Hispanic (9,786 residents), White alone (22,968 residents), and Black alone (11,423 residents). 81.5% of Huntsville residents speak English at home. 9.4% of Huntsville, TX residents are foreign-born (4.7% born in Latin America, 3.1% born in Africa), which is 81.2% less than the foreign-born rate of 17.0% across the entire state of Texas.
Race distribution in Huntsville
2000 2022
10,933,313 52.4% White alone 6,669,666 32.0% Hispanic 2,364,255 11.3% Black alone 554,445 2.7% Asian alone 230,567 1.1% Two or more races 68,859 0.3% American Indian alone 19,958 0.10% Other race alone 10,757 0.05% Native Hawaiian and Other
12,070,642 40.2% Hispanic 11,683,430 38.9% White alone 3,508,706 11.7% Black alone 1,608,173 5.4% Asian alone 956,560 3.2% Two or more races 125,763 0.4% Other race alone 47,023 0.2% American Indian alone 29,275 0.10% Native Hawaiian and Other
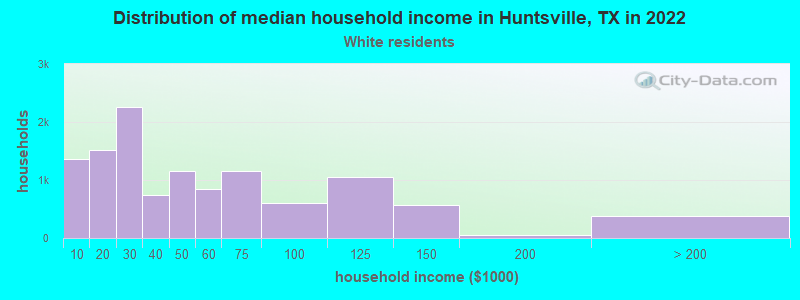
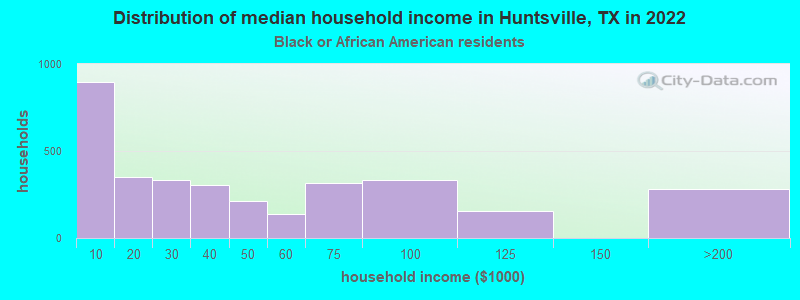
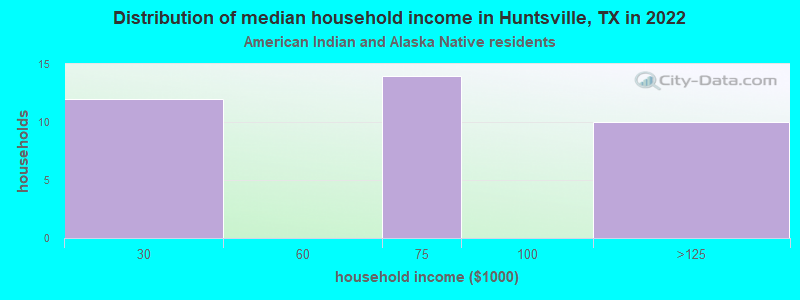
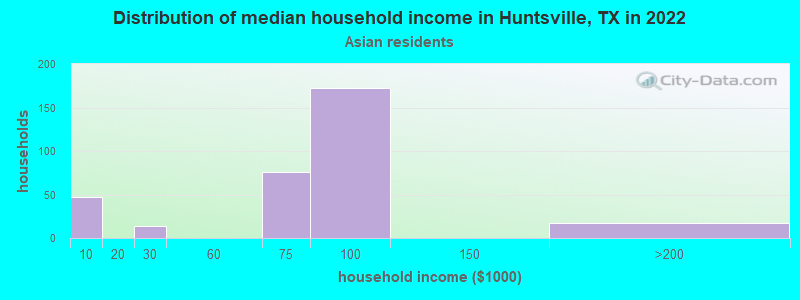
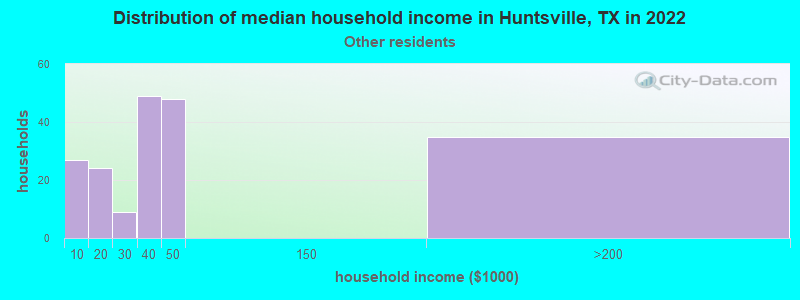
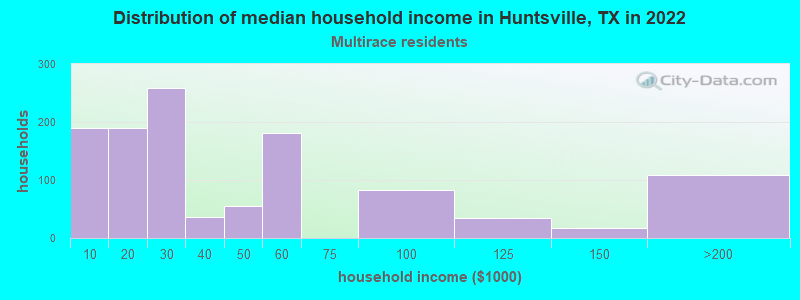
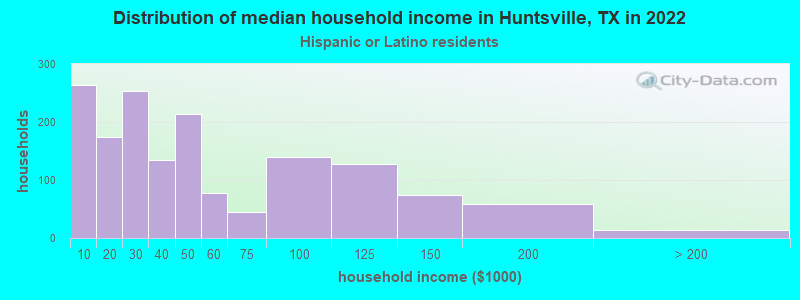
Income and house value in Huntsville Median household income in 2022 $39,227 White non-Hispanic householders$34,555 Black householders$71,111 American Indian and Alaska Native householders$75,563 Asian householders$37,250 Some other race householders$40,932 Hispanic or Latino race householdersMedian 2022 house value $284,481 White Non-Hispanic householders$124,178 Black or African American householdersover $1,000,000 American Indian or Alaska Native householders $268,112 Asian householders$355,320 Some other race householders$94,827 Two or more races householders$217,594 Hispanic or Latino householders
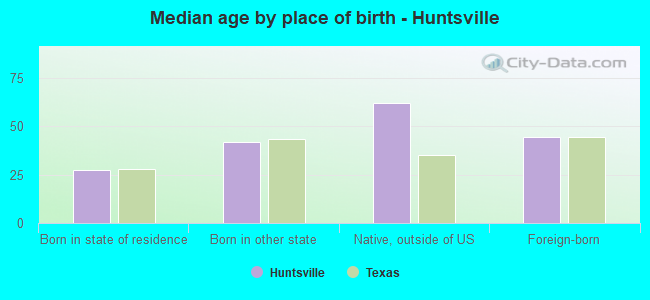
Median age by race in Huntsville
31.1 Median age for White residents31.4 31.8 29.2 Median age for Black or African American residents29.9 22.2 24.8 Median age for American Indian / Alaska Native residents41.0 17.2 53.3 Median age for Asian residents41.4 49.7 26.8 Median age for Native Hawaiian / Pacific Islander residents-666,666,666.0 26.5 16.6 Median age for Other race residents31.9 18.5 34.5 Median age for Two or more races residents37.4 32.7 33.2 Median age for White alone residents32.1 32.3 28.3 Median age for Hispanic or Latino residents30.5 24.3
Owner/renter occupied households by race in Huntsville
House owners and renters - White residents 4,685 42.3% Owner occupied6,387 57.7% Renter occupiedHouse owners and renters - Black or African American residents 508 16.2% Owner occupied2,632 83.8% Renter occupiedHouse owners and renters - American Indian / Alaska Native residents 10 30.9% Owner occupied23 69.1% Renter occupiedHouse owners and renters - Asian residents 277 82.2% Owner occupied60 17.8% Renter occupiedHouse owners and renters - Native Hawaiian / Pacific Islander residents 60 100.0% Owner occupiedHouse owners and renters - Other race residents 111 58.3% Owner occupied80 41.7% Renter occupiedHouse owners and renters - Two or more races residents 202 16.3% Owner occupied1,037 83.7% Renter occupiedHouse owners and renters - White alone residents 4,383 43.7% Owner occupied5,637 56.3% Renter occupiedHouse owners and renters - Hispanic or Latino residents 654 30.3% Owner occupied1,506 69.7% Renter occupied
Language usage in Huntsville
English speakers - Total 81.5% of residents of Huntsville speak English at home.
12.1% of residents speak Spanish at home 4,235 76.5% Speak English very well1,300 23.5% Speak English less than very well7.5% of residents speak other language at home 2,879 84.0% Speak English very well549 16.0% Speak English less than very well
English speakers - Born in the United States 95.1% of residents of Huntsville speak English at home.
5.5% of residents speak Spanish at home 378 83.6% Speak English very well74 16.4% Speak English less than very well0.7% of residents speak other language at home 57 100.0% Speak English very well
English speakers - Native, born elsewhere 85.7% of residents of Huntsville speak English at home.
2.6% of residents speak Spanish at home 7 31.8% Speak English very well15 68.2% Speak English less than very well40.1% of residents speak other language at home 339 100.0% Speak English very well
English speakers - Foreign-born 22.8% of residents of Huntsville speak English at home.
31.8% of residents speak Spanish at home 543 31.8% Speak English very well1,167 68.2% Speak English less than very well29.7% of residents speak other language at home 1,063 66.4% Speak English very well538 33.6% Speak English less than very well
White (Caucasian) - Speak only English Native:
97.9% (21,814)Foreign-born:
24.5% (154)
White (Caucasian) - Speak another language Native:
5.9% (1,306)Foreign-born:
76.1% (478)
Black or African American - Speak only English Native:
97.8% (7,963)Foreign-born:
10.1% (312)
Black or African American - Speak another language Native:
2.1% (173)Foreign-born:
71.4% (2,216)
Asian - Speak only English Native:
56.1% (266)Foreign-born:
23.0% (81)
Asian - Speak another language Native:
44.1% (209)Foreign-born:
77.4% (272)
Native Hawaiian / Pacific Islander - Speak another language Native:
96.3% (180)Foreign-born:
100.0% (92)
Other race - Speak only English Native:
43.6% (347)Foreign-born:
7.6% (41)
Other race - Speak another language Native:
42.7% (340)Foreign-born:
96.1% (516)
Two or more races - Speak only English Native:
66.1% (3,538)Foreign-born:
5.4% (65)
Two or more races - Speak another language Native:
31.1% (1,664)Foreign-born:
82.6% (1,001)
White alone - Speak only English Native:
99.3% (22,124)Foreign-born:
83.1% (183)
White alone - Speak another language Native:
0.9% (192)Foreign-born:
17.1% (38)
Hispanic or Latino - Speak only English Native:
47.9% (3,541)Foreign-born:
4.5% (90)
Hispanic or Latino - Speak another language Native:
51.2% (3,788)Foreign-born:
88.1% (1,757)
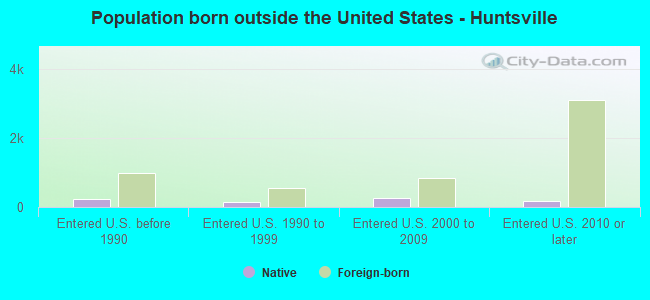
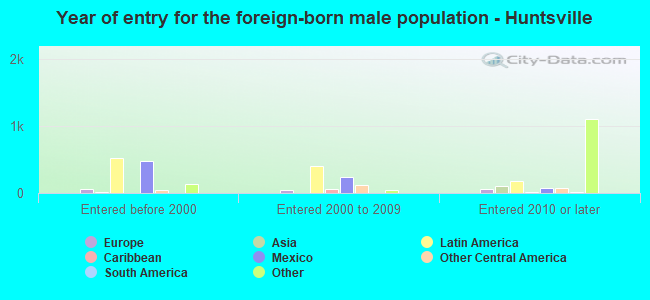
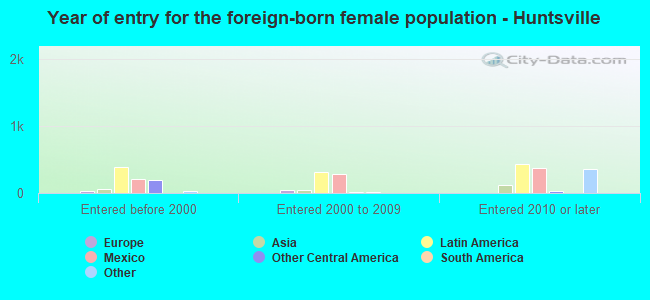
Foreign-born residents in Huntsville 4,429 residents are foreign born (4.7% Latin America , 3.1% Africa ).
This city:
9.4%Texas:
17.1%
Marital status for residents in Huntsville Marital status - White (Caucasian) population 15 years and over
Males 46.2% Never married31.3% Now married1.8% Separated3.0% Widowed17.7% DivorcedFemales 45.3% Never married27.4% Now married1.0% Separated13.7% Widowed12.6% DivorcedWomen who gave birth in the past 12 months Now married:
61.7% (182)Unmarried:
38.3% (113)
Women who did not give birth in the past 12 months Now married:
23.0% (1,635)Unmarried:
77.0% (5,461)
Marital status - Black or African American population 15 years and over
Males 61.6% Never married23.7% Now married3.2% Separated1.5% Widowed10.1% DivorcedFemales 74.5% Never married13.4% Now married0.0% Separated2.9% Widowed9.1% DivorcedWomen who gave birth in the past 12 months Now married:
14.4% (15)Unmarried:
85.6% (90)
Women who did not give birth in the past 12 months Now married:
8.8% (249)Unmarried:
91.2% (2,573)
Marital status - American Indian / Alaska Native population 15 years and over
Males 79.0% Never married5.0% Now married0.0% Separated7.0% Widowed9.0% DivorcedFemales 100.0% Never married0.0% Now married0.0% Separated0.0% Widowed0.0% DivorcedWomen who did not give birth in the past 12 months Now married:
0.0% (0)Unmarried:
100.0% (34)
Marital status - Asian population 15 years and over
Males 10.6% Never married89.4% Now married0.0% Separated0.0% Widowed0.0% DivorcedFemales 57.1% Never married39.5% Now married0.0% Separated3.4% Widowed0.0% DivorcedWomen who did not give birth in the past 12 months Now married:
0.0% (0)Unmarried:
100.0% (269)
Marital status - Native Hawaiian / Pacific Islander population 15 years and over
Males 0.0% Never married100.0% Now married0.0% Separated0.0% Widowed0.0% DivorcedFemales 5.5% Never married94.5% Now married0.0% Separated0.0% Widowed0.0% DivorcedWomen who gave birth in the past 12 months Now married:
100.0% (162)Unmarried:
0.0% (0)
Women who did not give birth in the past 12 months Now married:
0.0% (0)Unmarried:
100.0% (12)
Marital status - Other race population 15 years and over
Males 32.7% Never married22.6% Now married19.3% Separated5.7% Widowed19.6% DivorcedFemales 37.1% Never married56.8% Now married0.0% Separated0.0% Widowed6.1% DivorcedWomen who did not give birth in the past 12 months Now married:
57.5% (238)Unmarried:
42.5% (176)
Marital status - Two or more races population 15 years and over
Males 67.9% Never married15.8% Now married4.3% Separated0.4% Widowed11.7% DivorcedFemales 61.5% Never married21.1% Now married10.6% Separated6.2% Widowed0.6% DivorcedWomen who gave birth in the past 12 months Now married:
100.0% (91)Unmarried:
0.0% (0)
Women who did not give birth in the past 12 months Now married:
20.9% (381)Unmarried:
79.1% (1,443)
Marital status - White alone, not Hispanic / Latino population 15 years and over
Males 43.8% Never married33.0% Now married1.1% Separated3.7% Widowed18.4% DivorcedFemales 45.4% Never married26.0% Now married0.3% Separated14.5% Widowed13.8% DivorcedWomen who gave birth in the past 12 months Now married:
59.4% (138)Unmarried:
40.6% (95)
Women who did not give birth in the past 12 months Now married:
20.2% (1,313)Unmarried:
79.8% (5,175)
Marital status - Hispanic or Latino population 15 years and over
Males 58.9% Never married19.9% Now married6.4% Separated0.6% Widowed14.3% DivorcedFemales 53.0% Never married32.8% Now married8.1% Separated3.5% Widowed2.7% DivorcedWomen who gave birth in the past 12 months Now married:
81.8% (112)Unmarried:
18.2% (25)
Women who did not give birth in the past 12 months Now married:
34.0% (810)Unmarried:
66.0% (1,571)
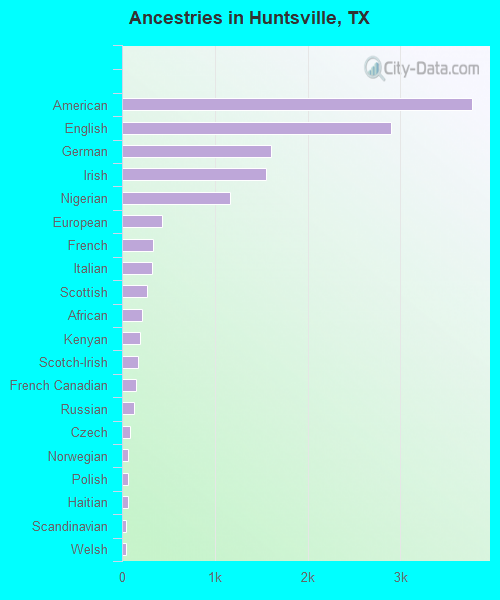
Ancestries in Huntsville
3,766 12.3% American2,899 9.5% English1,610 5.3% German1,549 5.1% Irish1,169 3.8% Nigerian434 1.4% European336 1.1% French324 1.1% Italian268 0.9% Scottish211 0.7% African197 0.6% Kenyan169 0.6% Scotch-Irish150 0.5% French Canadian130 0.4% Russian91 0.3% Czech63 0.2% Norwegian61 0.2% Polish61 0.2% Haitian48 0.2% Scandinavian42 0.1% Welsh32 0.1% Belgian25 0.08% Finnish24 0.08% Ghanaian24 0.08% Swedish22 0.07% Moroccan17 0.06% Cajun17 0.06% Serbian16 0.05% Canadian15 0.05% Portuguese14 0.05% Syrian13 0.04% Dutch11 0.04% Northern European11 0.04% Greek9 0.03% British8 0.03% Lebanese8 0.03% Czechoslovakian8 0.03% Jamaican
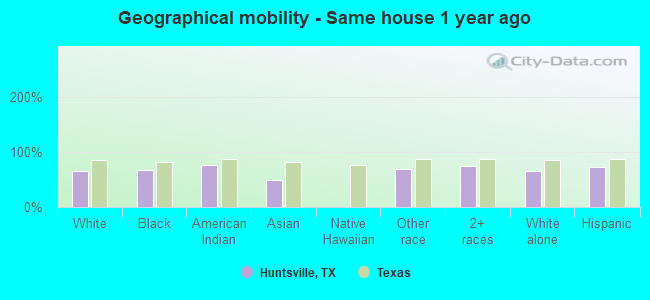
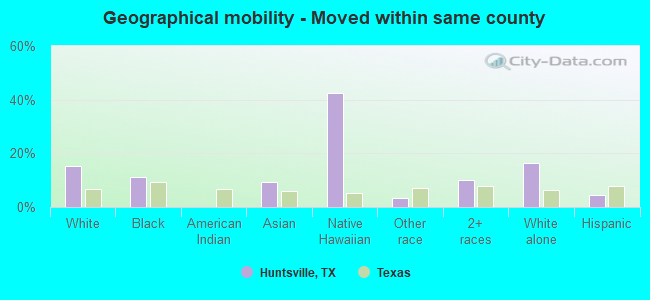
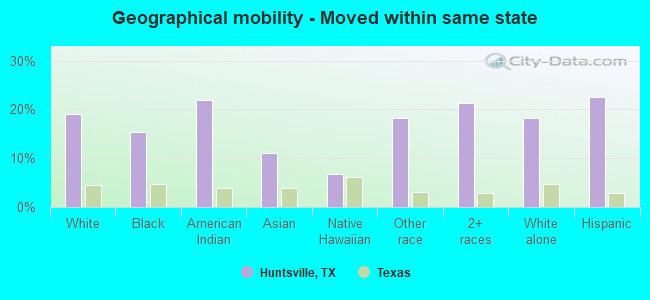
Geographical mobility in Huntsville Same house 1 year ago 17,312 65.9% White (Caucasian)7,505 66.9% Black or African American140 77.0% American Indian / Alaska Native402 50.0% Asian1,014 69.9% Other race5,051 74.0% Two or more races15,362 65.3% White alone, not Hispanic / Latino7,135 72.1% Hispanic or LatinoMoved within same county 3,984 15.2% White / Caucasian1,273 11.4% Black or African American75 9.4% Asian120 42.4% Native Hawaiian / Pacific Islander50 3.4% Other race688 10.1% Two or more races3,860 16.4% White alone, not Hispanic / Latino461 4.7% Hispanic or LatinoMoved within same state 5,004 19.1% White / Caucasian1,727 15.4% Black or African American40 21.8% American Indian / Alaska Native90 11.1% Asian19 6.8% Native Hawaiian / Pacific Islander263 18.2% Other race1,460 21.4% Two or more races4,279 18.2% White alone, not Hispanic / Latino2,225 22.5% Hispanic or LatinoMoved from different state 1,102 4.2% White / Caucasian765 6.8% Black or African American152 18.9% Asian96 6.6% Other race78 1.1% Two or more races1,100 4.7% White alone, not Hispanic / Latino153 1.5% Hispanic or LatinoMoved from abroad 29 0.1% White122 15.2% Asian40 2.8% Other race2 0.0% Two or more races6 0.0% White alone, not Hispanic / Latino45 0.5% Hispanic or Latino
Children Nativity (place of birth) in Huntsville
Children under 6 years - Living with two parents Both parents native 523 100.0% NativeBoth parents foreign-born 318 100.0% NativeOne native, one foreign-born parent 113 100.0% NativeChildren under 6 years - Living with one parent Native parent 1,039 100.0% NativeForeign-born parent 43 100.0% NativeChildren 6 to 17 years - Living with two parents Both parents native 1,263 100.0% NativeBoth parents foreign-born 300 54.9% Native247 45.1% Foreign-bornOne native, one foreign-born parent 246 71.1% Native100 28.9% Foreign-bornChildren 6 to 17 years - Living with one parent Native parent 1,224 100.0% NativeForeign-born parent 140 50.5% Native138 49.5% Foreign-born
Grandparents responsible for own grandchildren in Huntsville
Grandparents (30 to 59 years) White / Caucasian 113 45.2% Responsible for grandchildren137 54.8% Not responsible for grandchildrenBlack or African American 20 100.0% Not responsible for grandchildrenNative Hawaiian / Pacific Islander 72 100.0% Not responsible for grandchildrenTwo or more races 91 100.0% Not responsible for grandchildrenWhite alone, not Hispanic / Latino 100 48.6% Responsible for grandchildren105 51.4% Not responsible for grandchildrenHispanic or Latino 56 26.0% Responsible for grandchildren161 74.0% Not responsible for grandchildrenGrandparents (60 years and over) White / Caucasian 13 25.3% Responsible for grandchildren39 74.7% Not responsible for grandchildrenBlack or African American 26 26.4% Responsible for grandchildren73 73.6% Not responsible for grandchildrenTwo or more races 7 100.0% Responsible for grandchildrenWhite alone, not Hispanic / Latino 16 40.3% Responsible for grandchildren23 59.7% Not responsible for grandchildrenHispanic or Latino 4 11.7% Responsible for grandchildren31 88.3% Not responsible for grandchildren