Races in Indianapolis, Indiana (IN) Detailed Stats
Data:
Races - White alone (%)
Races - White alone (% change since 2000)
Races - Black alone (%)
Races - Black alone (% change since 2000)
Races - American Indian alone (%)
Races - American Indian alone (% change since 2000)
Races - Asian alone (%)
Races - Asian alone (% change since 2000)
Races - Hispanic (%)
Races - Hispanic (% change since 2000)
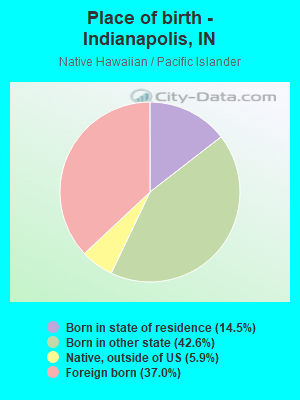
Races - Native Hawaiian and Other Pacific Islander alone (%)
Races - Native Hawaiian and Other Pacific Islander alone (% change since 2000)
Races - Two or more races(%)
Races - Two or more races(% change since 2000)
Races - Other race alone (%)
Races - Other race alone (% change since 2000)
Racial diversity
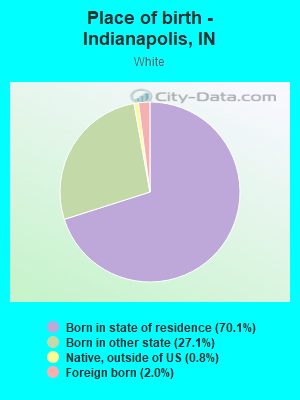
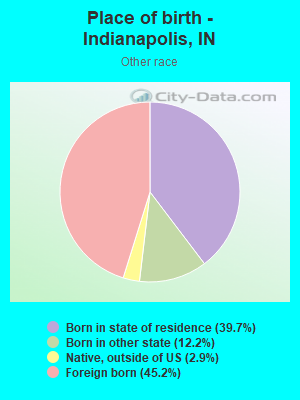
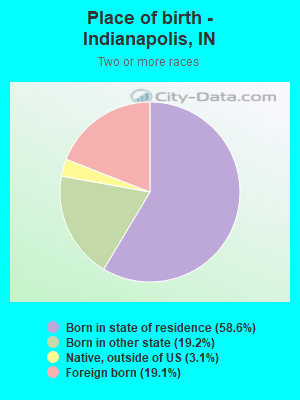
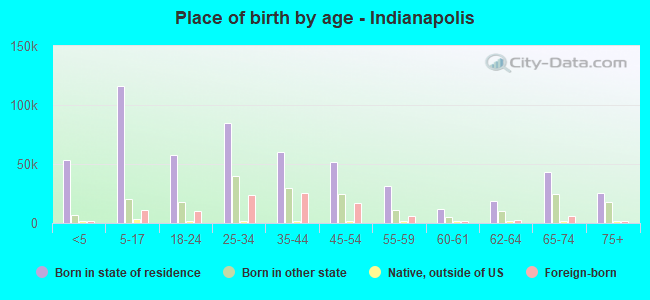
Place of birth - Born in state of residence (%)
Place of birth - Born in state of residence (%) - White
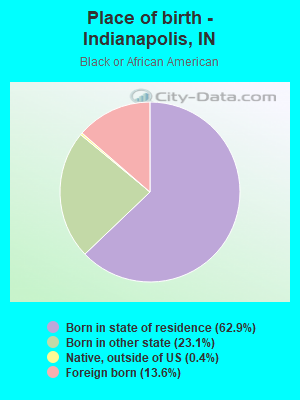
Place of birth - Born in state of residence (%) - Black or African American
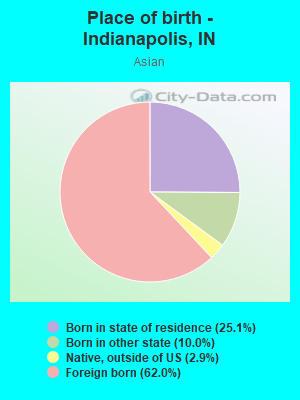
Place of birth - Born in state of residence (%) - Asian
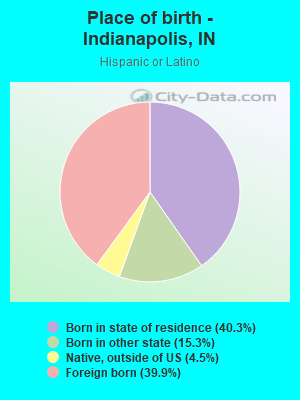
Place of birth - Born in state of residence (%) - Hispanic or Latino
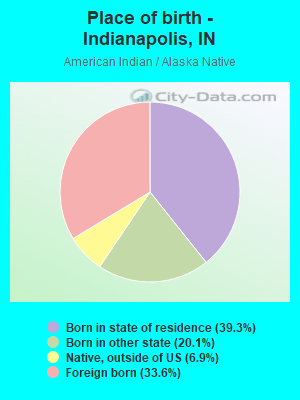
Place of birth - Born in state of residence (%) - American Indian and Alaska Native
Place of birth - Born in state of residence (%) - Multirace
Place of birth - Born in state of residence (%) - Other Race
Place of birth - Born in other state (%)
Place of birth - Born in other state (%) - White
Place of birth - Born in other state (%) - Black or African American
Place of birth - Born in other state (%) - Asian
Place of birth - Born in other state (%) - Hispanic or Latino
Place of birth - Born in other state (%) - American Indian and Alaska Native
Place of birth - Born in other state (%) - Multirace
Place of birth - Born in other state (%) - Other Race
Place of birth - Native, outside of US (%)
Place of birth - Native, outside of US (%) - White
Place of birth - Native, outside of US (%) - Black or African American
Place of birth - Native, outside of US (%) - Asian
Place of birth - Native, outside of US (%) - Hispanic or Latino
Place of birth - Native, outside of US (%) - American Indian and Alaska Native
Place of birth - Native, outside of US (%) - Multirace
Place of birth - Native, outside of US (%) - Other Race
Place of birth - Foreign born (%)
Place of birth - Foreign born (%) - White
Place of birth - Foreign born (%) - Black or African American
Place of birth - Foreign born (%) - Asian
Place of birth - Foreign born (%) - Hispanic or Latino
Place of birth - Foreign born (%) - American Indian and Alaska Native
Place of birth - Foreign born (%) - Multirace
Place of birth - Foreign born (%) - Other Race
Residents speaking English at home (%)
Residents speaking English at home - Born in the United States (%)
Residents speaking English at home - Native, born elsewhere (%)
Residents speaking English at home - Foreign born (%)
Residents speaking Spanish at home (%)
Residents speaking Spanish at home - Born in the United States (%)
Residents speaking Spanish at home - Native, born elsewhere (%)
Residents speaking Spanish at home - Foreign born (%)
Residents speaking other language at home (%)
Residents speaking other language at home - Born in the United States (%)
Residents speaking other language at home - Native, born elsewhere (%)
Residents speaking other language at home - Foreign born (%)
Marital status - Never married (%)
Marital status - Now married (%)
Marital status - Separated (%)
Marital status - Widowed (%)
Marital status - Divorced (%)
Ancestries Reported - Arab (%)
Ancestries Reported - Czech (%)
Ancestries Reported - Danish (%)
Ancestries Reported - Dutch (%)
Ancestries Reported - English (%)
Ancestries Reported - French (%)
Ancestries Reported - French Canadian (%)
Ancestries Reported - German (%)
Ancestries Reported - Greek (%)
Ancestries Reported - Hungarian (%)
Ancestries Reported - Irish (%)
Ancestries Reported - Italian (%)
Ancestries Reported - Lithuanian (%)
Ancestries Reported - Norwegian (%)
Ancestries Reported - Polish (%)
Ancestries Reported - Portuguese (%)
Ancestries Reported - Russian (%)
Ancestries Reported - Scotch-Irish (%)
Ancestries Reported - Scottish (%)
Ancestries Reported - Slovak (%)
Ancestries Reported - Subsaharan African (%)
Ancestries Reported - Swedish (%)
Ancestries Reported - Swiss (%)
Ancestries Reported - Ukrainian (%)
Ancestries Reported - United States (%)
Ancestries Reported - Welsh (%)
Ancestries Reported - West Indian (%)
Ancestries Reported - Other (%)
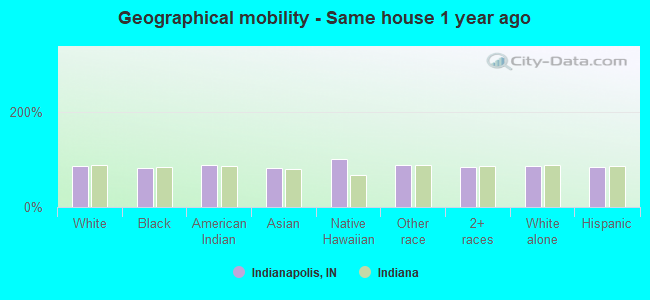
Geographical mobility - Same house 1 year ago (%)
Geographical mobility - Same house 1 year ago (%) - White
Geographical mobility - Same house 1 year ago (%) - Black or African American
Geographical mobility - Same house 1 year ago (%) - Asian
Geographical mobility - Same house 1 year ago (%) - Hispanic or Latino
Geographical mobility - Same house 1 year ago (%) - American Indian and Alaska Native
Geographical mobility - Same house 1 year ago (%) - Multirace
Geographical mobility - Same house 1 year ago (%) - Other Race
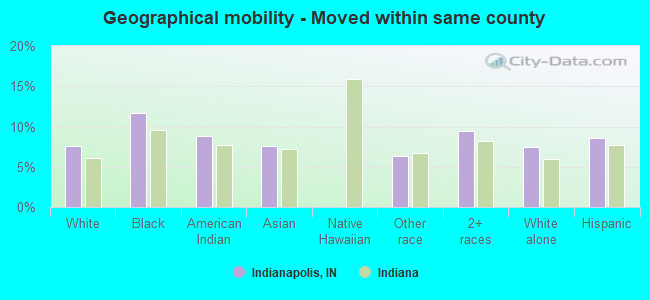
Geographical mobility - Moved within same county (%)
Geographical mobility - Moved within same county (%) - White
Geographical mobility - Moved within same county (%) - Black or African American
Geographical mobility - Moved within same county (%) - Asian
Geographical mobility - Moved within same county (%) - Hispanic or Latino
Geographical mobility - Moved within same county (%) - American Indian and Alaska Native
Geographical mobility - Moved within same county (%) - Multirace
Geographical mobility - Moved within same county (%) - Other Race
Geographical mobility - Moved from different county within same state (%)
Geographical mobility - Moved from different county within same state (%) - White
Geographical mobility - Moved from different county within same state (%) - Black or African American
Geographical mobility - Moved from different county within same state (%) - Asian
Geographical mobility - Moved from different county within same state (%) - Hispanic or Latino
Geographical mobility - Moved from different county within same state (%) - American Indian and Alaska Native
Geographical mobility - Moved from different county within same state (%) - Multirace
Geographical mobility - Moved from different county within same state (%) - Other Race
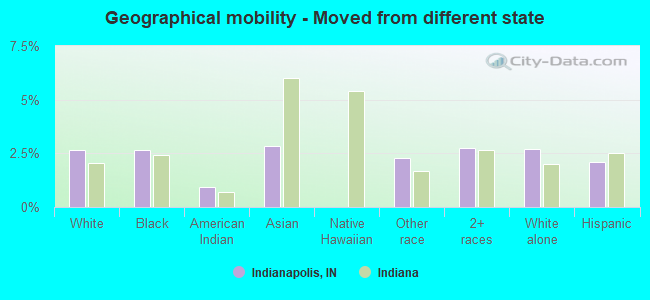
Geographical mobility - Moved from different state (%)
Geographical mobility - Moved from different state (%) - White
Geographical mobility - Moved from different state (%) - Black or African American
Geographical mobility - Moved from different state (%) - Asian
Geographical mobility - Moved from different state (%) - Hispanic or Latino
Geographical mobility - Moved from different state (%) - American Indian and Alaska Native
Geographical mobility - Moved from different state (%) - Multirace
Geographical mobility - Moved from different state (%) - Other Race
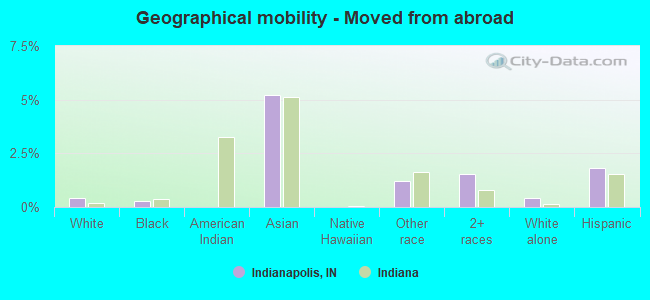
Geographical mobility - Moved from abroad (%)
Geographical mobility - Moved from abroad (%) - White
Geographical mobility - Moved from abroad (%) - Black or African American
Geographical mobility - Moved from abroad (%) - Asian
Geographical mobility - Moved from abroad (%) - Hispanic or Latino
Geographical mobility - Moved from abroad (%) - American Indian and Alaska Native
Geographical mobility - Moved from abroad (%) - Multirace
Geographical mobility - Moved from abroad (%) - Other Race
Place of birth for the foreign-born population - Ireland (%)
Place of birth for the foreign-born population - Denmark (%)
Place of birth for the foreign-born population - Norway (%)
Place of birth for the foreign-born population - Sweden (%)
Place of birth for the foreign-born population - United Kingdom (%)
Place of birth for the foreign-born population - England (%)
Place of birth for the foreign-born population - Scotland (%)
Place of birth for the foreign-born population - Other Northern Europe (%)
Place of birth for the foreign-born population - Austria (%)
Place of birth for the foreign-born population - Belgium (%)
Place of birth for the foreign-born population - France (%)
Place of birth for the foreign-born population - Germany (%)
Place of birth for the foreign-born population - Netherlands (%)
Place of birth for the foreign-born population - Switzerland (%)
Place of birth for the foreign-born population - Other Western Europe (%)
Place of birth for the foreign-born population - Greece (%)
Place of birth for the foreign-born population - Italy (%)
Place of birth for the foreign-born population - Portugal (%)
Place of birth for the foreign-born population - Spain (%)
Place of birth for the foreign-born population - Other Southern Europe (%)
Place of birth for the foreign-born population - Albania (%)
Place of birth for the foreign-born population - Belarus (%)
Place of birth for the foreign-born population - Bosnia and Herzegovina (%)
Place of birth for the foreign-born population - Bulgaria (%)
Place of birth for the foreign-born population - Croatia (%)
Place of birth for the foreign-born population - Czechoslovakia (%)
Place of birth for the foreign-born population - Hungary (%)
Place of birth for the foreign-born population - Latvia (%)
Place of birth for the foreign-born population - Lithuania (%)
Place of birth for the foreign-born population - North Macedonia (Macedonia) (%)
Place of birth for the foreign-born population - Moldova (%)
Place of birth for the foreign-born population - Poland (%)
Place of birth for the foreign-born population - Romania (%)
Place of birth for the foreign-born population - Russia (%)
Place of birth for the foreign-born population - Serbia (%)
Place of birth for the foreign-born population - Ukraine (%)
Place of birth for the foreign-born population - Other Eastern Europe (%)
Place of birth for the foreign-born population - China (%)
Place of birth for the foreign-born population - Hong Kong (%)
Place of birth for the foreign-born population - Taiwan (%)
Place of birth for the foreign-born population - Japan (%)
Place of birth for the foreign-born population - Korea (%)
Place of birth for the foreign-born population - Other Eastern Asia (%)
Place of birth for the foreign-born population - Afghanistan (%)
Place of birth for the foreign-born population - Bangladesh (%)
Place of birth for the foreign-born population - India (%)
Place of birth for the foreign-born population - Iran (%)
Place of birth for the foreign-born population - Kazakhstan (%)
Place of birth for the foreign-born population - Nepal (%)
Place of birth for the foreign-born population - Pakistan (%)
Place of birth for the foreign-born population - Sri Lanka (%)
Place of birth for the foreign-born population - Uzbekistan (%)
Place of birth for the foreign-born population - Other South Central Asia (%)
Place of birth for the foreign-born population - Burma (%)
Place of birth for the foreign-born population - Cambodia (%)
Place of birth for the foreign-born population - Indonesia (%)
Place of birth for the foreign-born population - Laos (%)
Place of birth for the foreign-born population - Malaysia (%)
Place of birth for the foreign-born population - Philippines (%)
Place of birth for the foreign-born population - Singapore (%)
Place of birth for the foreign-born population - Thailand (%)
Place of birth for the foreign-born population - Vietnam (%)
Place of birth for the foreign-born population - Other South Eastern Asia (%)
Place of birth for the foreign-born population - Armenia (%)
Place of birth for the foreign-born population - Iraq (%)
Place of birth for the foreign-born population - Israel (%)
Place of birth for the foreign-born population - Jordan (%)
Place of birth for the foreign-born population - Kuwait (%)
Place of birth for the foreign-born population - Lebanon (%)
Place of birth for the foreign-born population - Saudi Arabia (%)
Place of birth for the foreign-born population - Syria (%)
Place of birth for the foreign-born population - Turkey (%)
Place of birth for the foreign-born population - Yemen (%)
Place of birth for the foreign-born population - Other Western Asia (%)
Place of birth for the foreign-born population - Eritrea (%)
Place of birth for the foreign-born population - Ethiopia (%)
Place of birth for the foreign-born population - Kenya (%)
Place of birth for the foreign-born population - Somalia (%)
Place of birth for the foreign-born population - Uganda (%)
Place of birth for the foreign-born population - Zimbabwe (%)
Place of birth for the foreign-born population - Other Eastern Africa (%)
Place of birth for the foreign-born population - Cameroon (%)
Place of birth for the foreign-born population - Congo (%)
Place of birth for the foreign-born population - Democratic Republic of Congo (Zaire) (%)
Place of birth for the foreign-born population - Other Middle Africa (%)
Place of birth for the foreign-born population - Egypt (%)
Place of birth for the foreign-born population - Morocco (%)
Place of birth for the foreign-born population - Sudan (%)
Place of birth for the foreign-born population - Other Northern Africa (%)
Place of birth for the foreign-born population - South Africa (%)
Place of birth for the foreign-born population - Other Southern Africa (%)
Place of birth for the foreign-born population - Cabo Verde (%)
Place of birth for the foreign-born population - Ghana (%)
Place of birth for the foreign-born population - Liberia (%)
Place of birth for the foreign-born population - Nigeria (%)
Place of birth for the foreign-born population - Senegal (%)
Place of birth for the foreign-born population - Sierra Leone (%)
Place of birth for the foreign-born population - Other Western Africa (%)
Place of birth for the foreign-born population - Australia (%)
Place of birth for the foreign-born population - New Zealand (%)
Place of birth for the foreign-born population - Fiji (%)
Place of birth for the foreign-born population - Micronesia (%)
Place of birth for the foreign-born population - Bahamas (%)
Place of birth for the foreign-born population - Barbados (%)
Place of birth for the foreign-born population - Cuba (%)
Place of birth for the foreign-born population - Dominica (%)
Place of birth for the foreign-born population - Dominican Republic (%)
Place of birth for the foreign-born population - Grenada (%)
Place of birth for the foreign-born population - Haiti (%)
Place of birth for the foreign-born population - Jamaica (%)
Place of birth for the foreign-born population - St. Vincent and the Grenadines (%)
Place of birth for the foreign-born population - Trinidad and Tobago (%)
Place of birth for the foreign-born population - West Indies (%)
Place of birth for the foreign-born population - Other Caribbean (%)
Place of birth for the foreign-born population - Belize (%)
Place of birth for the foreign-born population - Costa Rica (%)
Place of birth for the foreign-born population - El Salvador (%)
Place of birth for the foreign-born population - Guatemala (%)
Place of birth for the foreign-born population - Honduras (%)
Place of birth for the foreign-born population - Mexico (%)
Place of birth for the foreign-born population - Nicaragua (%)
Place of birth for the foreign-born population - Panama (%)
Place of birth for the foreign-born population - Other Central America (%)
Place of birth for the foreign-born population - Argentina (%)
Place of birth for the foreign-born population - Bolivia (%)
Place of birth for the foreign-born population - Brazil (%)
Place of birth for the foreign-born population - Chile (%)
Place of birth for the foreign-born population - Colombia (%)
Place of birth for the foreign-born population - Ecuador (%)
Place of birth for the foreign-born population - Guyana (%)
Place of birth for the foreign-born population - Peru (%)
Place of birth for the foreign-born population - Uruguay (%)
Place of birth for the foreign-born population - Venezuela (%)
Place of birth for the foreign-born population - Other South America (%)
Place of birth for the foreign-born population - Canada (%)
Place of birth for the foreign-born population - Other Northern America (%)
Place of birth for the foreign-born population - Other (%)
Latest news about races in Indianapolis, IN collected exclusively by city-data.com from local newspapers, TV, and radio stations
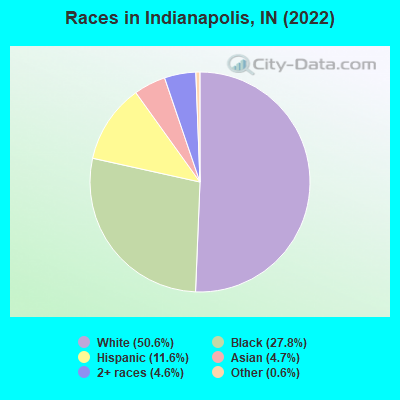
According to 2022 data, the most numerous races in Indianapolis, IN are White alone (443,207 residents), Black alone (244,023 residents), and Hispanic (102,075 residents). 82.7% of Indianapolis residents speak English at home. 11.3% of Indianapolis, IN residents are foreign-born (4.6% born in Latin America, 3.1% born in Asia, 2.0% born in Africa), which is 47.0% greater than the foreign-born rate of 6.0% across the entire state of Indiana.
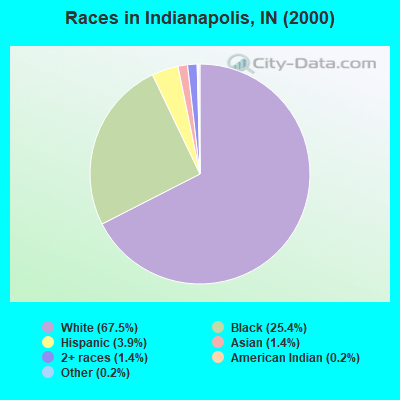
Race distribution in Indianapolis
2000 2022
527,675 67.5% White alone 198,252 25.4% Black alone 30,636 3.9% Hispanic 10,808 1.4% Two or more races 11,046 1.4% Asian alone 1,537 0.2% Other race alone 1,648 0.2% American Indian alone 268 0.03% Native Hawaiian and Other
443,207 50.6% White alone 244,023 27.8% Black alone 102,075 11.6% Hispanic 40,761 4.7% Asian alone 40,207 4.6% Two or more races 5,582 0.6% Other race alone 446 0.05% American Indian alone 263 0.03% Native Hawaiian and Other
2000 2022
5,219,373 85.8% White alone 505,462 8.3% Black alone 214,536 3.5% Hispanic 61,115 1.0% Two or more races 58,424 1.0% Asian alone 13,654 0.2% American Indian alone 6,348 0.1% Other race alone 1,573 0.03% Native Hawaiian and Other
5,192,455 76.0% White alone 628,054 9.2% Black alone 534,528 7.8% Hispanic 263,242 3.9% Two or more races 172,880 2.5% Asian alone 33,467 0.5% Other race alone 5,866 0.09% American Indian alone 2,545 0.04% Native Hawaiian and Other
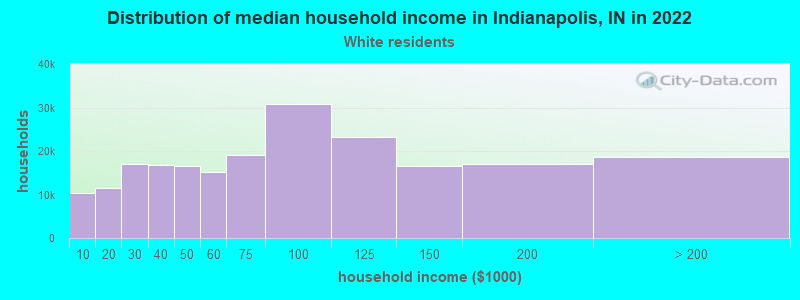
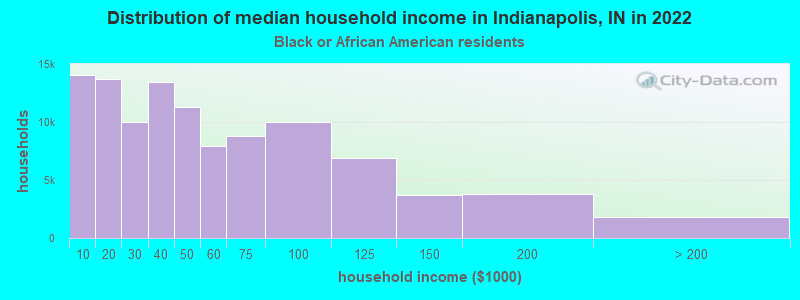
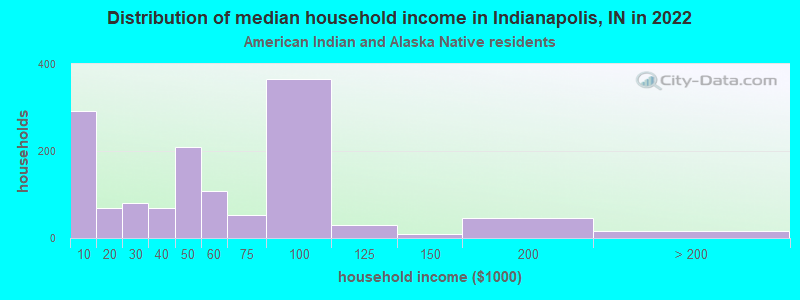
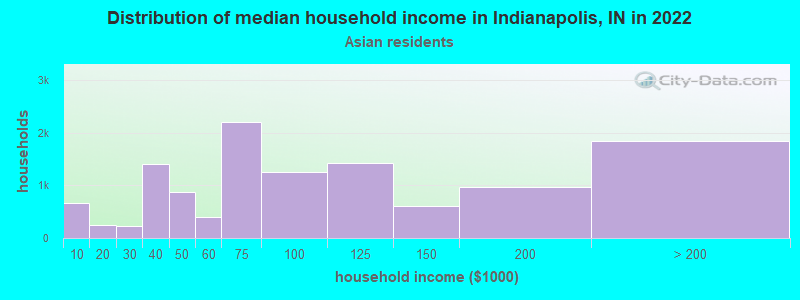
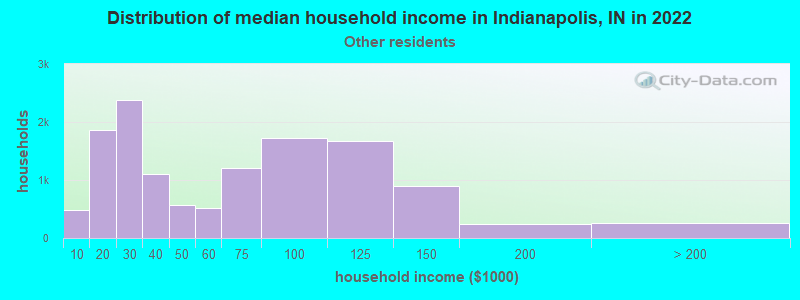
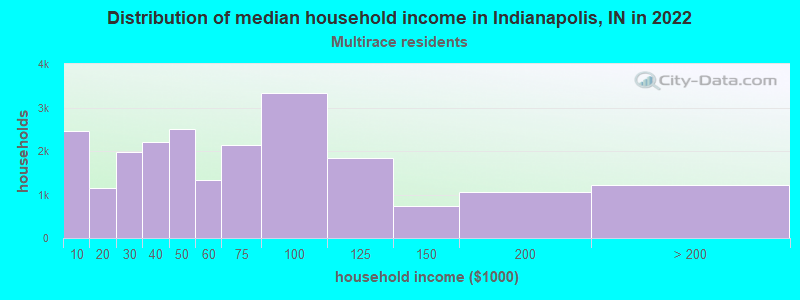
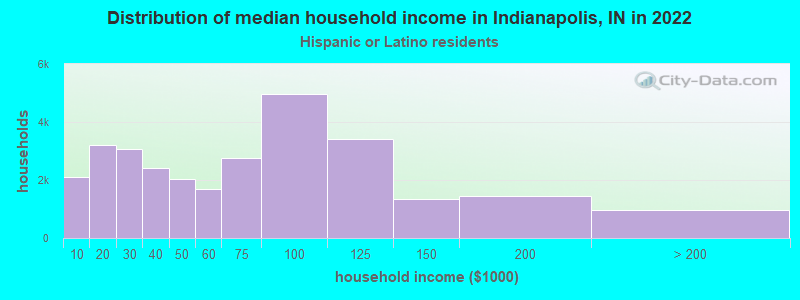
Income and house value in Indianapolis Median household income in 2022 $74,855 White non-Hispanic householders$41,318 Black householders$81,622 American Indian and Alaska Native householders$78,679 Asian householders$51,479 Some other race householders$54,649 Two or more races householders$61,146 Hispanic or Latino race householdersMedian 2022 house value $231,056 White Non-Hispanic householders$166,899 Black or African American householders$216,475 American Indian or Alaska Native householders $255,508 Asian householders$247,657 Native Hawaiian and other Pacific Islander householders$181,031 Some other race householders$199,875 Two or more races householders$189,332 Hispanic or Latino householders
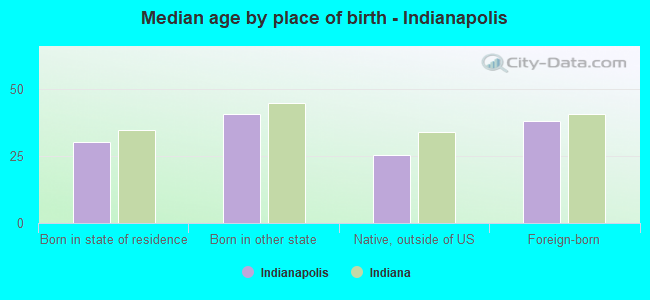
Median age by race in Indianapolis
39.0 Median age for White residents38.1 39.9 33.1 Median age for Black or African American residents30.7 34.5 24.7 Median age for American Indian / Alaska Native residents36.7 22.4 30.5 Median age for Asian residents30.9 29.6 -666,666,666.0 Median age for Native Hawaiian / Pacific Islander residents-666,666,666.0 -666,666,666.0 26.4 Median age for Other race residents25.7 26.8 24.0 Median age for Two or more races residents21.2 25.7 39.9 Median age for White alone residents39.0 40.8 24.3 Median age for Hispanic or Latino residents24.5 23.9
Owner/renter occupied households by race in Indianapolis
House owners and renters - White residents 140,279 66.0% Owner occupied72,182 34.0% Renter occupiedHouse owners and renters - Black or African American residents 40,849 38.7% Owner occupied64,675 61.3% Renter occupiedHouse owners and renters - American Indian / Alaska Native residents 1,292 72.5% Owner occupied490 27.5% Renter occupiedHouse owners and renters - Asian residents 8,086 66.5% Owner occupied4,072 33.5% Renter occupiedHouse owners and renters - Native Hawaiian / Pacific Islander residents 51 52.3% Owner occupied47 47.7% Renter occupiedHouse owners and renters - Other race residents 6,537 50.7% Owner occupied6,368 49.3% Renter occupiedHouse owners and renters - Two or more races residents 10,893 49.6% Owner occupied11,087 50.4% Renter occupiedHouse owners and renters - White alone residents 137,850 66.3% Owner occupied70,105 33.7% Renter occupiedHouse owners and renters - Hispanic or Latino residents 14,393 49.0% Owner occupied14,976 51.0% Renter occupied
Language usage in Indianapolis
English speakers - Total 82.7% of residents of Indianapolis speak English at home.
9.0% of residents speak Spanish at home 37,102 50.5% Speak English very well36,407 49.5% Speak English less than very well8.3% of residents speak other language at home 38,845 57.2% Speak English very well29,011 42.8% Speak English less than very well
English speakers - Born in the United States 92.2% of residents of Indianapolis speak English at home.
5.5% of residents speak Spanish at home 8,679 78.5% Speak English very well2,371 21.5% Speak English less than very well2.3% of residents speak other language at home 4,311 92.9% Speak English very well328 7.1% Speak English less than very well
English speakers - Native, born elsewhere 60.4% of residents of Indianapolis speak English at home.
29.0% of residents speak Spanish at home 1,383 52.1% Speak English very well1,271 47.9% Speak English less than very well10.7% of residents speak other language at home 814 83.4% Speak English very well162 16.6% Speak English less than very well
English speakers - Foreign-born 15.5% of residents of Indianapolis speak English at home.
35.8% of residents speak Spanish at home 9,148 24.2% Speak English very well28,596 75.8% Speak English less than very well48.7% of residents speak other language at home 24,450 47.6% Speak English very well26,943 52.4% Speak English less than very well
White (Caucasian) - Speak only English Native:
96.8% (412,755)Foreign-born:
35.3% (3,312)
White (Caucasian) - Speak another language Native:
3.2% (13,513)Foreign-born:
64.7% (6,072)
Black or African American - Speak only English Native:
97.1% (188,782)Foreign-born:
17.0% (5,720)
Black or African American - Speak another language Native:
2.9% (5,624)Foreign-born:
83.0% (27,848)
American Indian / Alaska Native - Speak only English Native:
32.3% (1,169)Foreign-born:
8.4% (166)
American Indian / Alaska Native - Speak another language Native:
67.7% (2,448)Foreign-born:
91.6% (1,808)
Asian - Speak only English Native:
39.9% (5,053)Foreign-born:
14.8% (3,663)
Asian - Speak another language Native:
60.1% (7,598)Foreign-born:
85.2% (21,041)
Other race - Speak only English Native:
43.5% (8,880)Foreign-born:
8.3% (1,846)
Other race - Speak another language Native:
56.5% (11,532)Foreign-born:
91.7% (20,428)
Two or more races - Speak only English Native:
77.8% (40,249)Foreign-born:
12.0% (1,621)
Two or more races - Speak another language Native:
22.2% (11,513)Foreign-born:
88.0% (11,940)
White alone - Speak only English Native:
98.3% (407,720)Foreign-born:
44.3% (3,189)
White alone - Speak another language Native:
1.7% (7,147)Foreign-born:
55.7% (4,006)
Hispanic or Latino - Speak only English Native:
41.2% (20,646)Foreign-born:
6.9% (2,765)
Hispanic or Latino - Speak another language Native:
58.8% (29,490)Foreign-born:
93.1% (37,563)
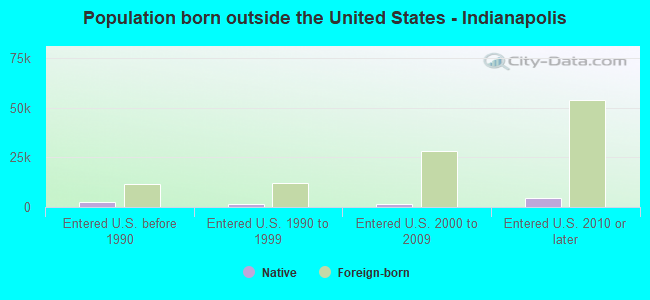
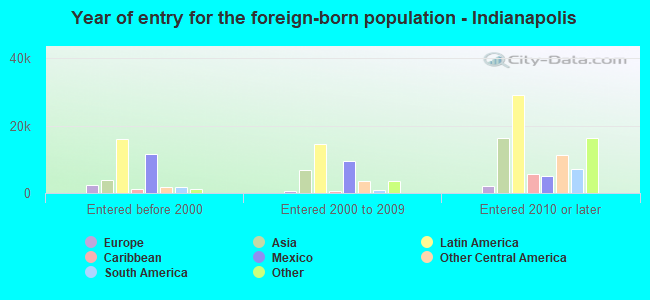
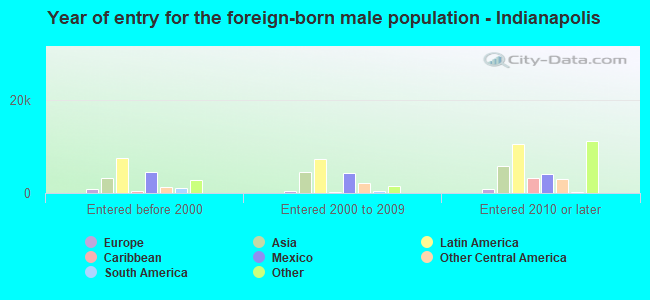
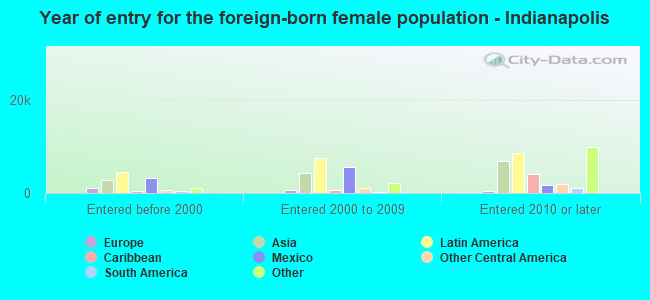
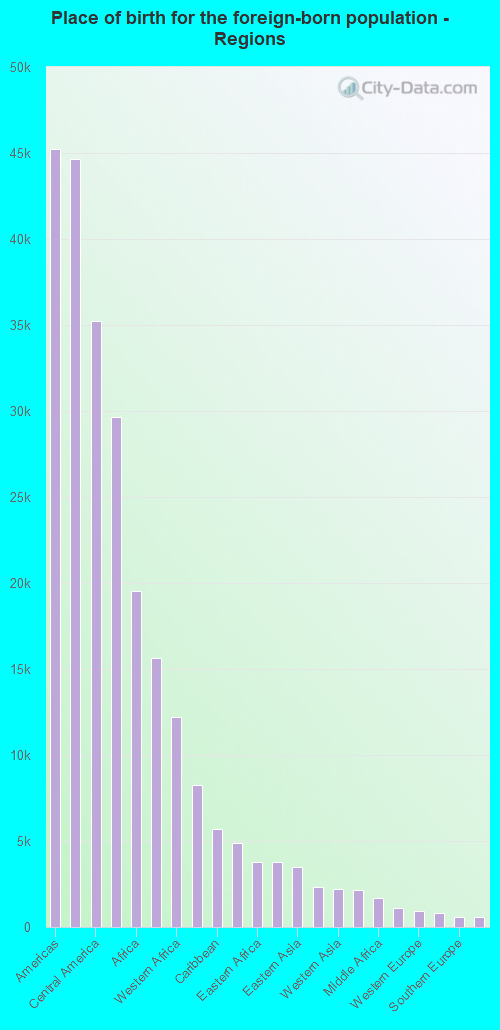
Foreign-born residents in Indianapolis 99,612 residents are foreign born (4.6% Latin America , 3.1% Asia , 2.0% Africa ).
This city:
11.3%Indiana:
5.6%
Marital status for residents in Indianapolis Marital status - White (Caucasian) population 15 years and over
Males 37.8% Never married47.8% Now married0.7% Separated2.5% Widowed11.1% DivorcedFemales 32.3% Never married46.1% Now married1.0% Separated7.9% Widowed12.7% DivorcedWomen who gave birth in the past 12 months Now married:
63.5% (3,164)Unmarried:
36.5% (1,822)
Women who did not give birth in the past 12 months Now married:
42.5% (45,737)Unmarried:
57.5% (61,830)
Marital status - Black or African American population 15 years and over
Males 46.7% Never married34.1% Now married3.0% Separated4.3% Widowed11.9% DivorcedFemales 45.5% Never married26.6% Now married3.2% Separated6.9% Widowed17.8% DivorcedWomen who gave birth in the past 12 months Now married:
48.3% (2,804)Unmarried:
51.7% (3,003)
Women who did not give birth in the past 12 months Now married:
23.9% (14,420)Unmarried:
76.1% (45,910)
Marital status - American Indian / Alaska Native population 15 years and over
Males 44.2% Never married38.3% Now married5.0% Separated7.4% Widowed5.1% DivorcedFemales 49.9% Never married38.2% Now married1.6% Separated6.5% Widowed3.8% DivorcedWomen who gave birth in the past 12 months Now married:
100.0% (14)Unmarried:
0.0% (0)
Women who did not give birth in the past 12 months Now married:
41.3% (821)Unmarried:
58.7% (1,165)
Marital status - Asian population 15 years and over
Males 32.0% Never married63.0% Now married0.6% Separated0.0% Widowed4.5% DivorcedFemales 24.3% Never married64.2% Now married1.7% Separated4.3% Widowed5.6% DivorcedWomen who gave birth in the past 12 months Now married:
100.0% (1,126)Unmarried:
0.0% (0)
Women who did not give birth in the past 12 months Now married:
61.0% (6,160)Unmarried:
39.0% (3,941)
Marital status - Native Hawaiian / Pacific Islander population 15 years and over
Males 68.0% Never married17.0% Now married0.0% Separated15.0% Widowed0.0% DivorcedFemales 0.0% Never married0.0% Now married0.0% Separated100.0% Widowed0.0% DivorcedMarital status - Other race population 15 years and over
Males 39.1% Never married52.7% Now married1.6% Separated0.0% Widowed6.7% DivorcedFemales 33.9% Never married49.1% Now married4.0% Separated1.5% Widowed11.4% DivorcedWomen who gave birth in the past 12 months Now married:
60.5% (1,210)Unmarried:
39.5% (790)
Women who did not give birth in the past 12 months Now married:
48.4% (4,698)Unmarried:
51.6% (5,017)
Marital status - Two or more races population 15 years and over
Males 54.6% Never married31.5% Now married1.2% Separated4.3% Widowed8.4% DivorcedFemales 49.0% Never married33.4% Now married4.1% Separated1.7% Widowed11.8% DivorcedWomen who gave birth in the past 12 months Now married:
56.7% (282)Unmarried:
43.3% (215)
Women who did not give birth in the past 12 months Now married:
37.2% (6,740)Unmarried:
62.8% (11,372)
Marital status - White alone, not Hispanic / Latino population 15 years and over
Males 37.3% Never married48.2% Now married0.7% Separated2.6% Widowed11.3% DivorcedFemales 31.8% Never married46.3% Now married1.0% Separated8.1% Widowed12.8% DivorcedWomen who gave birth in the past 12 months Now married:
65.2% (3,089)Unmarried:
34.8% (1,646)
Women who did not give birth in the past 12 months Now married:
42.6% (43,737)Unmarried:
57.4% (59,032)
Marital status - Hispanic or Latino population 15 years and over
Males 45.8% Never married44.3% Now married1.5% Separated2.4% Widowed6.1% DivorcedFemales 45.4% Never married42.1% Now married2.3% Separated1.1% Widowed9.1% DivorcedWomen who gave birth in the past 12 months Now married:
52.2% (1,288)Unmarried:
47.8% (1,181)
Women who did not give birth in the past 12 months Now married:
42.1% (10,170)Unmarried:
57.9% (14,009)
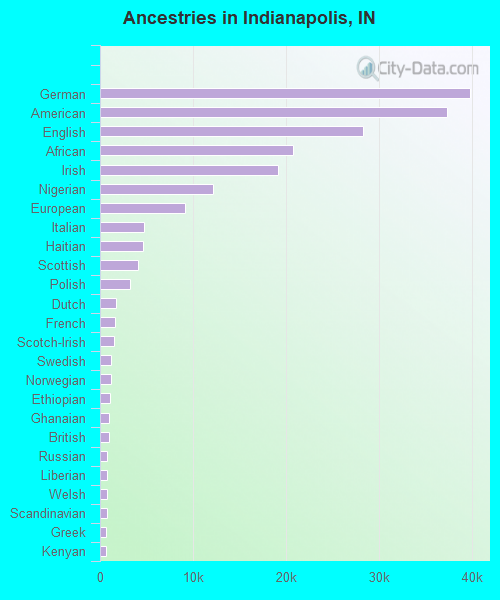
Ancestries in Indianapolis
39,864 8.7% German37,384 8.2% American28,266 6.2% English20,778 4.5% African19,129 4.2% Irish12,137 2.7% Nigerian9,178 2.0% European4,768 1.0% Italian4,588 1.0% Haitian4,067 0.9% Scottish3,227 0.7% Polish1,704 0.4% Dutch1,653 0.4% French1,510 0.3% Scotch-Irish1,228 0.3% Swedish1,135 0.2% Norwegian1,075 0.2% Ethiopian1,016 0.2% Ghanaian1,007 0.2% British775 0.2% Russian761 0.2% Liberian719 0.2% Welsh707 0.2% Scandinavian681 0.1% Greek679 0.1% Kenyan636 0.1% Northern European583 0.1% Eastern European560 0.1% French Canadian529 0.1% Iranian460 0.1% Lebanese445 0.10% Jamaican430 0.09% Romanian414 0.09% Ukrainian413 0.09% Senegalese376 0.08% Serbian357 0.08% Danish337 0.07% Hungarian329 0.07% Swiss283 0.06% Latvian255 0.06% Brazilian224 0.05% Portuguese221 0.05% Syrian215 0.05% Jordanian215 0.05% Canadian212 0.05% Iraqi208 0.05% Sudanese198 0.04% Czech189 0.04% Yugoslavian189 0.04% Belgian186 0.04% Barbadian180 0.04% Slovak175 0.04% Slovene172 0.04% Croatian160 0.04% Afghan160 0.04% Israeli159 0.03% Somali150 0.03% Austrian137 0.03% South African125 0.03% Lithuanian116 0.03% Macedonian102 0.02% Egyptian99 0.02% Slavic99 0.02% West Indian97 0.02% Turkish91 0.02% Palestinian91 0.02% Pennsylvania German74 0.02% Arab69 0.02% Armenian58 0.01% Zimbabwean55 0.01% Czechoslovakian53 0.01% Moroccan43 0.01% Guyanese38 0.01% Cypriot38 0.01% Finnish37 0.01% Luxembourger35 0.01% Ugandan34 0.01% Bulgarian32 0.01% Australian29 0.01% Basque27 0.01% Estonian25 0.01% Sierra Leonean25 0.01% U.S. Virgin Islander23 0.01% Belizean
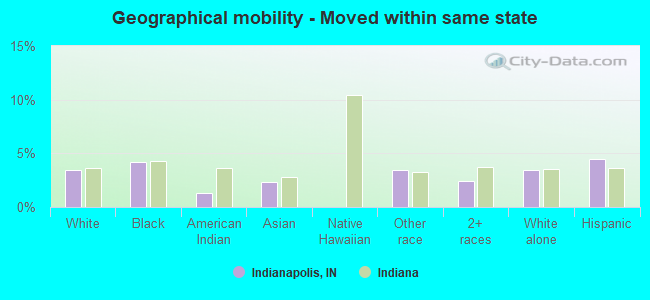
Geographical mobility in Indianapolis Same house 1 year ago 390,669 86.0% White (Caucasian)198,370 81.3% Black or African American3,750 87.1% American Indian / Alaska Native32,800 82.0% Asian119 100.0% Native Hawaiian / Pacific Islander41,219 86.7% Other race60,738 83.8% Two or more races376,958 86.0% White alone, not Hispanic / Latino83,043 83.1% Hispanic or LatinoMoved within same county 34,321 7.6% White / Caucasian28,400 11.6% Black or African American378 8.8% American Indian / Alaska Native3,049 7.6% Asian2,983 6.3% Other race6,866 9.5% Two or more races32,570 7.4% White alone, not Hispanic / Latino8,526 8.5% Hispanic or LatinoMoved within same state 15,668 3.4% White / Caucasian10,158 4.2% Black or African American56 1.3% American Indian / Alaska Native923 2.3% Asian1,659 3.5% Other race1,753 2.4% Two or more races15,200 3.5% White alone, not Hispanic / Latino4,466 4.5% Hispanic or LatinoMoved from different state 11,964 2.6% White / Caucasian6,447 2.6% Black or African American40 0.9% American Indian / Alaska Native1,128 2.8% Asian1,094 2.3% Other race1,998 2.8% Two or more races11,772 2.7% White alone, not Hispanic / Latino2,099 2.1% Hispanic or LatinoMoved from abroad 1,867 0.4% White668 0.3% Black or African American2,082 5.2% Asian567 1.2% Other race1,112 1.5% Two or more races1,824 0.4% White alone, not Hispanic / Latino1,838 1.8% Hispanic or Latino
Children Nativity (place of birth) in Indianapolis
Children under 6 years - Living with two parents Both parents native 26,900 100.0% NativeBoth parents foreign-born 12,043 94.3% Native727 5.7% Foreign-bornOne native, one foreign-born parent 4,446 96.5% Native161 3.5% Foreign-bornChildren under 6 years - Living with one parent Native parent 25,135 99.2% Native197 0.8% Foreign-bornForeign-born parent 1,983 89.7% Native228 10.3% Foreign-bornChildren 6 to 17 years - Living with two parents Both parents native 48,863 99.6% Native190 0.4% Foreign-bornBoth parents foreign-born 14,731 70.5% Native6,161 29.5% Foreign-bornOne native, one foreign-born parent 5,868 94.3% Native352 5.7% Foreign-bornChildren 6 to 17 years - Living with one parent Native parent 42,792 100.0% NativeForeign-born parent 8,848 62.0% Native5,431 38.0% Foreign-born
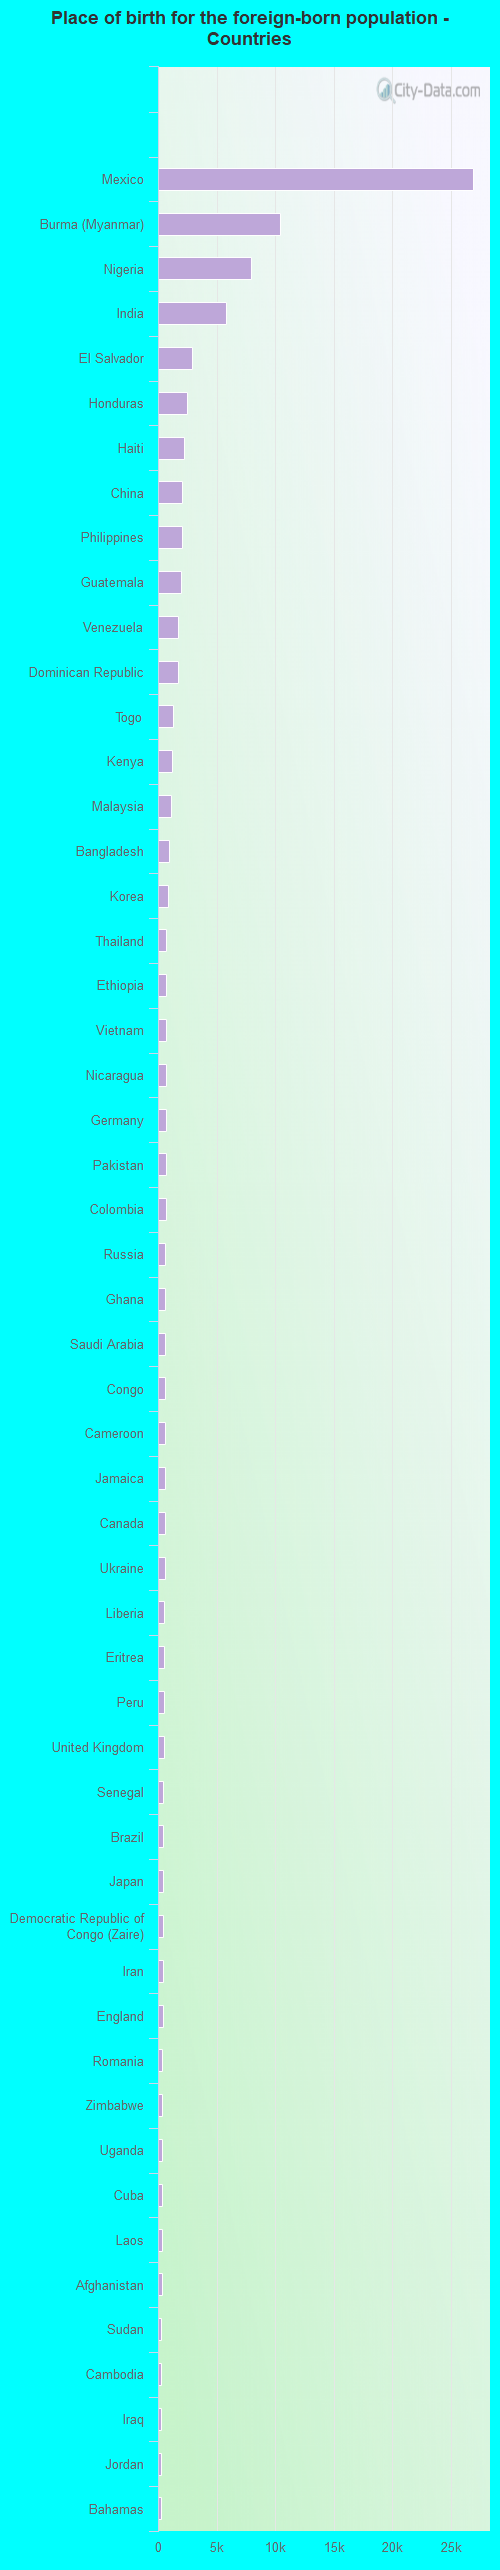
Place of birth for residents in Indianapolis 45,219 Americas44,660 Latin America35,217 Central America29,666 Asia19,549 Africa15,636 South Eastern Asia12,230 Western Africa8,240 South Central Asia5,673 Caribbean4,886 Europe3,770 Eastern Africa3,768 South America3,480 Eastern Asia2,309 Eastern Europe2,207 Western Asia2,172 China1,701 Middle Africa1,103 Northern Europe910 Western Europe807 Northern Africa562 Southern Europe559 Northern America289 Oceania243 Australia and New Zealand Subregion214 Southern Africa26,923 Mexico10,416 Burma (Myanmar)7,964 Nigeria5,789 India2,917 El Salvador2,487 Honduras2,238 Haiti2,012 China2,008 Philippines1,951 Guatemala1,731 Venezuela1,696 Dominican Republic1,286 Togo1,203 Kenya1,150 Malaysia929 Bangladesh869 Korea718 Thailand706 Ethiopia704 Vietnam700 Nicaragua676 Germany674 Pakistan644 Colombia610 Russia605 Ghana605 Saudi Arabia588 Congo570 Cameroon564 Jamaica559 Canada556 Ukraine538 Liberia533 Eritrea492 Peru477 United Kingdom462 Senegal445 Brazil437 Japan436 Democratic Republic of Congo (Zaire)402 Iran397 England379 Romania360 Zimbabwe333 Uganda331 Cuba326 Laos300 Afghanistan287 Sudan262 Cambodia257 Iraq255 Jordan252 Bahamas241 United Arab Emirates235 Lebanon216 Barbados195 Egypt191 Algeria186 Sierra Leone174 Chile173 Syria173 Italy160 Bosnia and Herzegovina149 Spain145 Tanzania144 Greece141 Turkey137 Poland127 Panama122 Australia120 New Zealand119 Ecuador115 Morocco114 Israel114 Trinidad and Tobago99 St. Vincent and the Grenadines99 Netherlands95 Portugal89 South Africa87 Taiwan84 Somalia76 France72 Hong Kong72 Costa Rica71 Ireland62 Bulgaria61 St. Lucia58 Norway57 Latvia55 Ivory Coast54 Scotland53 Serbia52 Guyana47 West Indies47 Sri Lanka43 Austria43 Moldova42 Belarus41 Uruguay40 Yemen40 Bolivia37 Belize30 Singapore27 Denmark26 Dominica26 Croatia25 Argentina24 Hungary21 Nepal18 Kuwait18 Indonesia15 Lithuania15 North Macedonia (Macedonia)14 Azerbaijan14 Kazakhstan13 Uzbekistan13 Belgium9 Sweden7 Albania5 Czechoslovakia
Grandparents responsible for own grandchildren in Indianapolis
Grandparents (30 to 59 years) White / Caucasian 1,078 45.0% Responsible for grandchildren1,318 55.0% Not responsible for grandchildrenBlack or African American 1,256 60.4% Responsible for grandchildren823 39.6% Not responsible for grandchildrenAmerican Indian / Alaska Native 10 100.0% Responsible for grandchildrenAsian 105 9.3% Responsible for grandchildren1,029 90.7% Not responsible for grandchildrenOther race 242 23.6% Responsible for grandchildren781 76.4% Not responsible for grandchildrenTwo or more races 738 74.7% Responsible for grandchildren249 25.3% Not responsible for grandchildrenWhite alone, not Hispanic / Latino 1,078 45.0% Responsible for grandchildren1,318 55.0% Not responsible for grandchildrenHispanic or Latino 762 52.7% Responsible for grandchildren684 47.3% Not responsible for grandchildrenGrandparents (60 years and over) White / Caucasian 970 30.3% Responsible for grandchildren2,231 69.7% Not responsible for grandchildrenBlack or African American 1,228 35.5% Responsible for grandchildren2,232 64.5% Not responsible for grandchildrenAmerican Indian / Alaska Native 9 14.6% Responsible for grandchildren51 85.4% Not responsible for grandchildrenAsian 105 16.4% Responsible for grandchildren534 83.6% Not responsible for grandchildrenOther race 45 12.1% Responsible for grandchildren325 87.9% Not responsible for grandchildrenTwo or more races 96 23.4% Responsible for grandchildren314 76.6% Not responsible for grandchildrenWhite alone, not Hispanic / Latino 970 30.8% Responsible for grandchildren2,183 69.2% Not responsible for grandchildrenHispanic or Latino 470 100.0% Not responsible for grandchildren
Zip codes: 46113 , 46183 , 46201 , 46202 , 46204 , 46205 , 46208 , 46214 , 46217 , 46218 , 46219 , 46220 , 46221 , 46222 , 46224 , 46225 , 46226 , 46235 , 46236 , 46239 , 46241 , 46254 , 46259 , 46268 , 46278 .