Races in Jefferson, Louisiana (LA) Detailed Stats
Data:
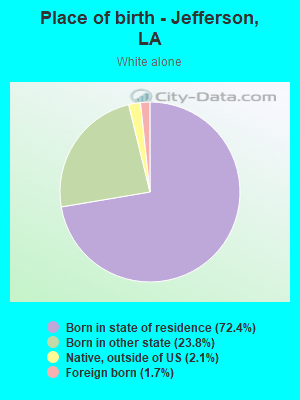
Races - White alone (%)
Races - White alone (% change since 2000)
Races - Black alone (%)
Races - Black alone (% change since 2000)
Races - American Indian alone (%)
Races - American Indian alone (% change since 2000)
Races - Asian alone (%)
Races - Asian alone (% change since 2000)
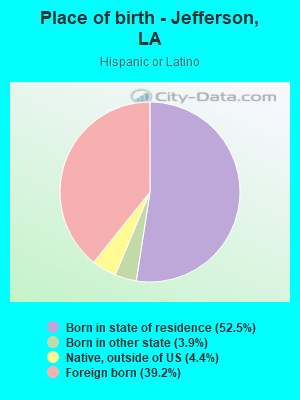
Races - Hispanic (%)
Races - Hispanic (% change since 2000)
Races - Native Hawaiian and Other Pacific Islander alone (%)
Races - Native Hawaiian and Other Pacific Islander alone (% change since 2000)
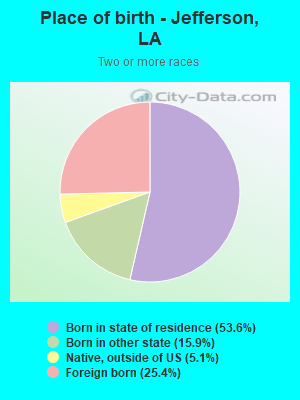
Races - Two or more races(%)
Races - Two or more races(% change since 2000)
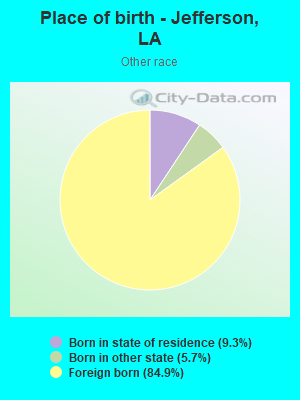
Races - Other race alone (%)
Races - Other race alone (% change since 2000)
Racial diversity
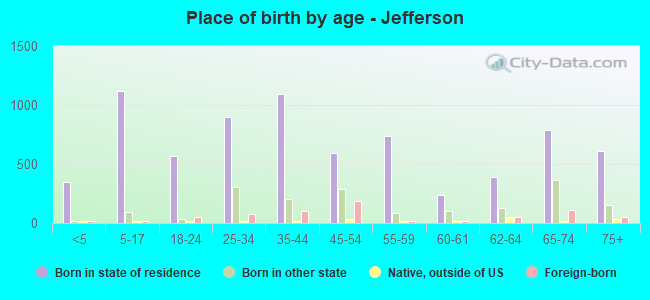
Place of birth - Born in state of residence (%)
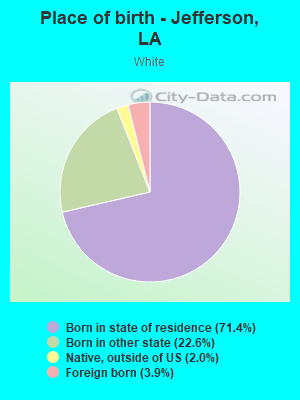
Place of birth - Born in state of residence (%) - White
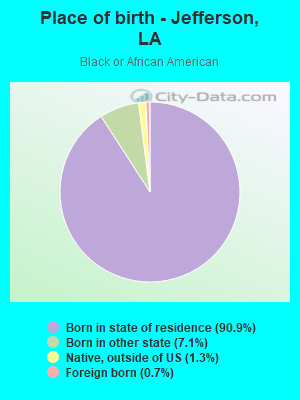
Place of birth - Born in state of residence (%) - Black or African American
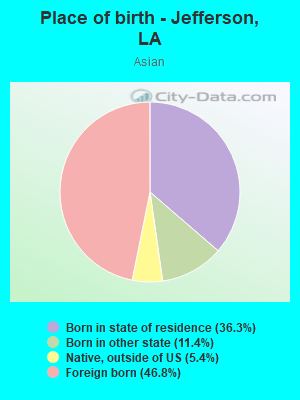
Place of birth - Born in state of residence (%) - Asian
Place of birth - Born in state of residence (%) - Hispanic or Latino
Place of birth - Born in state of residence (%) - American Indian and Alaska Native
Place of birth - Born in state of residence (%) - Multirace
Place of birth - Born in state of residence (%) - Other Race
Place of birth - Born in other state (%)
Place of birth - Born in other state (%) - White
Place of birth - Born in other state (%) - Black or African American
Place of birth - Born in other state (%) - Asian
Place of birth - Born in other state (%) - Hispanic or Latino
Place of birth - Born in other state (%) - American Indian and Alaska Native
Place of birth - Born in other state (%) - Multirace
Place of birth - Born in other state (%) - Other Race
Place of birth - Native, outside of US (%)
Place of birth - Native, outside of US (%) - White
Place of birth - Native, outside of US (%) - Black or African American
Place of birth - Native, outside of US (%) - Asian
Place of birth - Native, outside of US (%) - Hispanic or Latino
Place of birth - Native, outside of US (%) - American Indian and Alaska Native
Place of birth - Native, outside of US (%) - Multirace
Place of birth - Native, outside of US (%) - Other Race
Place of birth - Foreign born (%)
Place of birth - Foreign born (%) - White
Place of birth - Foreign born (%) - Black or African American
Place of birth - Foreign born (%) - Asian
Place of birth - Foreign born (%) - Hispanic or Latino
Place of birth - Foreign born (%) - American Indian and Alaska Native
Place of birth - Foreign born (%) - Multirace
Place of birth - Foreign born (%) - Other Race
Residents speaking English at home (%)
Residents speaking English at home - Born in the United States (%)
Residents speaking English at home - Native, born elsewhere (%)
Residents speaking English at home - Foreign born (%)
Residents speaking Spanish at home (%)
Residents speaking Spanish at home - Born in the United States (%)
Residents speaking Spanish at home - Native, born elsewhere (%)
Residents speaking Spanish at home - Foreign born (%)
Residents speaking other language at home (%)
Residents speaking other language at home - Born in the United States (%)
Residents speaking other language at home - Native, born elsewhere (%)
Residents speaking other language at home - Foreign born (%)
Marital status - Never married (%)
Marital status - Now married (%)
Marital status - Separated (%)
Marital status - Widowed (%)
Marital status - Divorced (%)
Ancestries Reported - Arab (%)
Ancestries Reported - Czech (%)
Ancestries Reported - Danish (%)
Ancestries Reported - Dutch (%)
Ancestries Reported - English (%)
Ancestries Reported - French (%)
Ancestries Reported - French Canadian (%)
Ancestries Reported - German (%)
Ancestries Reported - Greek (%)
Ancestries Reported - Hungarian (%)
Ancestries Reported - Irish (%)
Ancestries Reported - Italian (%)
Ancestries Reported - Lithuanian (%)
Ancestries Reported - Norwegian (%)
Ancestries Reported - Polish (%)
Ancestries Reported - Portuguese (%)
Ancestries Reported - Russian (%)
Ancestries Reported - Scotch-Irish (%)
Ancestries Reported - Scottish (%)
Ancestries Reported - Slovak (%)
Ancestries Reported - Subsaharan African (%)
Ancestries Reported - Swedish (%)
Ancestries Reported - Swiss (%)
Ancestries Reported - Ukrainian (%)
Ancestries Reported - United States (%)
Ancestries Reported - Welsh (%)
Ancestries Reported - West Indian (%)
Ancestries Reported - Other (%)
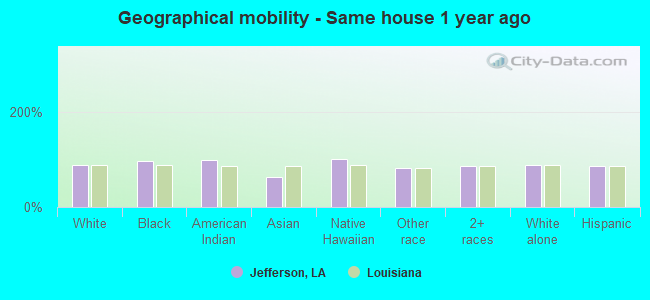
Geographical mobility - Same house 1 year ago (%)
Geographical mobility - Same house 1 year ago (%) - White
Geographical mobility - Same house 1 year ago (%) - Black or African American
Geographical mobility - Same house 1 year ago (%) - Asian
Geographical mobility - Same house 1 year ago (%) - Hispanic or Latino
Geographical mobility - Same house 1 year ago (%) - American Indian and Alaska Native
Geographical mobility - Same house 1 year ago (%) - Multirace
Geographical mobility - Same house 1 year ago (%) - Other Race
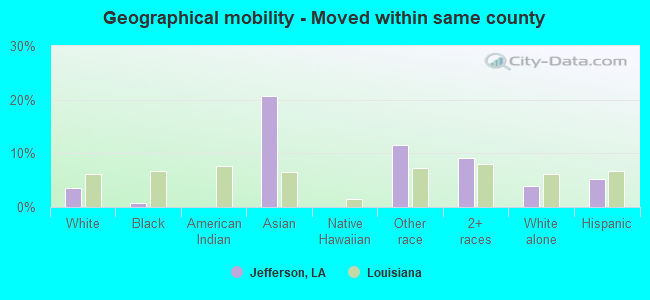
Geographical mobility - Moved within same county (%)
Geographical mobility - Moved within same county (%) - White
Geographical mobility - Moved within same county (%) - Black or African American
Geographical mobility - Moved within same county (%) - Asian
Geographical mobility - Moved within same county (%) - Hispanic or Latino
Geographical mobility - Moved within same county (%) - American Indian and Alaska Native
Geographical mobility - Moved within same county (%) - Multirace
Geographical mobility - Moved within same county (%) - Other Race
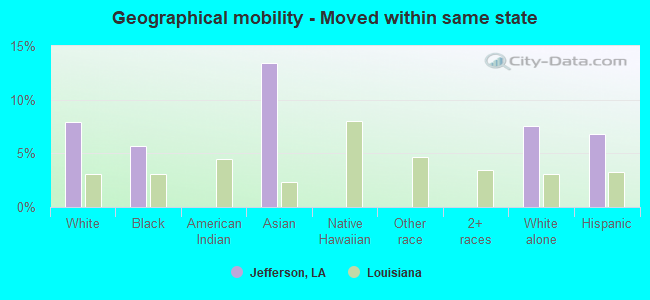
Geographical mobility - Moved from different county within same state (%)
Geographical mobility - Moved from different county within same state (%) - White
Geographical mobility - Moved from different county within same state (%) - Black or African American
Geographical mobility - Moved from different county within same state (%) - Asian
Geographical mobility - Moved from different county within same state (%) - Hispanic or Latino
Geographical mobility - Moved from different county within same state (%) - American Indian and Alaska Native
Geographical mobility - Moved from different county within same state (%) - Multirace
Geographical mobility - Moved from different county within same state (%) - Other Race
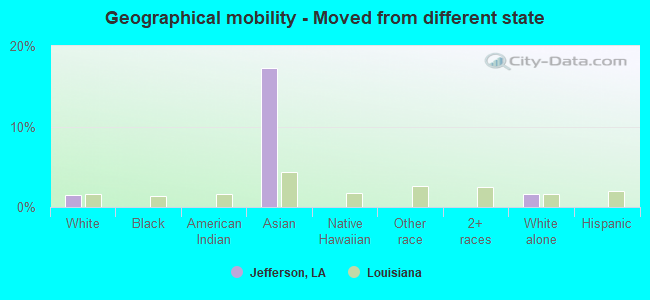
Geographical mobility - Moved from different state (%)
Geographical mobility - Moved from different state (%) - White
Geographical mobility - Moved from different state (%) - Black or African American
Geographical mobility - Moved from different state (%) - Asian
Geographical mobility - Moved from different state (%) - Hispanic or Latino
Geographical mobility - Moved from different state (%) - American Indian and Alaska Native
Geographical mobility - Moved from different state (%) - Multirace
Geographical mobility - Moved from different state (%) - Other Race
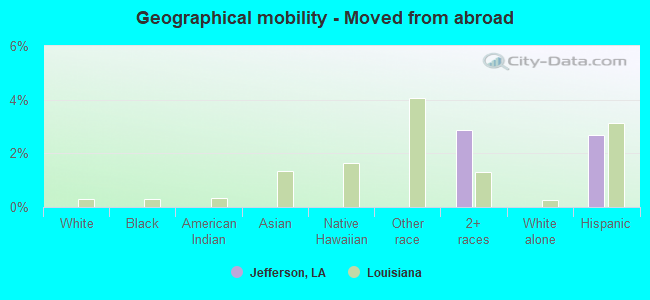
Geographical mobility - Moved from abroad (%)
Geographical mobility - Moved from abroad (%) - White
Geographical mobility - Moved from abroad (%) - Black or African American
Geographical mobility - Moved from abroad (%) - Asian
Geographical mobility - Moved from abroad (%) - Hispanic or Latino
Geographical mobility - Moved from abroad (%) - American Indian and Alaska Native
Geographical mobility - Moved from abroad (%) - Multirace
Geographical mobility - Moved from abroad (%) - Other Race
Place of birth for the foreign-born population - Ireland (%)
Place of birth for the foreign-born population - Denmark (%)
Place of birth for the foreign-born population - Norway (%)
Place of birth for the foreign-born population - Sweden (%)
Place of birth for the foreign-born population - United Kingdom (%)
Place of birth for the foreign-born population - England (%)
Place of birth for the foreign-born population - Scotland (%)
Place of birth for the foreign-born population - Other Northern Europe (%)
Place of birth for the foreign-born population - Austria (%)
Place of birth for the foreign-born population - Belgium (%)
Place of birth for the foreign-born population - France (%)
Place of birth for the foreign-born population - Germany (%)
Place of birth for the foreign-born population - Netherlands (%)
Place of birth for the foreign-born population - Switzerland (%)
Place of birth for the foreign-born population - Other Western Europe (%)
Place of birth for the foreign-born population - Greece (%)
Place of birth for the foreign-born population - Italy (%)
Place of birth for the foreign-born population - Portugal (%)
Place of birth for the foreign-born population - Spain (%)
Place of birth for the foreign-born population - Other Southern Europe (%)
Place of birth for the foreign-born population - Albania (%)
Place of birth for the foreign-born population - Belarus (%)
Place of birth for the foreign-born population - Bosnia and Herzegovina (%)
Place of birth for the foreign-born population - Bulgaria (%)
Place of birth for the foreign-born population - Croatia (%)
Place of birth for the foreign-born population - Czechoslovakia (%)
Place of birth for the foreign-born population - Hungary (%)
Place of birth for the foreign-born population - Latvia (%)
Place of birth for the foreign-born population - Lithuania (%)
Place of birth for the foreign-born population - North Macedonia (Macedonia) (%)
Place of birth for the foreign-born population - Moldova (%)
Place of birth for the foreign-born population - Poland (%)
Place of birth for the foreign-born population - Romania (%)
Place of birth for the foreign-born population - Russia (%)
Place of birth for the foreign-born population - Serbia (%)
Place of birth for the foreign-born population - Ukraine (%)
Place of birth for the foreign-born population - Other Eastern Europe (%)
Place of birth for the foreign-born population - China (%)
Place of birth for the foreign-born population - Hong Kong (%)
Place of birth for the foreign-born population - Taiwan (%)
Place of birth for the foreign-born population - Japan (%)
Place of birth for the foreign-born population - Korea (%)
Place of birth for the foreign-born population - Other Eastern Asia (%)
Place of birth for the foreign-born population - Afghanistan (%)
Place of birth for the foreign-born population - Bangladesh (%)
Place of birth for the foreign-born population - India (%)
Place of birth for the foreign-born population - Iran (%)
Place of birth for the foreign-born population - Kazakhstan (%)
Place of birth for the foreign-born population - Nepal (%)
Place of birth for the foreign-born population - Pakistan (%)
Place of birth for the foreign-born population - Sri Lanka (%)
Place of birth for the foreign-born population - Uzbekistan (%)
Place of birth for the foreign-born population - Other South Central Asia (%)
Place of birth for the foreign-born population - Burma (%)
Place of birth for the foreign-born population - Cambodia (%)
Place of birth for the foreign-born population - Indonesia (%)
Place of birth for the foreign-born population - Laos (%)
Place of birth for the foreign-born population - Malaysia (%)
Place of birth for the foreign-born population - Philippines (%)
Place of birth for the foreign-born population - Singapore (%)
Place of birth for the foreign-born population - Thailand (%)
Place of birth for the foreign-born population - Vietnam (%)
Place of birth for the foreign-born population - Other South Eastern Asia (%)
Place of birth for the foreign-born population - Armenia (%)
Place of birth for the foreign-born population - Iraq (%)
Place of birth for the foreign-born population - Israel (%)
Place of birth for the foreign-born population - Jordan (%)
Place of birth for the foreign-born population - Kuwait (%)
Place of birth for the foreign-born population - Lebanon (%)
Place of birth for the foreign-born population - Saudi Arabia (%)
Place of birth for the foreign-born population - Syria (%)
Place of birth for the foreign-born population - Turkey (%)
Place of birth for the foreign-born population - Yemen (%)
Place of birth for the foreign-born population - Other Western Asia (%)
Place of birth for the foreign-born population - Eritrea (%)
Place of birth for the foreign-born population - Ethiopia (%)
Place of birth for the foreign-born population - Kenya (%)
Place of birth for the foreign-born population - Somalia (%)
Place of birth for the foreign-born population - Uganda (%)
Place of birth for the foreign-born population - Zimbabwe (%)
Place of birth for the foreign-born population - Other Eastern Africa (%)
Place of birth for the foreign-born population - Cameroon (%)
Place of birth for the foreign-born population - Congo (%)
Place of birth for the foreign-born population - Democratic Republic of Congo (Zaire) (%)
Place of birth for the foreign-born population - Other Middle Africa (%)
Place of birth for the foreign-born population - Egypt (%)
Place of birth for the foreign-born population - Morocco (%)
Place of birth for the foreign-born population - Sudan (%)
Place of birth for the foreign-born population - Other Northern Africa (%)
Place of birth for the foreign-born population - South Africa (%)
Place of birth for the foreign-born population - Other Southern Africa (%)
Place of birth for the foreign-born population - Cabo Verde (%)
Place of birth for the foreign-born population - Ghana (%)
Place of birth for the foreign-born population - Liberia (%)
Place of birth for the foreign-born population - Nigeria (%)
Place of birth for the foreign-born population - Senegal (%)
Place of birth for the foreign-born population - Sierra Leone (%)
Place of birth for the foreign-born population - Other Western Africa (%)
Place of birth for the foreign-born population - Australia (%)
Place of birth for the foreign-born population - New Zealand (%)
Place of birth for the foreign-born population - Fiji (%)
Place of birth for the foreign-born population - Micronesia (%)
Place of birth for the foreign-born population - Bahamas (%)
Place of birth for the foreign-born population - Barbados (%)
Place of birth for the foreign-born population - Cuba (%)
Place of birth for the foreign-born population - Dominica (%)
Place of birth for the foreign-born population - Dominican Republic (%)
Place of birth for the foreign-born population - Grenada (%)
Place of birth for the foreign-born population - Haiti (%)
Place of birth for the foreign-born population - Jamaica (%)
Place of birth for the foreign-born population - St. Vincent and the Grenadines (%)
Place of birth for the foreign-born population - Trinidad and Tobago (%)
Place of birth for the foreign-born population - West Indies (%)
Place of birth for the foreign-born population - Other Caribbean (%)
Place of birth for the foreign-born population - Belize (%)
Place of birth for the foreign-born population - Costa Rica (%)
Place of birth for the foreign-born population - El Salvador (%)
Place of birth for the foreign-born population - Guatemala (%)
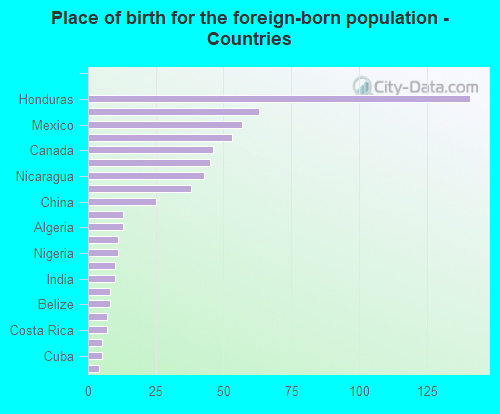
Place of birth for the foreign-born population - Honduras (%)
Place of birth for the foreign-born population - Mexico (%)
Place of birth for the foreign-born population - Nicaragua (%)
Place of birth for the foreign-born population - Panama (%)
Place of birth for the foreign-born population - Other Central America (%)
Place of birth for the foreign-born population - Argentina (%)
Place of birth for the foreign-born population - Bolivia (%)
Place of birth for the foreign-born population - Brazil (%)
Place of birth for the foreign-born population - Chile (%)
Place of birth for the foreign-born population - Colombia (%)
Place of birth for the foreign-born population - Ecuador (%)
Place of birth for the foreign-born population - Guyana (%)
Place of birth for the foreign-born population - Peru (%)
Place of birth for the foreign-born population - Uruguay (%)
Place of birth for the foreign-born population - Venezuela (%)
Place of birth for the foreign-born population - Other South America (%)
Place of birth for the foreign-born population - Canada (%)
Place of birth for the foreign-born population - Other Northern America (%)
Place of birth for the foreign-born population - Other (%)
Latest news about races in Jefferson, LA collected exclusively by city-data.com from local newspapers, TV, and radio stations
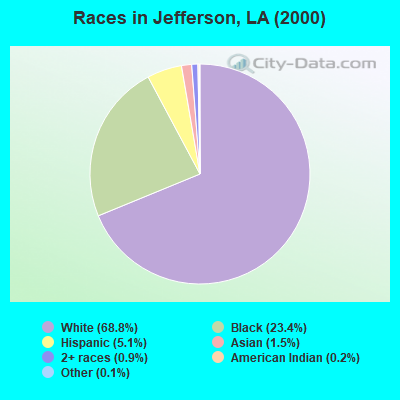
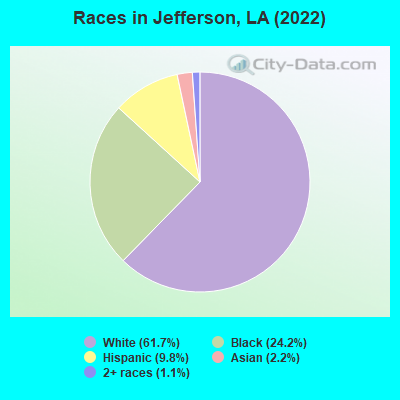
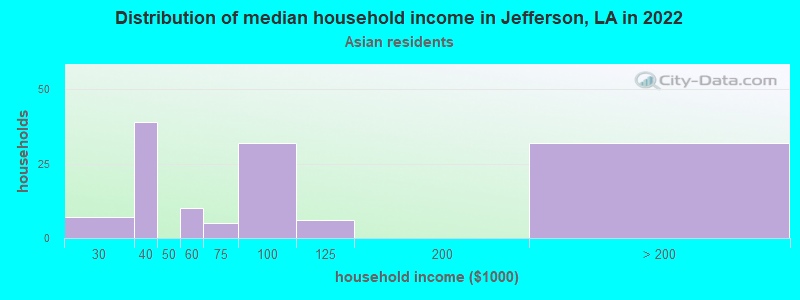
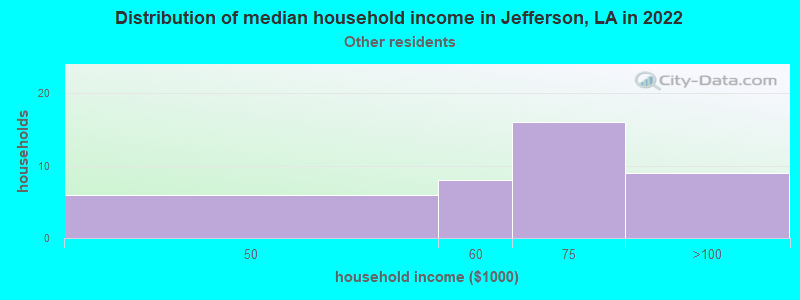
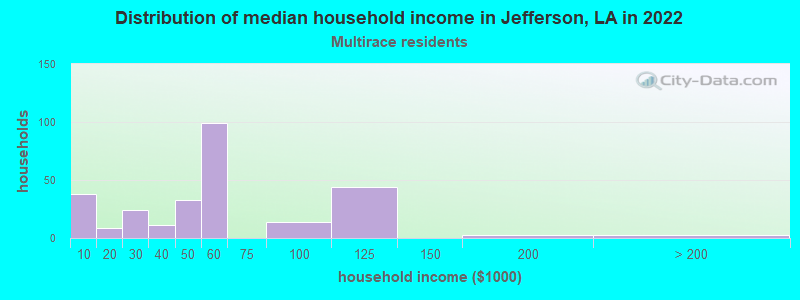
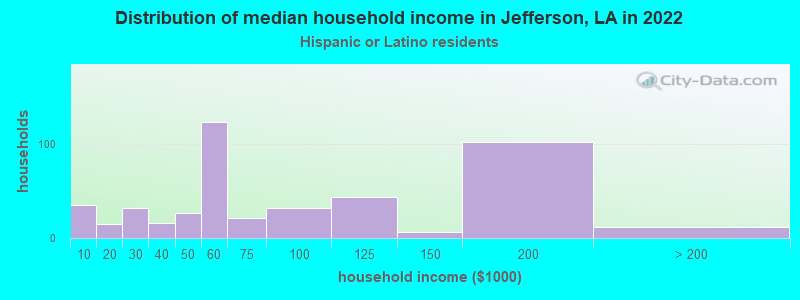
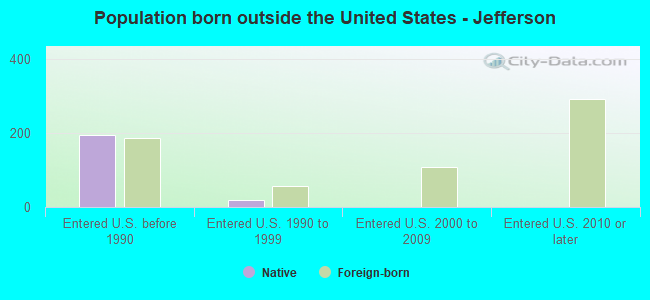
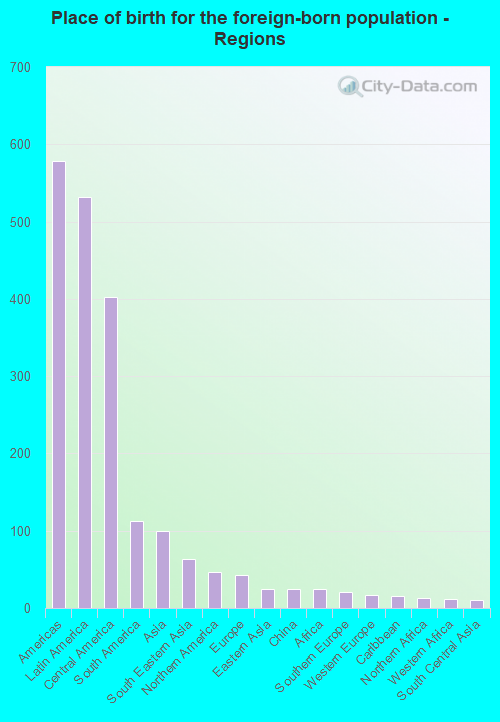
According to 2022 data, the most numerous races in Jefferson, LA are White alone (6,105 residents), Black alone (2,395 residents), and Hispanic (971 residents). 89.6% of Jefferson residents speak English at home. 7.5% of Jefferson, LA residents are foreign-born (5.1% born in Latin America, 1.0% born in Asia), which is 47.0% greater than the foreign-born rate of 4.0% across the entire state of Louisiana.
Race distribution in Jefferson
2000 2022
2,794,391 62.5% White alone 1,443,390 32.3% Black alone 107,738 2.4% Hispanic 54,256 1.2% Asian alone 39,260 0.9% Two or more races 24,129 0.5% American Indian alone 4,736 0.1% Other race alone 1,076 0.02% Native Hawaiian and Other
2,603,221 56.7% White alone 1,420,055 30.9% Black alone 262,213 5.7% Hispanic 183,270 4.0% Two or more races 81,169 1.8% Asian alone 19,991 0.4% American Indian alone 18,043 0.4% Other race alone 2,279 0.05% Native Hawaiian and Other
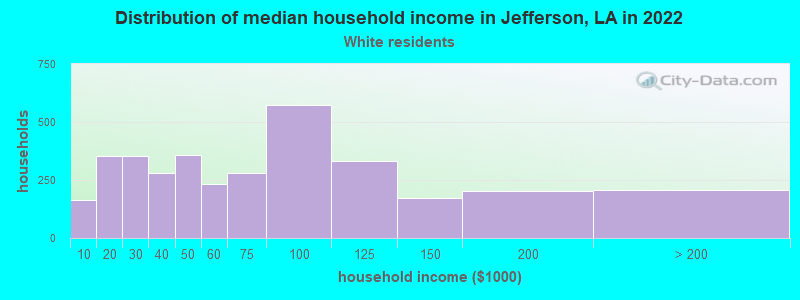
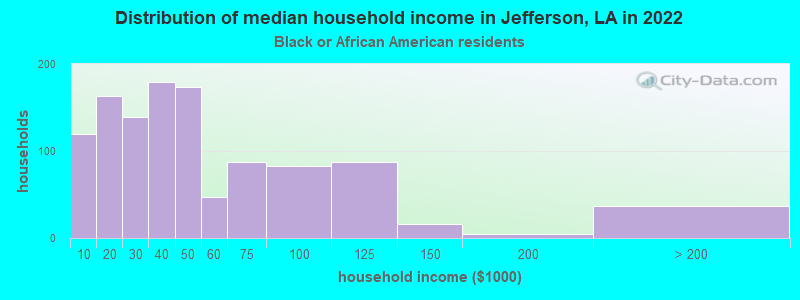
Income and house value in Jefferson Median household income in 2022 $59,920 White non-Hispanic householders$39,146 Black householders$66,845 Asian householders$67,296 Some other race householders$54,767 Two or more races householders$55,980 Hispanic or Latino race householdersMedian 2022 house value $274,753 White Non-Hispanic householders$201,395 Black or African American householders$330,787 American Indian or Alaska Native householders $241,999 Asian householders$222,780 Some other race householders$228,465 Two or more races householders$189,485 Hispanic or Latino householders
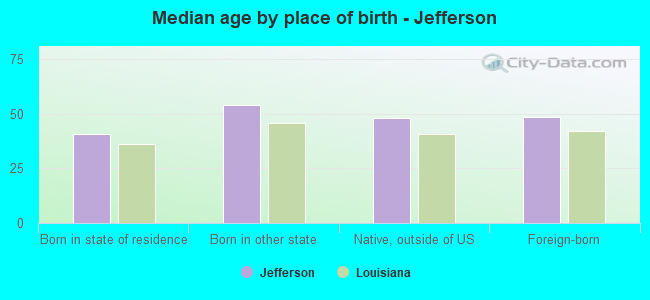
Median age by race in Jefferson
49.5 Median age for White residents47.0 52.0 37.2 Median age for Black or African American residents40.8 35.2 -872,832,369.1 Median age for American Indian / Alaska Native residents-679,966,749.1 -1,174,917,490.6 31.2 Median age for Asian residents25.3 44.9 -1,031,509,120.0 Median age for Native Hawaiian / Pacific Islander residents-868,167,201.7 -599,999,999.4 46.3 Median age for Other race residents43.0 70.8 40.2 Median age for Two or more races residents35.4 58.5 50.8 Median age for White alone residents47.3 51.9 39.8 Median age for Hispanic or Latino residents39.1 40.6
Owner/renter occupied households by race in Jefferson
House owners and renters - White residents 2,265 64.5% Owner occupied1,245 35.5% Renter occupiedHouse owners and renters - Black or African American residents 267 24.4% Owner occupied824 75.6% Renter occupiedHouse owners and renters - Asian residents 52 47.4% Owner occupied58 52.6% Renter occupiedHouse owners and renters - Other race residents 59 98.0% Owner occupied1 2.0% Renter occupiedHouse owners and renters - Two or more races residents 122 45.0% Owner occupied149 55.0% Renter occupiedHouse owners and renters - White alone residents 2,233 62.9% Owner occupied1,316 37.1% Renter occupiedHouse owners and renters - Hispanic or Latino residents 251 60.5% Owner occupied164 39.5% Renter occupied
Language usage in Jefferson
English speakers - Total 89.6% of residents of Jefferson speak English at home.
6.7% of residents speak Spanish at home 416 64.7% Speak English very well227 35.3% Speak English less than very well4.1% of residents speak other language at home 330 84.6% Speak English very well60 15.4% Speak English less than very well
English speakers - Born in the United States 91.2% of residents of Jefferson speak English at home.
3.6% of residents speak Spanish at home 17 27.0% Speak English very well46 73.0% Speak English less than very well4.8% of residents speak other language at home 83 100.0% Speak English very well
English speakers - Native, born elsewhere 90.3% of residents of Jefferson speak English at home.
6.1% of residents speak Spanish at home 12 100.0% Speak English very well
English speakers - Foreign-born 21.6% of residents of Jefferson speak English at home.
56.5% of residents speak Spanish at home 194 53.7% Speak English very well167 46.3% Speak English less than very well21.8% of residents speak other language at home 82 59.0% Speak English very well57 41.0% Speak English less than very well
White (Caucasian) - Speak only English Native:
97.0% (5,786)Foreign-born:
32.2% (81)
White (Caucasian) - Speak another language Native:
3.3% (197)Foreign-born:
67.5% (170)
Black or African American - Speak only English Native:
93.9% (2,180)Foreign-born:
64.4% (12)
Black or African American - Speak another language Native:
7.2% (166)Foreign-born:
34.7% (6)
Asian - Speak only English Native:
43.8% (50)Foreign-born:
41.4% (41)
Asian - Speak another language Native:
31.7% (36)Foreign-born:
57.4% (56)
Other race - Speak only English Native:
42.0% (5)Foreign-born:
9.6% (7)
Other race - Speak another language Native:
52.5% (6)Foreign-born:
88.6% (61)
Two or more races - Speak only English Native:
68.9% (313)Foreign-born:
3.8% (7)
Two or more races - Speak another language Native:
31.8% (144)Foreign-born:
96.5% (182)
White alone - Speak only English Native:
97.1% (5,695)Foreign-born:
34.2% (35)
White alone - Speak another language Native:
2.9% (172)Foreign-born:
58.0% (60)
Hispanic or Latino - Speak only English Native:
71.5% (386)Foreign-born:
9.5% (37)
Hispanic or Latino - Speak another language Native:
32.3% (174)Foreign-born:
90.6% (349)
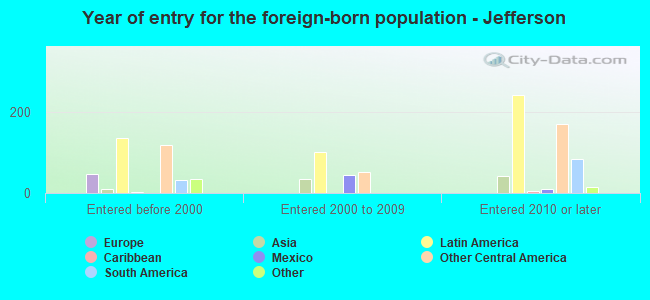
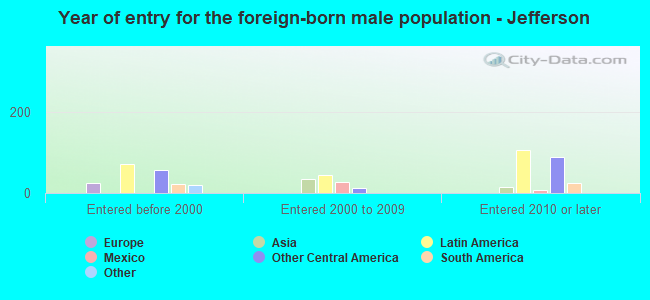
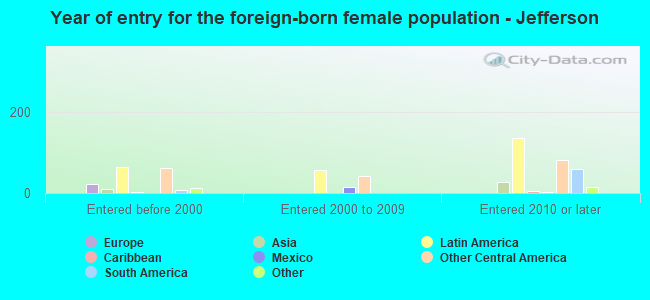
Foreign-born residents in Jefferson 747 residents are foreign born (5.1% Latin America , 1.0% Asia ).
This city:
7.5%Louisiana:
4.2%
Marital status for residents in Jefferson Marital status - White (Caucasian) population 15 years and over
Males 44.3% Never married34.6% Now married0.7% Separated4.1% Widowed16.3% DivorcedFemales 28.1% Never married34.4% Now married2.6% Separated11.8% Widowed23.1% DivorcedWomen who gave birth in the past 12 months Now married:
100.0% (54)Unmarried:
0.0% (0)
Women who did not give birth in the past 12 months Now married:
37.9% (428)Unmarried:
62.1% (700)
Marital status - Black or African American population 15 years and over
Males 52.4% Never married20.8% Now married4.6% Separated5.1% Widowed17.0% DivorcedFemales 56.3% Never married15.1% Now married4.8% Separated8.4% Widowed15.5% DivorcedWomen who gave birth in the past 12 months Now married:
19.7% (15)Unmarried:
80.3% (59)
Women who did not give birth in the past 12 months Now married:
9.0% (58)Unmarried:
91.0% (585)
Marital status - Asian population 15 years and over
Males 58.5% Never married33.0% Now married0.0% Separated0.0% Widowed8.5% DivorcedFemales 0.0% Never married65.2% Now married0.0% Separated0.0% Widowed34.8% DivorcedWomen who did not give birth in the past 12 months Now married:
69.2% (45)Unmarried:
30.8% (20)
Marital status - Other race population 15 years and over
Males 15.3% Never married35.6% Now married0.0% Separated0.0% Widowed49.2% DivorcedFemales 0.0% Never married27.3% Now married0.0% Separated36.4% Widowed36.4% DivorcedWomen who did not give birth in the past 12 months Now married:
100.0% (1)Unmarried:
0.0% (0)
Marital status - Two or more races population 15 years and over
Males 25.0% Never married68.6% Now married6.4% Separated0.0% Widowed0.0% DivorcedFemales 33.6% Never married36.6% Now married3.8% Separated7.2% Widowed18.7% DivorcedWomen who gave birth in the past 12 months Now married:
100.0% (24)Unmarried:
0.0% (0)
Women who did not give birth in the past 12 months Now married:
14.1% (20)Unmarried:
85.9% (120)
Marital status - White alone, not Hispanic / Latino population 15 years and over
Males 45.0% Never married33.2% Now married0.7% Separated4.5% Widowed16.6% DivorcedFemales 28.4% Never married34.0% Now married2.8% Separated11.5% Widowed23.4% DivorcedWomen who gave birth in the past 12 months Now married:
100.0% (58)Unmarried:
0.0% (0)
Women who did not give birth in the past 12 months Now married:
35.4% (393)Unmarried:
64.6% (717)
Marital status - Hispanic or Latino population 15 years and over
Males 29.6% Never married55.3% Now married2.4% Separated0.0% Widowed12.7% DivorcedFemales 28.0% Never married40.4% Now married2.0% Separated14.4% Widowed15.1% DivorcedWomen who gave birth in the past 12 months Now married:
100.0% (15)Unmarried:
0.0% (0)
Women who did not give birth in the past 12 months Now married:
46.6% (94)Unmarried:
53.4% (108)
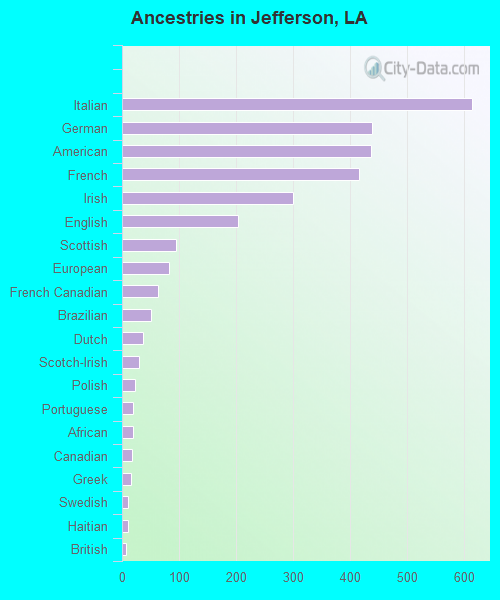
Ancestries in Jefferson
613 11.2% Italian438 8.0% German436 8.0% American415 7.6% French300 5.5% Irish203 3.7% English94 1.7% Scottish82 1.5% European63 1.1% French Canadian51 0.9% Brazilian36 0.7% Dutch30 0.5% Scotch-Irish23 0.4% Polish20 0.4% Portuguese19 0.3% African17 0.3% Canadian15 0.3% Greek11 0.2% Swedish10 0.2% Haitian7 0.1% British5 0.09% Slovak5 0.09% Swiss2 0.04% Eastern European2 0.04% Lithuanian2 0.04% Northern European1 0.02% Cajun
Children Nativity (place of birth) in Jefferson
Children under 6 years - Living with two parents Both parents native 202 100.0% NativeBoth parents foreign-born 5 100.0% NativeOne native, one foreign-born parent 22 100.0% NativeChildren under 6 years - Living with one parent Native parent 190 100.0% NativeChildren 6 to 17 years - Living with two parents Both parents native 294 99.9% Native0 0.1% Foreign-bornBoth parents foreign-born 12 100.0% Foreign-bornOne native, one foreign-born parent 42 100.0% NativeChildren 6 to 17 years - Living with one parent Native parent 719 100.0% NativeForeign-born parent 47 46.5% Native54 53.5% Foreign-born
Grandparents responsible for own grandchildren in Jefferson
Grandparents (30 to 59 years) Black or African American 34 83.1% Responsible for grandchildren7 16.9% Not responsible for grandchildrenGrandparents (60 years and over) Black or African American 53 89.7% Responsible for grandchildren6 10.3% Not responsible for grandchildren