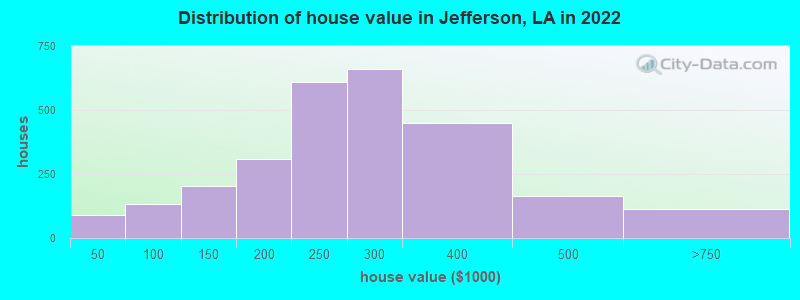
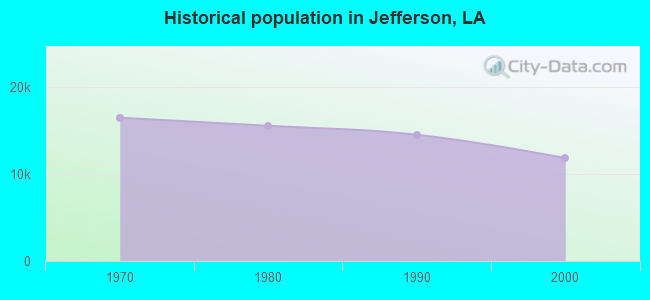
Estimated median house or condo value in 2022: $264,197 (it was $97,600 in 2000)
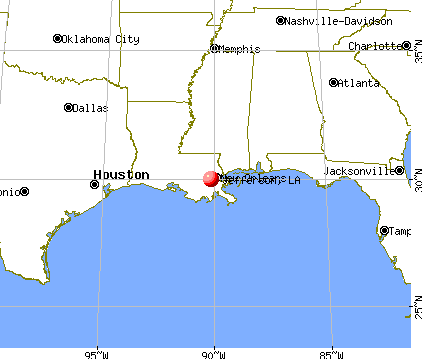
Jefferson:
$264,197
LA:
$209,200
Mean prices in 2022:all housing units: $249,366; detached houses: $249,216; townhouses or other attached units: $299,882; in 2-unit structures: $312,908; in 3-to-4-unit structures: $142,679; in 5-or-more-unit structures: $175,375; mobile homes: $158,394
Median gross rent in 2022: $1,087.
March 2022 cost of living index in Jefferson: 97.2 (near average, U.S. average is 100)
Percentage of residents living in poverty in 2022: 12.1%
(8.8% for White Non-Hispanic residents, 21.9% for Black residents, 11.5% for Hispanic or Latino residents, 100.0% for Native Hawaiian and other Pacific Islander residents, 10.8% for two or more races residents)
According to our research of Louisiana and other state lists, there were 26 registered sex offenders living in Jefferson, Louisiana as of May 04, 2024. The ratio of all residents to sex offenders in Jefferson is 406 to 1. The ratio of registered sex offenders to all residents in this city is near the state average.
Recent articles from our blog. Our writers, many of them Ph.D. graduates or candidates, create easy-to-read articles on a wide variety of topics.
Ancestries: Italian (8.9%), American (7.3%), French (7.1%), German (6.9%), Irish (5.4%), English (2.9%).
Current Local Time: CST time zone
Elevation: 5 feet
Land area: 2.76 square miles.
Population density: 4,058 people per square mile (average).
747 residents are foreign born (5.1% Latin America, 1.0% Asia).
This place:
7.5%
Louisiana:
4.2%
Median real estate property taxes paid for housing units with mortgages in 2022: $1,291 (0.5%) Median real estate property taxes paid for housing units with no mortgage in 2022: $652 (0.3%)
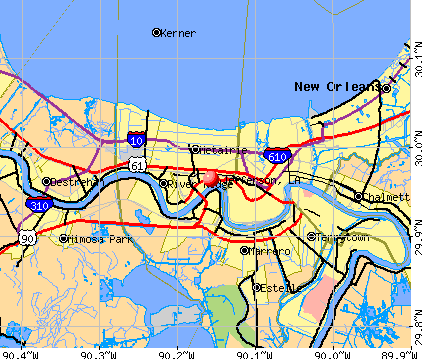
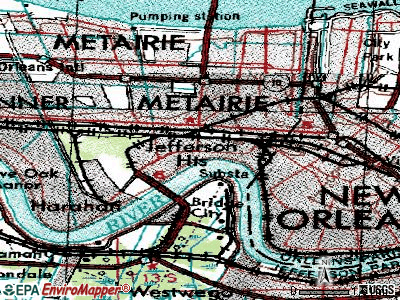
Nearest city with pop. 50,000+: Metairie, LA (2.6 miles , pop. 146,136).
Nearest city with pop. 200,000+: New Orleans, LA (5.9 miles , pop. 484,674).
Nearest city with pop. 1,000,000+: Houston, TX (313.8 miles , pop. 1,953,631).
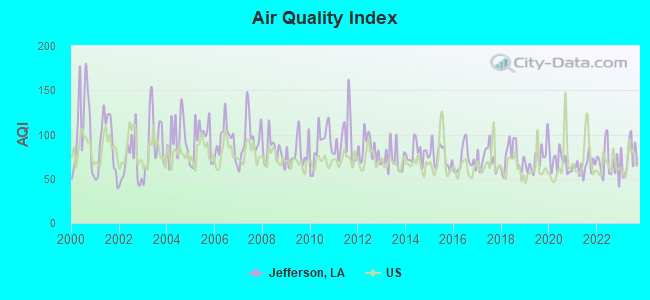
Air Quality Index (AQI) level in 2023 was 75.0. This is about average.
City:
75.0
U.S.:
72.6
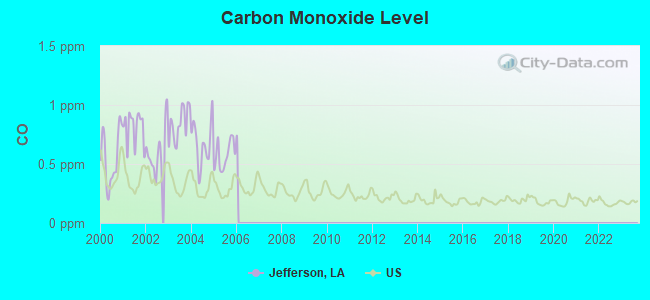
Carbon Monoxide (CO) [ppm] level in 2005 was 0.575. This is significantly worse than average.Closest monitor was 3.9 miles away from the city center.
City:
0.575
U.S.:
0.251
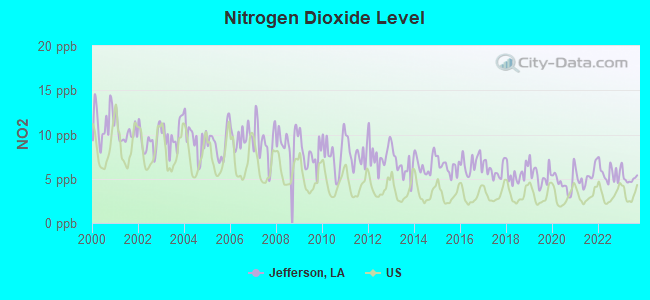
Nitrogen Dioxide (NO2) [ppb] level in 2023 was 5.12. This is about average.Closest monitor was 0.6 miles away from the city center.
City:
5.12
U.S.:
5.11
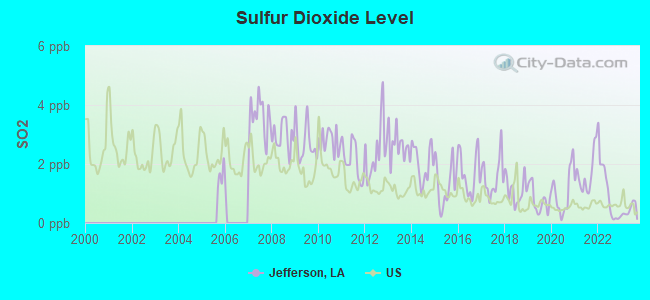
Sulfur Dioxide (SO2) [ppb] level in 2023 was 0.421. This is significantly better than average.Closest monitor was 0.6 miles away from the city center.
City:
0.421
U.S.:
1.515
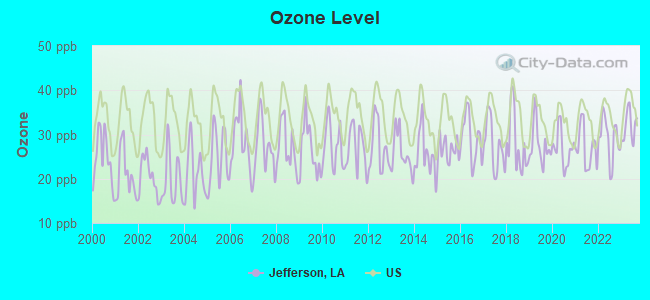
Ozone [ppb] level in 2023 was 31.9. This is about average.Closest monitor was 2.4 miles away from the city center.
City:
31.9
U.S.:
33.3
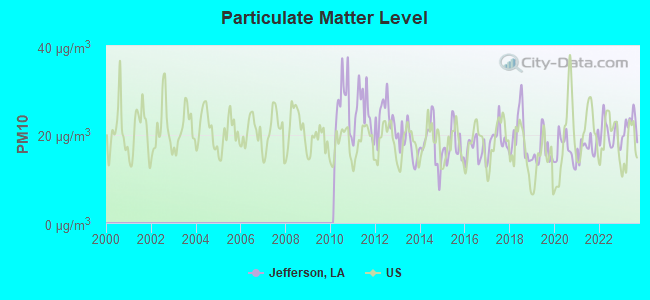
Particulate Matter (PM10) [µg/m3] level in 2023 was 22.2. This is about average.Closest monitor was 2.2 miles away from the city center.
City:
22.2
U.S.:
19.2
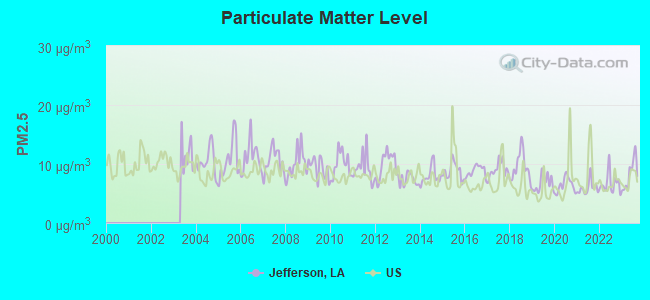
Particulate Matter (PM2.5) [µg/m3] level in 2023 was 8.17. This is about average.Closest monitor was 3.9 miles away from the city center.
City:
8.17
U.S.:
8.11
Tornado activity:
Jefferson-area historical tornado activity is slightly below Louisiana state average. It is 27% greater than the overall U.S. average.
On 12/6/1983, a category F4 (max. wind speeds 207-260 mph) tornado 17.7 miles away from the Jefferson place center injured 25 peopleand causedbetween $5,000,000 and $50,000,000 in damages.
On 10/3/1964, a category F4 tornado 28.2 miles away from the place center killed 22 peopleand injured 165 peopleand causedbetween $500,000 and $5,000,000 in damages.
Earthquake activity:
Jefferson-area historical earthquake activity is significantly above Louisiana state average. It is 55% smaller than the overall U.S. average.
On 9/10/2006 at 14:56:08, a magnitude 5.9 (5.9 MB, 5.5 MS, 5.8 MW, Class: Moderate, Intensity: VI - VII) earthquake occurred 335.1 miles away from Jefferson center On 10/24/1997 at 08:35:17, a magnitude 4.9 (4.8 MB, 4.2 MS, 4.9 LG, Depth: 6.2 mi, Class: Light, Intensity: IV - V) earthquake occurred 189.6 miles away from the city center On 5/6/2018 at 16:47:09, a magnitude 4.6 (4.6 MB, Depth: 6.2 mi) earthquake occurred 170.2 miles away from Jefferson center On 6/30/1994 at 01:08:24, a magnitude 4.2 (4.2 MB, Depth: 6.2 mi) earthquake occurred 142.0 miles away from Jefferson center On 5/17/2012 at 08:12:00, a magnitude 4.8 (4.8 MW, Depth: 3.1 mi) earthquake occurred 284.3 miles away from the city center On 1/18/1999 at 07:00:53, a magnitude 4.8 (4.8 MB, 4.0 LG, Depth: 0.6 mi) earthquake occurred 292.9 miles away from the city center Magnitude types: regional Lg-wave magnitude (LG), body-wave magnitude (MB), surface-wave magnitude (MS), moment magnitude (MW)
Natural disasters:
The number of natural disasters in Jefferson Parish (31) is a lot greater than the US average (15). Major Disasters (Presidential) Declared: 23 Emergencies Declared: 5
Causes of natural disasters: Hurricanes: 17, Floods: 6, Storms: 6, Tropical Storms: 6, Heavy Rain: 1, Tornado: 1, Other: 2 (Note: some incidents may be assigned to more than one category).
Hospitals and medical centers in Jefferson:
BROOKLYN COMMUNITY HOME (393 BROOKLYN AVE)
MAGNOLIA DODGE AVENUE GROUP HO (333 DODGE AVENUE)
MAGNOLIA MAINE STREET COMMUNITY HOME (119 MAINE STREET)
MAGNOLIA MAISON CENTRAL AVENUE (326 CENTRAL AVENUE)
MAGNOLIA MAISON ST GEORGE COMM (213 ST GEORGE AVENUE)
Notable locations in Jefferson: Shrewsbury Junction (A), Jefferson Healthcare Center (B), Eastbank Consolidated Fire Department Station 12 (C), Eastbank Consolidated Fire Department Station 11 (D), Shrewco Center Day Care Center (E), Hazel Rhea Hurst Community Center (F), Ville Saint Marie Senior Living Community (G). Display/hide their locations on the map
Shopping Centers: Vans Shopping Center (1), Azalea Gardens Shopping Center (2), Castay Shopping Center (3), Jefferson Plaza Shopping Center (4). Display/hide their locations on the map
Churches in Jefferson include: Youth With A Mission Church (A), Jefferson Presbyterian Church (B), First Mission Baptist Church (C), Saint James Church of God in Christ (D), Saint Agnes Catholic Church (E), Rio Vista Baptist Church (F), Marine Baptist Church (G), Jefferson United Methodist Church (H), First Zion Baptist Church (I). Display/hide their locations on the map
Birthplace of: Juan Joseph - Player of and football.
Jefferson Parish has a predicted average indoor radon screening level less than 2 pCi/L (pico curies per liter) - Low Potential
Drinking water stations with addresses in Jefferson that have no violations reported:
E JEFFERSON WW DISTRICT 1 (Address: 3600 Jefferson Hwy., Building E , Population served: 308,362,Primary Water Source Type: Surface water)
Average household size:
This place:
2.1 people
Louisiana:
2.5 people
Percentage of family households:
This place:
50.7%
Whole state:
67.1%
Percentage of households with unmarried partners:
This place:
7.9%
Whole state:
6.8%
Likely homosexual households (counted as self-reported same-sex unmarried-partner households)
Lesbian couples: 0.4% of all households
Gay men: 0.3% of all households
People in group quarters in Jefferson in 2010:
198 people in nursing facilities/skilled-nursing facilities
67 people in group homes intended for adults
49 people in residential treatment centers for adults
6 people in other noninstitutional facilities
People in group quarters in Jefferson in 2000:
229 people in nursing homes
191 people in other noninstitutional group quarters
17 people in other group homes
3 people in religious group quarters
Banks with branches in Jefferson (2011 data):
Whitney Bank: Elmwood Branch at 5600 Jefferson Highway, Building C-1, branch established on 2006/01/03; Labarre Road Branch at 400 Labarre Road, branch established on 1955/10/21. Info updated 2011/06/14: Bank assets: $14,882.3 mil, Deposits: $11,630.0 mil, headquarters in New Orleans, LA, positive income, Commercial Lending Specialization, 189 total offices, Holding Company: Hancock Holding Company
Regions Bank: Elmwood Park Branch at 840 South Clearview Parkway, branch established on 1976/12/20. Info updated 2011/02/24: Bank assets: $123,368.2 mil, Deposits: $98,301.3 mil, headquarters in Birmingham, AL, positive income, Commercial Lending Specialization, 1778 total offices, Holding Company: Regions Financial Corporation
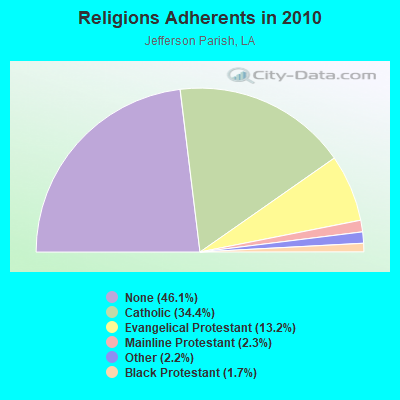
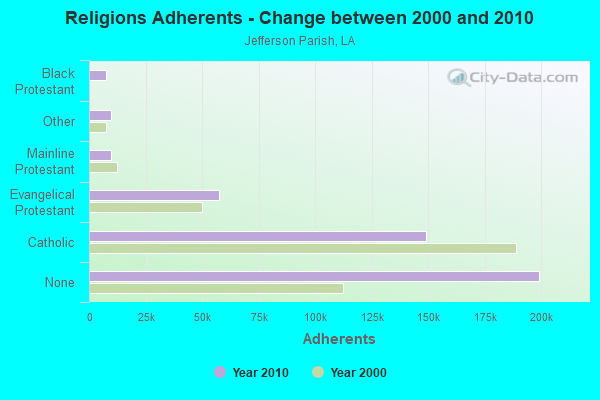
Religion statistics for Jefferson, LA (based on Jefferson Parish data)
Religion
Adherents
Congregations
Catholic
148,827
43
Evangelical Protestant
57,266
160
Mainline Protestant
9,908
30
Other
9,666
23
Black Protestant
7,394
32
Orthodox
300
1
None
199,191
-
Source: Clifford Grammich, Kirk Hadaway, Richard Houseal, Dale E.Jones, Alexei Krindatch, Richie Stanley and Richard H.Taylor. 2012. 2010 U.S.Religion Census: Religious Congregations & Membership Study. Association of Statisticians of American Religious Bodies. Jones, Dale E., et al. 2002. Congregations and Membership in the United States 2000. Nashville, TN: Glenmary Research Center. Graphs represent county-level data
Aircraft: BEECH 58P (Category: Land, Engines: 2, Seats: 6, Weight: Up to 12,499 Pounds, Speed: 123 mph), Engine: CONT MOTOR TSIO-520 SER (300 HP) (Reciprocating) N-Number: 3848Y, N3848Y, N-3848Y, Serial Number: TJ-349, Year manufactured: 1981, Airworthiness Date: 03/25/1981, Certificate Issue Date: 07/11/2005 Registrant (LLC): Baron Lake LLC, 125 Industrial Ave, Jefferson, LA 70121
Aircraft: BEECH E-90 (Category: Land, Engines: 2, Seats: 10, Weight: Up to 12,499 Pounds), Engine: U/A CANADA PT6A-27-28 (680 HP) (Turbo-prop) N-Number: 809DM, N809DM, N-809DM, Serial Number: LW-334, Year manufactured: 1980, Airworthiness Date: 04/15/1980, Certificate Issue Date: 08/30/2019 Registrant (LLC): Belle Chasse Marine Transportation LLC, Po Box 10890, Jefferson, LA 70181
Aircraft: QUICKSILVER SPRINT II (Category: Land, Seats: 2, Weight: Up to 12,499 Pounds), Engine: 2 Cycle N-Number: 105GM, N105GM, N-105GM, Serial Number: 7805, Certificate Issue Date: 12/14/2007 Registrant (Individual): Ghant M Grisbaum, 514 Julius Ave, Jefferson, LA 70121 Deregistered:Cancel Date: 01/09/2018
Aircraft: HARRIS CHARLES R BABY LAKES (Category: Land, Weight: Up to 12,499 Pounds), Engine: CONT MOTOR 0-200 SERIES (100 HP) (Reciprocating) N-Number: 345B, N345B, N-345B, Serial Number: 9524-D-342-B, Year manufactured: 2003, Airworthiness Date: 06/27/2003, Certificate Issue Date: 09/20/2010 Registrant (Individual): Ghant M Grisbaum, 514 Julius Ave, Jefferson, LA 70121
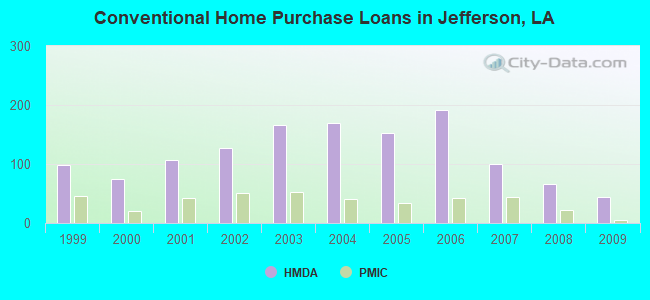
Home Mortgage Disclosure Act Aggregated Statistics For Year 2009 (Based on 4 full and 2 partial tracts)
A) FHA, FSA/RHS & VA Home Purchase Loans
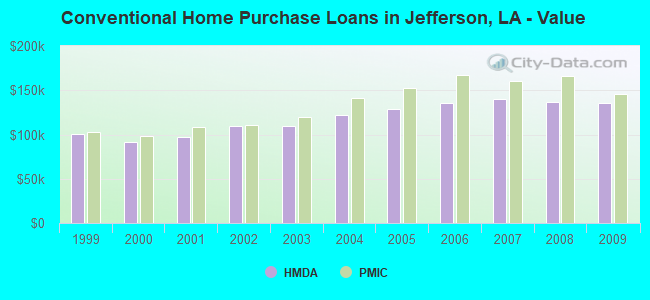
B) Conventional Home Purchase Loans
C) Refinancings
D) Home Improvement Loans
E) Loans on Dwellings For 5+ Families
F) Non-occupant Loans on < 5 Family Dwellings (A B C & D)
Number
Average Value
Number
Average Value
Number
Average Value
Number
Average Value
Number
Average Value
Number
Average Value
LOANS ORIGINATED
37
$151,159
44
$135,447
107
$135,527
18
$42,784
3
$542,577
23
$123,945
APPLICATIONS APPROVED, NOT ACCEPTED
0
$0
3
$130,870
18
$149,515
2
$114,190
0
$0
0
$0
APPLICATIONS DENIED
1
$123,000
4
$148,548
71
$144,774
13
$28,833
0
$0
4
$130,648
APPLICATIONS WITHDRAWN
7
$177,119
3
$155,727
31
$158,466
1
$135,000
0
$0
2
$119,230
FILES CLOSED FOR INCOMPLETENESS
1
$158,370
2
$61,500
10
$158,478
1
$140,000
0
$0
2
$98,000
Aggregated Statistics For Year 2008 (Based on 4 full and 2 partial tracts)
A) FHA, FSA/RHS & VA Home Purchase Loans
B) Conventional Home Purchase Loans
C) Refinancings
D) Home Improvement Loans
E) Loans on Dwellings For 5+ Families
F) Non-occupant Loans on < 5 Family Dwellings (A B C & D)
G) Loans On Manufactured Home Dwelling (A B C & D)
Number
Average Value
Number
Average Value
Number
Average Value
Number
Average Value
Number
Average Value
Number
Average Value
Number
Average Value
LOANS ORIGINATED
32
$150,597
66
$136,825
91
$144,419
25
$70,432
6
$317,812
28
$142,996
6
$46,685
APPLICATIONS APPROVED, NOT ACCEPTED
2
$148,040
4
$152,012
8
$129,300
3
$14,450
0
$0
3
$107,667
1
$27,740
APPLICATIONS DENIED
3
$125,247
16
$177,291
69
$151,330
23
$54,467
0
$0
8
$133,096
4
$45,492
APPLICATIONS WITHDRAWN
5
$130,252
8
$136,375
23
$134,049
3
$107,000
0
$0
3
$167,333
0
$0
FILES CLOSED FOR INCOMPLETENESS
1
$218,730
2
$115,000
8
$150,755
0
$0
0
$0
1
$105,000
0
$0
Aggregated Statistics For Year 2007 (Based on 4 full and 2 partial tracts)
A) FHA, FSA/RHS & VA Home Purchase Loans
B) Conventional Home Purchase Loans
C) Refinancings
D) Home Improvement Loans
E) Loans on Dwellings For 5+ Families
F) Non-occupant Loans on < 5 Family Dwellings (A B C & D)
G) Loans On Manufactured Home Dwelling (A B C & D)
Number
Average Value
Number
Average Value
Number
Average Value
Number
Average Value
Number
Average Value
Number
Average Value
Number
Average Value
LOANS ORIGINATED
7
$147,467
100
$140,226
117
$128,210
29
$55,288
2
$537,000
21
$104,572
1
$70,000
APPLICATIONS APPROVED, NOT ACCEPTED
2
$87,325
12
$148,392
29
$115,978
11
$61,389
0
$0
6
$99,812
1
$83,860
APPLICATIONS DENIED
0
$0
18
$132,565
65
$154,997
26
$65,138
0
$0
8
$172,291
0
$0
APPLICATIONS WITHDRAWN
2
$98,500
16
$127,206
36
$141,430
8
$137,706
0
$0
8
$135,402
1
$17,020
FILES CLOSED FOR INCOMPLETENESS
0
$0
6
$138,528
7
$185,730
1
$124,210
0
$0
1
$43,000
0
$0
Aggregated Statistics For Year 2006 (Based on 4 full and 2 partial tracts)
A) FHA, FSA/RHS & VA Home Purchase Loans
B) Conventional Home Purchase Loans
C) Refinancings
D) Home Improvement Loans
E) Loans on Dwellings For 5+ Families
F) Non-occupant Loans on < 5 Family Dwellings (A B C & D)
G) Loans On Manufactured Home Dwelling (A B C & D)
Number
Average Value
Number
Average Value
Number
Average Value
Number
Average Value
Number
Average Value
Number
Average Value
Number
Average Value
LOANS ORIGINATED
16
$154,029
191
$135,512
117
$133,042
24
$38,792
5
$293,666
39
$124,893
0
$0
APPLICATIONS APPROVED, NOT ACCEPTED
0
$0
24
$139,161
28
$123,925
10
$34,280
0
$0
5
$160,400
2
$38,925
APPLICATIONS DENIED
0
$0
37
$105,066
54
$144,269
27
$61,590
0
$0
8
$100,011
6
$35,070
APPLICATIONS WITHDRAWN
2
$108,405
26
$115,543
53
$141,677
4
$75,740
0
$0
4
$193,522
0
$0
FILES CLOSED FOR INCOMPLETENESS
0
$0
3
$155,473
18
$150,849
0
$0
0
$0
0
$0
0
$0
Aggregated Statistics For Year 2005 (Based on 4 full and 2 partial tracts)
A) FHA, FSA/RHS & VA Home Purchase Loans
B) Conventional Home Purchase Loans
C) Refinancings
D) Home Improvement Loans
E) Loans on Dwellings For 5+ Families
F) Non-occupant Loans on < 5 Family Dwellings (A B C & D)
G) Loans On Manufactured Home Dwelling (A B C & D)
Number
Average Value
Number
Average Value
Number
Average Value
Number
Average Value
Number
Average Value
Number
Average Value
Number
Average Value
LOANS ORIGINATED
14
$135,191
152
$128,678
172
$107,859
22
$53,877
2
$198,000
35
$115,877
0
$0
APPLICATIONS APPROVED, NOT ACCEPTED
2
$156,000
20
$117,731
36
$113,785
5
$38,038
0
$0
3
$91,667
2
$37,765
APPLICATIONS DENIED
4
$109,208
24
$102,655
98
$115,125
28
$36,456
0
$0
9
$93,617
3
$42,953
APPLICATIONS WITHDRAWN
2
$130,500
26
$123,132
67
$138,334
10
$135,176
0
$0
10
$126,120
0
$0
FILES CLOSED FOR INCOMPLETENESS
0
$0
6
$132,027
28
$109,599
2
$116,400
0
$0
3
$88,333
0
$0
Aggregated Statistics For Year 2004 (Based on 4 full and 2 partial tracts)
A) FHA, FSA/RHS & VA Home Purchase Loans
B) Conventional Home Purchase Loans
C) Refinancings
D) Home Improvement Loans
E) Loans on Dwellings For 5+ Families
F) Non-occupant Loans on < 5 Family Dwellings (A B C & D)
G) Loans On Manufactured Home Dwelling (A B C & D)
Number
Average Value
Number
Average Value
Number
Average Value
Number
Average Value
Number
Average Value
Number
Average Value
Number
Average Value
LOANS ORIGINATED
26
$129,087
169
$122,147
240
$101,089
33
$34,355
4
$329,198
56
$101,019
1
$5,000
APPLICATIONS APPROVED, NOT ACCEPTED
2
$75,795
13
$115,394
32
$85,392
9
$62,686
0
$0
3
$90,563
0
$0
APPLICATIONS DENIED
2
$134,395
24
$130,161
106
$105,715
29
$54,671
0
$0
12
$90,069
6
$45,295
APPLICATIONS WITHDRAWN
0
$0
13
$120,049
79
$108,338
1
$98,170
0
$0
4
$66,832
0
$0
FILES CLOSED FOR INCOMPLETENESS
0
$0
6
$109,123
48
$108,276
0
$0
0
$0
2
$74,200
0
$0
Aggregated Statistics For Year 2003 (Based on 4 full and 2 partial tracts)
A) FHA, FSA/RHS & VA Home Purchase Loans
B) Conventional Home Purchase Loans
C) Refinancings
D) Home Improvement Loans
E) Loans on Dwellings For 5+ Families
F) Non-occupant Loans on < 5 Family Dwellings (A B C & D)
Number
Average Value
Number
Average Value
Number
Average Value
Number
Average Value
Number
Average Value
Number
Average Value
LOANS ORIGINATED
31
$121,195
166
$109,714
414
$97,864
38
$26,429
3
$385,573
70
$91,045
APPLICATIONS APPROVED, NOT ACCEPTED
3
$96,363
23
$108,420
64
$94,413
5
$25,200
0
$0
7
$89,023
APPLICATIONS DENIED
6
$112,167
29
$85,039
139
$91,059
21
$30,530
1
$300,000
13
$81,127
APPLICATIONS WITHDRAWN
3
$104,667
16
$108,404
64
$101,172
2
$28,500
1
$340,000
3
$66,073
FILES CLOSED FOR INCOMPLETENESS
2
$97,770
4
$141,908
13
$97,748
3
$28,333
0
$0
1
$111,000
Aggregated Statistics For Year 2002 (Based on 4 full and 2 partial tracts)
A) FHA, FSA/RHS & VA Home Purchase Loans
B) Conventional Home Purchase Loans
C) Refinancings
D) Home Improvement Loans
E) Loans on Dwellings For 5+ Families
F) Non-occupant Loans on < 5 Family Dwellings (A B C & D)
Number
Average Value
Number
Average Value
Number
Average Value
Number
Average Value
Number
Average Value
Number
Average Value
LOANS ORIGINATED
25
$114,840
127
$109,529
324
$90,587
49
$29,538
3
$294,507
62
$100,085
APPLICATIONS APPROVED, NOT ACCEPTED
1
$41,610
18
$88,426
42
$80,291
10
$24,798
0
$0
11
$84,885
APPLICATIONS DENIED
1
$167,330
15
$105,649
84
$79,399
34
$22,387
1
$74,000
3
$44,660
APPLICATIONS WITHDRAWN
5
$114,102
10
$129,896
41
$73,373
2
$14,500
0
$0
4
$75,920
FILES CLOSED FOR INCOMPLETENESS
5
$122,000
3
$80,670
15
$85,909
0
$0
0
$0
1
$63,000
Aggregated Statistics For Year 2001 (Based on 4 full and 2 partial tracts)
A) FHA, FSA/RHS & VA Home Purchase Loans
B) Conventional Home Purchase Loans
C) Refinancings
D) Home Improvement Loans
E) Loans on Dwellings For 5+ Families
F) Non-occupant Loans on < 5 Family Dwellings (A B C & D)
Number
Average Value
Number
Average Value
Number
Average Value
Number
Average Value
Number
Average Value
Number
Average Value
LOANS ORIGINATED
41
$104,310
107
$97,491
232
$87,413
42
$20,034
2
$281,000
27
$67,320
APPLICATIONS APPROVED, NOT ACCEPTED
1
$111,000
16
$127,720
31
$64,811
9
$32,303
0
$0
6
$107,100
APPLICATIONS DENIED
3
$95,000
28
$74,920
87
$71,731
28
$17,040
0
$0
6
$63,148
APPLICATIONS WITHDRAWN
4
$95,285
13
$84,545
50
$63,941
5
$18,522
0
$0
5
$57,320
FILES CLOSED FOR INCOMPLETENESS
1
$184,210
3
$64,667
21
$91,502
1
$35,000
0
$0
1
$131,580
Aggregated Statistics For Year 2000 (Based on 4 full and 2 partial tracts)
A) FHA, FSA/RHS & VA Home Purchase Loans
B) Conventional Home Purchase Loans
C) Refinancings
D) Home Improvement Loans
E) Loans on Dwellings For 5+ Families
F) Non-occupant Loans on < 5 Family Dwellings (A B C & D)
Number
Average Value
Number
Average Value
Number
Average Value
Number
Average Value
Number
Average Value
Number
Average Value
LOANS ORIGINATED
37
$101,379
74
$91,262
91
$66,341
34
$25,352
5
$211,400
12
$78,756
APPLICATIONS APPROVED, NOT ACCEPTED
0
$0
12
$90,078
29
$66,580
8
$18,402
0
$0
0
$0
APPLICATIONS DENIED
3
$77,220
23
$74,395
94
$62,559
21
$14,184
1
$88,000
3
$51,357
APPLICATIONS WITHDRAWN
0
$0
12
$144,532
47
$52,399
3
$32,840
1
$268,000
2
$58,875
FILES CLOSED FOR INCOMPLETENESS
0
$0
2
$90,170
16
$73,592
0
$0
0
$0
0
$0
Aggregated Statistics For Year 1999 (Based on 4 full and 2 partial tracts)
A) FHA, FSA/RHS & VA Home Purchase Loans
B) Conventional Home Purchase Loans
C) Refinancings
D) Home Improvement Loans
F) Non-occupant Loans on < 5 Family Dwellings (A B C & D)
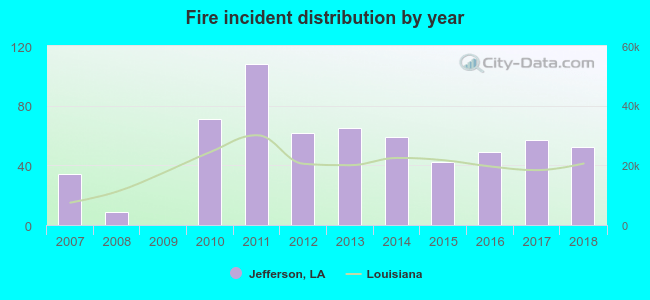
2007 - 2018 National Fire Incident Reporting System (NFIRS) incidents
Based on the data from the years 2007 - 2018 the average number of fires per year is 51. The highest number of reported fires - 108 took place in 2011, and the least - 0 in 2009. The data has a rising trend.
When looking into fire subcategories, the most reports belonged to: Structure Fires (35.1%), and Outside Fires (34.6%).
Fire incident types reported to NFIRS in Jefferson, LA
#60 on the list of "Top 101 cities with the most residents born in Honduras (population 500+)"
#100 (70121) on the list of "Top 101 zip codes with the largest percentage of French first ancestries (pop 5,000+)"
#46 on the list of "Top 101 counties with the lowest percentage of residents that drank alcohol in the past 30 days"
#49 on the list of "Top 101 counties with the largest decrease in the number of infant deaths per 1000 residents 2000-2006 to 2007-2013 (pop. 50,000+)"
#50 on the list of "Top 101 counties with the largest increase in the number of births per 1000 residents 2000-2006 to 2007-2013 (pop 50,000+)"
#64 on the list of "Top 101 counties with the highest number of infant deaths per 1000 residents 2007-2013 (pop. 50,000+)"
#68 on the list of "Top 101 counties with the highest surface withdrawal of fresh water for public supply (pop. 50,000+)"


 Recent articles from our blog. Our writers, many of them Ph.D. graduates or candidates, create easy-to-read articles on a wide variety of topics.

 (2.6 miles
 Based on the data from the years 2007 - 2018 the average number of fires per year is 51. The highest number of reported fires - 108 took place in 2011, and the least - 0 in 2009. The data has a rising trend.
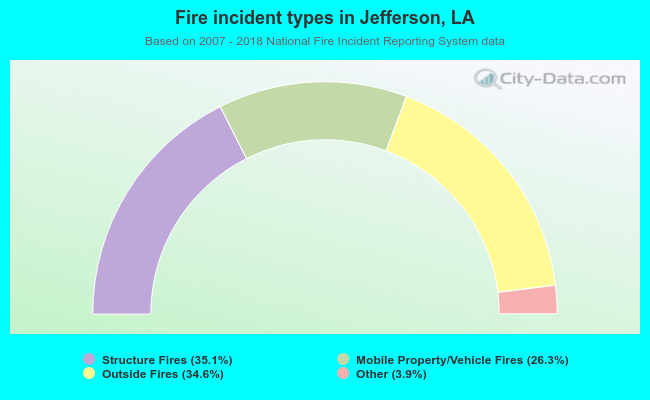 When looking into fire subcategories, the most reports belonged to: Structure Fires (35.1%), and Outside Fires (34.6%).