Estimated zip code population in 2022: 26,308
Zip code population in 2010: 23,820
Zip code population in 2000: 20,209
Houses and condos: 11,487
Renter-occupied apartments: 4,049
% of renters here:
41%State:
33%
March 2022 cost of living index in zip code 28083: 91.3
(less than average, U.S. average is 100)
Land area: 20.0
sq. mi.
Water area: 0.5
sq. mi.
Population density: 1,312 people per square mile (low).
OSM Map
General Map
Google Map
MSN Map
OSM Map
General Map
Google Map
MSN Map
OSM Map
General Map
Google Map
MSN Map
OSM Map
General Map
Google Map
MSN Map
Please wait while loading the map...
Real estate property taxes paid for housing units in 2022:
This zip code:
0.7% ($1,526)North Carolina:
0.6% ($1,769)
Median real estate property taxes paid for housing units with mortgages in 2022: $1,561 (0.7%)
Median real estate property taxes paid for housing units with no mortgage in 2022: $1,472 (0.9%)
Business Search - 14 Million verified businesses
Males: 13,531 Females: 12,773
For population 25 years and over in 28083:
High school or higher: 87.4%Bachelor's degree or higher: 18.2%Graduate or professional degree: 3.9%Unemployed: 5.1%Mean travel time to work (commute): 24.4 minutes
For population 15 years and over in 28083:
Never married: 32.9%Now married: 43.7%Separated: 4.1%Widowed: 8.0%Divorced: 11.3%
Zip code 28083 compared to state average:
Length of stay since moving in significantly above state average. Percentage of population with a bachelor's degree or higher below state average. 15,244 58.0% White 6,633 25.2% Black 2,998 11.4% Hispanic or Latino 1,032 3.9% Two or more races 370 1.4% Asian 27 0.1% Some other race
Data:
Median household income ($)
Median household income (% change since 2000)
Household income diversity
Ratio of average income to average house value (%)
Ratio of average income to average rent
Median household income ($) - White
Median household income ($) - Black or African American
Median household income ($) - Asian
Median household income ($) - Hispanic or Latino
Median household income ($) - American Indian and Alaska Native
Median household income ($) - Multirace
Median household income ($) - Other Race
Median household income for houses/condos with a mortgage ($)
Median household income for apartments without a mortgage ($)
Races - White alone (%)
Races - White alone (% change since 2000)
Races - Black alone (%)
Races - Black alone (% change since 2000)
Races - American Indian alone (%)
Races - American Indian alone (% change since 2000)
Races - Asian alone (%)
Races - Asian alone (% change since 2000)
Races - Hispanic (%)
Races - Hispanic (% change since 2000)
Races - Native Hawaiian and Other Pacific Islander alone (%)
Races - Native Hawaiian and Other Pacific Islander alone (% change since 2000)
Races - Two or more races (%)
Races - Two or more races (% change since 2000)
Races - Other race alone (%)
Races - Other race alone (% change since 2000)
Racial diversity
Unemployment (%)
Unemployment (% change since 2000)
Unemployment (%) - White
Unemployment (%) - Black or African American
Unemployment (%) - Asian
Unemployment (%) - Hispanic or Latino
Unemployment (%) - American Indian and Alaska Native
Unemployment (%) - Multirace
Unemployment (%) - Other Race
Population density (people per square mile)
Population - Males (%)
Population - Females (%)
Population - Males (%) - White
Population - Males (%) - Black or African American
Population - Males (%) - Asian
Population - Males (%) - Hispanic or Latino
Population - Males (%) - American Indian and Alaska Native
Population - Males (%) - Multirace
Population - Males (%) - Other Race
Population - Females (%) - White
Population - Females (%) - Black or African American
Population - Females (%) - Asian
Population - Females (%) - Hispanic or Latino
Population - Females (%) - American Indian and Alaska Native
Population - Females (%) - Multirace
Population - Females (%) - Other Race
Coronavirus confirmed cases (May 20, 2024)
Deaths caused by coronavirus (May 20, 2024)
Coronavirus confirmed cases (per 100k population) (May 20, 2024)
Deaths caused by coronavirus (per 100k population) (May 20, 2024)
Daily increase in number of cases (May 20, 2024)
Weekly increase in number of cases (May 20, 2024)
Cases doubled (in days) (May 20, 2024)
Hospitalized patients (Apr 18, 2022)
Negative test results (Apr 18, 2022)
Total test results (Apr 18, 2022)
COVID Vaccine doses distributed (per 100k population) (Sep 19, 2023)
COVID Vaccine doses administered (per 100k population) (Sep 19, 2023)
COVID Vaccine doses distributed (Sep 19, 2023)
COVID Vaccine doses administered (Sep 19, 2023)
Likely homosexual households (%)
Likely homosexual households (% change since 2000)
Likely homosexual households - Lesbian couples (%)
Likely homosexual households - Lesbian couples (% change since 2000)
Likely homosexual households - Gay men (%)
Likely homosexual households - Gay men (% change since 2000)
Cost of living index
Median gross rent ($)
Median contract rent ($)
Median monthly housing costs ($)
Median house or condo value ($)
Median house or condo value ($ change since 2000)
Mean house or condo value by units in structure - 1, detached ($)
Mean house or condo value by units in structure - 1, attached ($)
Mean house or condo value by units in structure - 2 ($)
Mean house or condo value by units in structure by units in structure - 3 or 4 ($)
Mean house or condo value by units in structure - 5 or more ($)
Mean house or condo value by units in structure - Boat, RV, van, etc. ($)
Mean house or condo value by units in structure - Mobile home ($)
Median house or condo value ($) - White
Median house or condo value ($) - Black or African American
Median house or condo value ($) - Asian
Median house or condo value ($) - Hispanic or Latino
Median house or condo value ($) - American Indian and Alaska Native
Median house or condo value ($) - Multirace
Median house or condo value ($) - Other Race
Median resident age
Resident age diversity
Median resident age - Males
Median resident age - Females
Median resident age - White
Median resident age - Black or African American
Median resident age - Asian
Median resident age - Hispanic or Latino
Median resident age - American Indian and Alaska Native
Median resident age - Multirace
Median resident age - Other Race
Median resident age - Males - White
Median resident age - Males - Black or African American
Median resident age - Males - Asian
Median resident age - Males - Hispanic or Latino
Median resident age - Males - American Indian and Alaska Native
Median resident age - Males - Multirace
Median resident age - Males - Other Race
Median resident age - Females - White
Median resident age - Females - Black or African American
Median resident age - Females - Asian
Median resident age - Females - Hispanic or Latino
Median resident age - Females - American Indian and Alaska Native
Median resident age - Females - Multirace
Median resident age - Females - Other Race
Commute - mean travel time to work (minutes)
Travel time to work - Less than 5 minutes (%)
Travel time to work - Less than 5 minutes (% change since 2000)
Travel time to work - 5 to 9 minutes (%)
Travel time to work - 5 to 9 minutes (% change since 2000)
Travel time to work - 10 to 19 minutes (%)
Travel time to work - 10 to 19 minutes (% change since 2000)
Travel time to work - 20 to 29 minutes (%)
Travel time to work - 20 to 29 minutes (% change since 2000)
Travel time to work - 30 to 39 minutes (%)
Travel time to work - 30 to 39 minutes (% change since 2000)
Travel time to work - 40 to 59 minutes (%)
Travel time to work - 40 to 59 minutes (% change since 2000)
Travel time to work - 60 to 89 minutes (%)
Travel time to work - 60 to 89 minutes (% change since 2000)
Travel time to work - 90 or more minutes (%)
Travel time to work - 90 or more minutes (% change since 2000)
Marital status - Never married (%)
Marital status - Now married (%)
Marital status - Separated (%)
Marital status - Widowed (%)
Marital status - Divorced (%)
Median family income ($)
Median family income (% change since 2000)
Median non-family income ($)
Median non-family income (% change since 2000)
Median per capita income ($)
Median per capita income (% change since 2000)
Median family income ($) - White
Median family income ($) - Black or African American
Median family income ($) - Asian
Median family income ($) - Hispanic or Latino
Median family income ($) - American Indian and Alaska Native
Median family income ($) - Multirace
Median family income ($) - Other Race
Median year house/condo built
Median year apartment built
Year house built - Built 2005 or later (%)
Year house built - Built 2000 to 2004 (%)
Year house built - Built 1990 to 1999 (%)
Year house built - Built 1980 to 1989 (%)
Year house built - Built 1970 to 1979 (%)
Year house built - Built 1960 to 1969 (%)
Year house built - Built 1950 to 1959 (%)
Year house built - Built 1940 to 1949 (%)
Year house built - Built 1939 or earlier (%)
Average household size
Household density (households per square mile)
Average household size - White
Average household size - Black or African American
Average household size - Asian
Average household size - Hispanic or Latino
Average household size - American Indian and Alaska Native
Average household size - Multirace
Average household size - Other Race
Occupied housing units (%)
Vacant housing units (%)
Owner occupied housing units (%)
Renter occupied housing units (%)
Vacancy status - For rent (%)
Vacancy status - For sale only (%)
Vacancy status - Rented or sold, not occupied (%)
Vacancy status - For seasonal, recreational, or occasional use (%)
Vacancy status - For migrant workers (%)
Vacancy status - Other vacant (%)
Residents with income below the poverty level (%)
Residents with income below 50% of the poverty level (%)
Children below poverty level (%)
Poor families by family type - Married-couple family (%)
Poor families by family type - Male, no wife present (%)
Poor families by family type - Female, no husband present (%)
Poverty status for native-born residents (%)
Poverty status for foreign-born residents (%)
Poverty among high school graduates not in families (%)
Poverty among people who did not graduate high school not in families (%)
Residents with income below the poverty level (%) - White
Residents with income below the poverty level (%) - Black or African American
Residents with income below the poverty level (%) - Asian
Residents with income below the poverty level (%) - Hispanic or Latino
Residents with income below the poverty level (%) - American Indian and Alaska Native
Residents with income below the poverty level (%) - Multirace
Residents with income below the poverty level (%) - Other Race
Air pollution - Air Quality Index (AQI)
Air pollution - CO
Air pollution - NO2
Air pollution - SO2
Air pollution - Ozone
Air pollution - PM10
Air pollution - PM25
Air pollution - Pb
Crime - Murders per 100,000 population
Crime - Rapes per 100,000 population
Crime - Robberies per 100,000 population
Crime - Assaults per 100,000 population
Crime - Burglaries per 100,000 population
Crime - Thefts per 100,000 population
Crime - Auto thefts per 100,000 population
Crime - Arson per 100,000 population
Crime - City-data.com crime index
Crime - Violent crime index
Crime - Property crime index
Crime - Murders per 100,000 population (5 year average)
Crime - Rapes per 100,000 population (5 year average)
Crime - Robberies per 100,000 population (5 year average)
Crime - Assaults per 100,000 population (5 year average)
Crime - Burglaries per 100,000 population (5 year average)
Crime - Thefts per 100,000 population (5 year average)
Crime - Auto thefts per 100,000 population (5 year average)
Crime - Arson per 100,000 population (5 year average)
Crime - City-data.com crime index (5 year average)
Crime - Violent crime index (5 year average)
Crime - Property crime index (5 year average)
1996 Presidential Elections Results (%) - Democratic Party (Clinton)
1996 Presidential Elections Results (%) - Republican Party (Dole)
1996 Presidential Elections Results (%) - Other
2000 Presidential Elections Results (%) - Democratic Party (Gore)
2000 Presidential Elections Results (%) - Republican Party (Bush)
2000 Presidential Elections Results (%) - Other
2004 Presidential Elections Results (%) - Democratic Party (Kerry)
2004 Presidential Elections Results (%) - Republican Party (Bush)
2004 Presidential Elections Results (%) - Other
2008 Presidential Elections Results (%) - Democratic Party (Obama)
2008 Presidential Elections Results (%) - Republican Party (McCain)
2008 Presidential Elections Results (%) - Other
2012 Presidential Elections Results (%) - Democratic Party (Obama)
2012 Presidential Elections Results (%) - Republican Party (Romney)
2012 Presidential Elections Results (%) - Other
2016 Presidential Elections Results (%) - Democratic Party (Clinton)
2016 Presidential Elections Results (%) - Republican Party (Trump)
2016 Presidential Elections Results (%) - Other
2020 Presidential Elections Results (%) - Democratic Party (Biden)
2020 Presidential Elections Results (%) - Republican Party (Trump)
2020 Presidential Elections Results (%) - Other
Ancestries Reported - Arab (%)
Ancestries Reported - Czech (%)
Ancestries Reported - Danish (%)
Ancestries Reported - Dutch (%)
Ancestries Reported - English (%)
Ancestries Reported - French (%)
Ancestries Reported - French Canadian (%)
Ancestries Reported - German (%)
Ancestries Reported - Greek (%)
Ancestries Reported - Hungarian (%)
Ancestries Reported - Irish (%)
Ancestries Reported - Italian (%)
Ancestries Reported - Lithuanian (%)
Ancestries Reported - Norwegian (%)
Ancestries Reported - Polish (%)
Ancestries Reported - Portuguese (%)
Ancestries Reported - Russian (%)
Ancestries Reported - Scotch-Irish (%)
Ancestries Reported - Scottish (%)
Ancestries Reported - Slovak (%)
Ancestries Reported - Subsaharan African (%)
Ancestries Reported - Swedish (%)
Ancestries Reported - Swiss (%)
Ancestries Reported - Ukrainian (%)
Ancestries Reported - United States (%)
Ancestries Reported - Welsh (%)
Ancestries Reported - West Indian (%)
Ancestries Reported - Other (%)
Educational Attainment - No schooling completed (%)
Educational Attainment - Less than high school (%)
Educational Attainment - High school or equivalent (%)
Educational Attainment - Less than 1 year of college (%)
Educational Attainment - 1 or more years of college (%)
Educational Attainment - Associate degree (%)
Educational Attainment - Bachelor's degree (%)
Educational Attainment - Master's degree (%)
Educational Attainment - Professional school degree (%)
Educational Attainment - Doctorate degree (%)
School Enrollment - Nursery, preschool (%)
School Enrollment - Kindergarten (%)
School Enrollment - Grade 1 to 4 (%)
School Enrollment - Grade 5 to 8 (%)
School Enrollment - Grade 9 to 12 (%)
School Enrollment - College undergrad (%)
School Enrollment - Graduate or professional (%)
School Enrollment - Not enrolled in school (%)
School enrollment - Public schools (%)
School enrollment - Private schools (%)
School enrollment - Not enrolled (%)
Median number of rooms in houses and condos
Median number of rooms in apartments
Housing units lacking complete plumbing facilities (%)
Housing units lacking complete kitchen facilities (%)
Density of houses
Urban houses (%)
Rural houses (%)
Households with people 60 years and over (%)
Households with people 65 years and over (%)
Households with people 75 years and over (%)
Households with one or more nonrelatives (%)
Households with no nonrelatives (%)
Population in households (%)
Family households (%)
Nonfamily households (%)
Population in families (%)
Family households with own children (%)
Median number of bedrooms in owner occupied houses
Mean number of bedrooms in owner occupied houses
Median number of bedrooms in renter occupied houses
Mean number of bedrooms in renter occupied houses
Median number of vehichles in owner occupied houses
Mean number of vehichles in owner occupied houses
Median number of vehichles in renter occupied houses
Mean number of vehichles in renter occupied houses
Mortgage status - with mortgage (%)
Mortgage status - with second mortgage (%)
Mortgage status - with home equity loan (%)
Mortgage status - with both second mortgage and home equity loan (%)
Mortgage status - without a mortgage (%)
Average family size
Average family size - White
Average family size - Black or African American
Average family size - Asian
Average family size - Hispanic or Latino
Average family size - American Indian and Alaska Native
Average family size - Multirace
Average family size - Other Race
Geographical mobility - Same house 1 year ago (%)
Geographical mobility - Moved within same county (%)
Geographical mobility - Moved from different county within same state (%)
Geographical mobility - Moved from different state (%)
Geographical mobility - Moved from abroad (%)
Place of birth - Born in state of residence (%)
Place of birth - Born in other state (%)
Place of birth - Native, outside of US (%)
Place of birth - Foreign born (%)
Housing units in structures - 1, detached (%)
Housing units in structures - 1, attached (%)
Housing units in structures - 2 (%)
Housing units in structures - 3 or 4 (%)
Housing units in structures - 5 to 9 (%)
Housing units in structures - 10 to 19 (%)
Housing units in structures - 20 to 49 (%)
Housing units in structures - 50 or more (%)
Housing units in structures - Mobile home (%)
Housing units in structures - Boat, RV, van, etc. (%)
House/condo owner moved in on average (years ago)
Renter moved in on average (years ago)
Year householder moved into unit - Moved in 1999 to March 2000 (%)
Year householder moved into unit - Moved in 1995 to 1998 (%)
Year householder moved into unit - Moved in 1990 to 1994 (%)
Year householder moved into unit - Moved in 1980 to 1989 (%)
Year householder moved into unit - Moved in 1970 to 1979 (%)
Year householder moved into unit - Moved in 1969 or earlier (%)
Means of transportation to work - Drove car alone (%)
Means of transportation to work - Carpooled (%)
Means of transportation to work - Public transportation (%)
Means of transportation to work - Bus or trolley bus (%)
Means of transportation to work - Streetcar or trolley car (%)
Means of transportation to work - Subway or elevated (%)
Means of transportation to work - Railroad (%)
Means of transportation to work - Ferryboat (%)
Means of transportation to work - Taxicab (%)
Means of transportation to work - Motorcycle (%)
Means of transportation to work - Bicycle (%)
Means of transportation to work - Walked (%)
Means of transportation to work - Other means (%)
Working at home (%)
Industry diversity
Most Common Industries - Agriculture, forestry, fishing and hunting, and mining (%)
Most Common Industries - Agriculture, forestry, fishing and hunting (%)
Most Common Industries - Mining, quarrying, and oil and gas extraction (%)
Most Common Industries - Construction (%)
Most Common Industries - Manufacturing (%)
Most Common Industries - Wholesale trade (%)
Most Common Industries - Retail trade (%)
Most Common Industries - Transportation and warehousing, and utilities (%)
Most Common Industries - Transportation and warehousing (%)
Most Common Industries - Utilities (%)
Most Common Industries - Information (%)
Most Common Industries - Finance and insurance, and real estate and rental and leasing (%)
Most Common Industries - Finance and insurance (%)
Most Common Industries - Real estate and rental and leasing (%)
Most Common Industries - Professional, scientific, and management, and administrative and waste management services (%)
Most Common Industries - Professional, scientific, and technical services (%)
Most Common Industries - Management of companies and enterprises (%)
Most Common Industries - Administrative and support and waste management services (%)
Most Common Industries - Educational services, and health care and social assistance (%)
Most Common Industries - Educational services (%)
Most Common Industries - Health care and social assistance (%)
Most Common Industries - Arts, entertainment, and recreation, and accommodation and food services (%)
Most Common Industries - Arts, entertainment, and recreation (%)
Most Common Industries - Accommodation and food services (%)
Most Common Industries - Other services, except public administration (%)
Most Common Industries - Public administration (%)
Occupation diversity
Most Common Occupations - Management, business, science, and arts occupations (%)
Most Common Occupations - Management, business, and financial occupations (%)
Most Common Occupations - Management occupations (%)
Most Common Occupations - Business and financial operations occupations (%)
Most Common Occupations - Computer, engineering, and science occupations (%)
Most Common Occupations - Computer and mathematical occupations (%)
Most Common Occupations - Architecture and engineering occupations (%)
Most Common Occupations - Life, physical, and social science occupations (%)
Most Common Occupations - Education, legal, community service, arts, and media occupations (%)
Most Common Occupations - Community and social service occupations (%)
Most Common Occupations - Legal occupations (%)
Most Common Occupations - Education, training, and library occupations (%)
Most Common Occupations - Arts, design, entertainment, sports, and media occupations (%)
Most Common Occupations - Healthcare practitioners and technical occupations (%)
Most Common Occupations - Health diagnosing and treating practitioners and other technical occupations (%)
Most Common Occupations - Health technologists and technicians (%)
Most Common Occupations - Service occupations (%)
Most Common Occupations - Healthcare support occupations (%)
Most Common Occupations - Protective service occupations (%)
Most Common Occupations - Fire fighting and prevention, and other protective service workers including supervisors (%)
Most Common Occupations - Law enforcement workers including supervisors (%)
Most Common Occupations - Food preparation and serving related occupations (%)
Most Common Occupations - Building and grounds cleaning and maintenance occupations (%)
Most Common Occupations - Personal care and service occupations (%)
Most Common Occupations - Sales and office occupations (%)
Most Common Occupations - Sales and related occupations (%)
Most Common Occupations - Office and administrative support occupations (%)
Most Common Occupations - Natural resources, construction, and maintenance occupations (%)
Most Common Occupations - Farming, fishing, and forestry occupations (%)
Most Common Occupations - Construction and extraction occupations (%)
Most Common Occupations - Installation, maintenance, and repair occupations (%)
Most Common Occupations - Production, transportation, and material moving occupations (%)
Most Common Occupations - Production occupations (%)
Most Common Occupations - Transportation occupations (%)
Most Common Occupations - Material moving occupations (%)
People in Group quarters - Institutionalized population (%)
People in Group quarters - Correctional institutions (%)
People in Group quarters - Federal prisons and detention centers (%)
People in Group quarters - Halfway houses (%)
People in Group quarters - Local jails and other confinement facilities (including police lockups) (%)
People in Group quarters - Military disciplinary barracks (%)
People in Group quarters - State prisons (%)
People in Group quarters - Other types of correctional institutions (%)
People in Group quarters - Nursing homes (%)
People in Group quarters - Hospitals/wards, hospices, and schools for the handicapped (%)
People in Group quarters - Hospitals/wards and hospices for chronically ill (%)
People in Group quarters - Hospices or homes for chronically ill (%)
People in Group quarters - Military hospitals or wards for chronically ill (%)
People in Group quarters - Other hospitals or wards for chronically ill (%)
People in Group quarters - Hospitals or wards for drug/alcohol abuse (%)
People in Group quarters - Mental (Psychiatric) hospitals or wards (%)
People in Group quarters - Schools, hospitals, or wards for the mentally retarded (%)
People in Group quarters - Schools, hospitals, or wards for the physically handicapped (%)
People in Group quarters - Institutions for the deaf (%)
People in Group quarters - Institutions for the blind (%)
People in Group quarters - Orthopedic wards and institutions for the physically handicapped (%)
People in Group quarters - Wards in general hospitals for patients who have no usual home elsewhere (%)
People in Group quarters - Wards in military hospitals for patients who have no usual home elsewhere (%)
People in Group quarters - Juvenile institutions (%)
People in Group quarters - Long-term care (%)
People in Group quarters - Homes for abused, dependent, and neglected children (%)
People in Group quarters - Residential treatment centers for emotionally disturbed children (%)
People in Group quarters - Training schools for juvenile delinquents (%)
People in Group quarters - Short-term care, detention or diagnostic centers for delinquent children (%)
People in Group quarters - Type of juvenile institution unknown (%)
People in Group quarters - Noninstitutionalized population (%)
People in Group quarters - College dormitories (includes college quarters off campus) (%)
People in Group quarters - Military quarters (%)
People in Group quarters - On base (%)
People in Group quarters - Barracks, unaccompanied personnel housing (UPH), (Enlisted/Officer), ;and similar group living quarters for military personnel (%)
People in Group quarters - Transient quarters for temporary residents (%)
People in Group quarters - Military ships (%)
People in Group quarters - Group homes (%)
People in Group quarters - Homes or halfway houses for drug/alcohol abuse (%)
People in Group quarters - Homes for the mentally ill (%)
People in Group quarters - Homes for the mentally retarded (%)
People in Group quarters - Homes for the physically handicapped (%)
People in Group quarters - Other group homes (%)
People in Group quarters - Religious group quarters (%)
People in Group quarters - Dormitories (%)
People in Group quarters - Agriculture workers' dormitories on farms (%)
People in Group quarters - Job Corps and vocational training facilities (%)
People in Group quarters - Other workers' dormitories (%)
People in Group quarters - Crews of maritime vessels (%)
People in Group quarters - Other nonhousehold living situations (%)
People in Group quarters - Other noninstitutional group quarters (%)
Residents speaking English at home (%)
Residents speaking English at home - Born in the United States (%)
Residents speaking English at home - Native, born elsewhere (%)
Residents speaking English at home - Foreign born (%)
Residents speaking Spanish at home (%)
Residents speaking Spanish at home - Born in the United States (%)
Residents speaking Spanish at home - Native, born elsewhere (%)
Residents speaking Spanish at home - Foreign born (%)
Residents speaking other language at home (%)
Residents speaking other language at home - Born in the United States (%)
Residents speaking other language at home - Native, born elsewhere (%)
Residents speaking other language at home - Foreign born (%)
Class of Workers - Employee of private company (%)
Class of Workers - Self-employed in own incorporated business (%)
Class of Workers - Private not-for-profit wage and salary workers (%)
Class of Workers - Local government workers (%)
Class of Workers - State government workers (%)
Class of Workers - Federal government workers (%)
Class of Workers - Self-employed workers in own not incorporated business and Unpaid family workers (%)
House heating fuel used in houses and condos - Utility gas (%)
House heating fuel used in houses and condos - Bottled, tank, or LP gas (%)
House heating fuel used in houses and condos - Electricity (%)
House heating fuel used in houses and condos - Fuel oil, kerosene, etc. (%)
House heating fuel used in houses and condos - Coal or coke (%)
House heating fuel used in houses and condos - Wood (%)
House heating fuel used in houses and condos - Solar energy (%)
House heating fuel used in houses and condos - Other fuel (%)
House heating fuel used in houses and condos - No fuel used (%)
House heating fuel used in apartments - Utility gas (%)
House heating fuel used in apartments - Bottled, tank, or LP gas (%)
House heating fuel used in apartments - Electricity (%)
House heating fuel used in apartments - Fuel oil, kerosene, etc. (%)
House heating fuel used in apartments - Coal or coke (%)
House heating fuel used in apartments - Wood (%)
House heating fuel used in apartments - Solar energy (%)
House heating fuel used in apartments - Other fuel (%)
House heating fuel used in apartments - No fuel used (%)
Armed forces status - In Armed Forces (%)
Armed forces status - Civilian (%)
Armed forces status - Civilian - Veteran (%)
Armed forces status - Civilian - Nonveteran (%)
Fatal accidents locations in years 2005-2021
Fatal accidents locations in 2005
Fatal accidents locations in 2006
Fatal accidents locations in 2007
Fatal accidents locations in 2008
Fatal accidents locations in 2009
Fatal accidents locations in 2010
Fatal accidents locations in 2011
Fatal accidents locations in 2012
Fatal accidents locations in 2013
Fatal accidents locations in 2014
Fatal accidents locations in 2015
Fatal accidents locations in 2016
Fatal accidents locations in 2017
Fatal accidents locations in 2018
Fatal accidents locations in 2019
Fatal accidents locations in 2020
Fatal accidents locations in 2021
Alcohol use - People drinking some alcohol every month (%)
Alcohol use - People not drinking at all (%)
Alcohol use - Average days/month drinking alcohol
Alcohol use - Average drinks/week
Alcohol use - Average days/year people drink much
Audiometry - Average condition of hearing (%)
Audiometry - People that can hear a whisper from across a quiet room (%)
Audiometry - People that can hear normal voice from across a quiet room (%)
Audiometry - Ears ringing, roaring, buzzing (%)
Audiometry - Had a job exposure to loud noise (%)
Audiometry - Had off-work exposure to loud noise (%)
Blood Pressure & Cholesterol - Has high blood pressure (%)
Blood Pressure & Cholesterol - Checking blood pressure at home (%)
Blood Pressure & Cholesterol - Frequently checking blood cholesterol (%)
Blood Pressure & Cholesterol - Has high cholesterol level (%)
Consumer Behavior - Money monthly spent on food at supermarket/grocery store
Consumer Behavior - Money monthly spent on food at other stores
Consumer Behavior - Money monthly spent on eating out
Consumer Behavior - Money monthly spent on carryout/delivered foods
Consumer Behavior - Income spent on food at supermarket/grocery store (%)
Consumer Behavior - Income spent on food at other stores (%)
Consumer Behavior - Income spent on eating out (%)
Consumer Behavior - Income spent on carryout/delivered foods (%)
Current Health Status - General health condition (%)
Current Health Status - Blood donors (%)
Current Health Status - Has blood ever tested for HIV virus (%)
Current Health Status - Left-handed people (%)
Dermatology - People using sunscreen (%)
Diabetes - Diabetics (%)
Diabetes - Had a blood test for high blood sugar (%)
Diabetes - People taking insulin (%)
Diet Behavior & Nutrition - Diet health (%)
Diet Behavior & Nutrition - Milk product consumption (# of products/month)
Diet Behavior & Nutrition - Meals not home prepared (#/week)
Diet Behavior & Nutrition - Meals from fast food or pizza place (#/week)
Diet Behavior & Nutrition - Ready-to-eat foods (#/month)
Diet Behavior & Nutrition - Frozen meals/pizza (#/month)
Drug Use - People that ever used marijuana or hashish (%)
Drug Use - Ever used hard drugs (%)
Drug Use - Ever used any form of cocaine (%)
Drug Use - Ever used heroin (%)
Drug Use - Ever used methamphetamine (%)
Health Insurance - People covered by health insurance (%)
Kidney Conditions-Urology - Avg. # of times urinating at night
Medical Conditions - People with asthma (%)
Medical Conditions - People with anemia (%)
Medical Conditions - People with psoriasis (%)
Medical Conditions - People with overweight (%)
Medical Conditions - Elderly people having difficulties in thinking or remembering (%)
Medical Conditions - People who ever received blood transfusion (%)
Medical Conditions - People having trouble seeing even with glass/contacts (%)
Medical Conditions - People with arthritis (%)
Medical Conditions - People with gout (%)
Medical Conditions - People with congestive heart failure (%)
Medical Conditions - People with coronary heart disease (%)
Medical Conditions - People with angina pectoris (%)
Medical Conditions - People who ever had heart attack (%)
Medical Conditions - People who ever had stroke (%)
Medical Conditions - People with emphysema (%)
Medical Conditions - People with thyroid problem (%)
Medical Conditions - People with chronic bronchitis (%)
Medical Conditions - People with any liver condition (%)
Medical Conditions - People who ever had cancer or malignancy (%)
Mental Health - People who have little interest in doing things (%)
Mental Health - People feeling down, depressed, or hopeless (%)
Mental Health - People who have trouble sleeping or sleeping too much (%)
Mental Health - People feeling tired or having little energy (%)
Mental Health - People with poor appetite or overeating (%)
Mental Health - People feeling bad about themself (%)
Mental Health - People who have trouble concentrating on things (%)
Mental Health - People moving or speaking slowly or too fast (%)
Mental Health - People having thoughts they would be better off dead (%)
Oral Health - Average years since last visit a dentist
Oral Health - People embarrassed because of mouth (%)
Oral Health - People with gum disease (%)
Oral Health - General health of teeth and gums (%)
Oral Health - Average days a week using dental floss/device
Oral Health - Average days a week using mouthwash for dental problem
Oral Health - Average number of teeth
Pesticide Use - Households using pesticides to control insects (%)
Pesticide Use - Households using pesticides to kill weeds (%)
Physical Activity - People doing vigorous-intensity work activities (%)
Physical Activity - People doing moderate-intensity work activities (%)
Physical Activity - People walking or bicycling (%)
Physical Activity - People doing vigorous-intensity recreational activities (%)
Physical Activity - People doing moderate-intensity recreational activities (%)
Physical Activity - Average hours a day doing sedentary activities
Physical Activity - Average hours a day watching TV or videos
Physical Activity - Average hours a day using computer
Physical Functioning - People having limitations keeping them from working (%)
Physical Functioning - People limited in amount of work they can do (%)
Physical Functioning - People that need special equipment to walk (%)
Physical Functioning - People experiencing confusion/memory problems (%)
Physical Functioning - People requiring special healthcare equipment (%)
Prescription Medications - Average number of prescription medicines taking
Preventive Aspirin Use - Adults 40+ taking low-dose aspirin (%)
Reproductive Health - Vaginal deliveries (%)
Reproductive Health - Cesarean deliveries (%)
Reproductive Health - Deliveries resulted in a live birth (%)
Reproductive Health - Pregnancies resulted in a delivery (%)
Reproductive Health - Women breastfeeding newborns (%)
Reproductive Health - Women that had a hysterectomy (%)
Reproductive Health - Women that had both ovaries removed (%)
Reproductive Health - Women that have ever taken birth control pills (%)
Reproductive Health - Women taking birth control pills (%)
Reproductive Health - Women that have ever used Depo-Provera or injectables (%)
Reproductive Health - Women that have ever used female hormones (%)
Sexual Behavior - People 18+ that ever had sex (vaginal, anal, or oral) (%)
Sexual Behavior - Males 18+ that ever had vaginal sex with a woman (%)
Sexual Behavior - Males 18+ that ever performed oral sex on a woman (%)
Sexual Behavior - Males 18+ that ever had anal sex with a woman (%)
Sexual Behavior - Males 18+ that ever had any sex with a man (%)
Sexual Behavior - Females 18+ that ever had vaginal sex with a man (%)
Sexual Behavior - Females 18+ that ever performed oral sex on a man (%)
Sexual Behavior - Females 18+ that ever had anal sex with a man (%)
Sexual Behavior - Females 18+ that ever had any kind of sex with a woman (%)
Sexual Behavior - Average age people first had sex
Sexual Behavior - Average number of female sex partners in lifetime (males 18+)
Sexual Behavior - Average number of female vaginal sex partners in lifetime (males 18+)
Sexual Behavior - Average age people first performed oral sex on a woman (18+)
Sexual Behavior - Average number of woman performed oral sex on in lifetime (18+)
Sexual Behavior - Average number of male sex partners in lifetime (males 18+)
Sexual Behavior - Average number of male anal sex partners in lifetime (males 18+)
Sexual Behavior - Average age people first performed oral sex on a man (18+)
Sexual Behavior - Average number of male oral sex partners in lifetime (18+)
Sexual Behavior - People using protection when performing oral sex (%)
Sexual Behavior - Average number of times people have vaginal or anal sex a year
Sexual Behavior - People having sex without condom (%)
Sexual Behavior - Average number of male sex partners in lifetime (females 18+)
Sexual Behavior - Average number of male vaginal sex partners in lifetime (females 18+)
Sexual Behavior - Average number of female sex partners in lifetime (females 18+)
Sexual Behavior - Circumcised males 18+ (%)
Sleep Disorders - Average hours sleeping at night
Sleep Disorders - People that has trouble sleeping (%)
Smoking-Cigarette Use - People smoking cigarettes (%)
Taste & Smell - People 40+ having problems with smell (%)
Taste & Smell - People 40+ having problems with taste (%)
Taste & Smell - People 40+ that ever had wisdom teeth removed (%)
Taste & Smell - People 40+ that ever had tonsils teeth removed (%)
Taste & Smell - People 40+ that ever had a loss of consciousness because of a head injury (%)
Taste & Smell - People 40+ that ever had a broken nose or other serious injury to face or skull (%)
Taste & Smell - People 40+ that ever had two or more sinus infections (%)
Weight - Average height (inches)
Weight - Average weight (pounds)
Weight - Average BMI
Weight - People that are obese (%)
Weight - People that ever were obese (%)
Weight - People trying to lose weight (%)
Urban population: 23,959
Rural population: 2,348
Estimated median house/condo value in 2022: $212,033
28083:
$212,033North Carolina:
$280,600
Median resident age: This zip code:
37.9 yearsNorth Carolina median age:
39.2 years
Average household size: This zip code:
2.6 peopleNorth Carolina:
2.4 people
Averages for the 2020 tax year for zip code 28083, filed in 2021:
Average Adjusted Gross Income (AGI) in 2020: $42,864 (Individual Income Tax Returns) Here:
$42,864State:
$70,020
Salary/wage: $39,835 (reported on 86.1% of returns )Here:
$39,835State:
$58,387
(% of AGI for various income ranges: 1171.9% for AGIs below $25k , 3861.6% for AGIs $25k-50k , 6910.4% for AGIs $50k-75k , 10068.7% for AGIs $75k-100k , 18733.7% for AGIs $100k-200k , 57863.3% for AGIs over 200k ) Taxable interest for individuals: $642 (reported on 16.7% of returns )This zip code:
$642North Carolina:
$1,479
(% of AGI for various income ranges: 6.7% for AGIs below $25k , 4.9% for AGIs $25k-50k , 15.5% for AGIs $50k-75k , 44.4% for AGIs $75k-100k , 66.7% for AGIs $100k-200k , 446.7% for AGIs over 200k ) Ordinary dividends: $2,983 (reported on 8.2% of returns )(% of AGI for various income ranges: 9.6% for AGIs below $25k , 8.1% for AGIs $25k-50k , 27.2% for AGIs $50k-75k , 57.4% for AGIs $75k-100k , 144.4% for AGIs $100k-200k , 3340.0% for AGIs over 200k ) Net capital gain/loss in AGI: +$8,969 (reported on 7.2% of returns )Here:
+$8,969State:
+$23,652
(% of AGI for various income ranges: 2.4% for AGIs below $25k , 10.2% for AGIs $25k-50k , 27.3% for AGIs $50k-75k , 55.8% for AGIs $75k-100k , 550.0% for AGIs $100k-200k , 14390.0% for AGIs over 200k ) Profit/loss from business: +$7,672 (reported on 15.8% of returns )Here:
+$7,672State:
+$11,710
(% of AGI for various income ranges: 152.2% for AGIs below $25k , 103.6% for AGIs $25k-50k , 181.8% for AGIs $50k-75k , 164.0% for AGIs $75k-100k , 338.8% for AGIs $100k-200k , 3240.0% for AGIs over 200k ) Taxable individual retirement arrangement distribution: $13,953 (reported on 6.1% of returns )28083:
$13,953North Carolina:
$20,247
(% of AGI for various income ranges: 41.7% for AGIs below $25k , 59.4% for AGIs $25k-50k , 138.3% for AGIs $50k-75k , 249.5% for AGIs $75k-100k , 820.9% for AGIs $100k-200k ) Total itemized deductions: $25,522 (reported on 3.8% of returns )Here:
$25,522State:
$34,549
(% of AGI for various income ranges: 13.2% for AGIs below $25k , 72.8% for AGIs $25k-50k , 178.4% for AGIs $50k-75k , 279.5% for AGIs $75k-100k , 830.9% for AGIs $100k-200k , 4300.0% for AGIs over 200k ) Charity contributions: $9,264 (reported on 3.2% of returns )(% of AGI for various income ranges: 2.0% for AGIs below $25k , 16.6% for AGIs $25k-50k , 39.0% for AGIs $50k-75k , 83.4% for AGIs $75k-100k , 311.2% for AGIs $100k-200k , 2156.7% for AGIs over 200k ) Taxes paid: $6,309 (reported on 3.8% of returns )(% of AGI for various income ranges: 1.9% for AGIs below $25k , 12.0% for AGIs $25k-50k , 47.3% for AGIs $50k-75k , 75.5% for AGIs $75k-100k , 244.7% for AGIs $100k-200k , 986.7% for AGIs over 200k ) Earned income credit: $2,421 (reported on 24.7% of returns )(% of AGI for various income ranges: 130.6% for AGIs below $25k , 78.2% for AGIs $25k-50k , 1.3% for AGIs $50k-75k ) Percentage of individuals using paid preparers for their 2020 taxes: 95.0%(% for various income ranges: 94.5% for AGIs below $25k , 95.0% for AGIs $25k-50k , 95.1% for AGIs $50k-75k , 96.6% for AGIs $75k-100k , 94.9% for AGIs $100k-200k , 100.0% for AGIs over 200k )
Averages for the 2012 tax year for zip code 28083, filed in 2013:
Average Adjusted Gross Income (AGI) in 2012: $36,182 (Individual Income Tax Returns) Here:
$36,182State:
$54,937
Salary/wage: $33,324 (reported on 87.0% of returns )Here:
$33,324State:
$46,336
(% of AGI for various income ranges: 77.3% for AGIs below $25k , 84.4% for AGIs $25k-50k , 83.7% for AGIs $50k-75k , 80.0% for AGIs $75k-100k , 77.7% for AGIs $100k-200k , 38.0% for AGIs over 200k ) Taxable interest for individuals: $547 (reported on 21.3% of returns )This zip code:
$547North Carolina:
$1,298
(% of AGI for various income ranges: 0.6% for AGIs below $25k , 0.2% for AGIs $25k-50k , 0.3% for AGIs $50k-75k , 0.2% for AGIs $75k-100k , 0.2% for AGIs $100k-200k , 1.0% for AGIs over 200k ) Ordinary dividends: $2,502 (reported on 9.6% of returns )(% of AGI for various income ranges: 0.6% for AGIs below $25k , 0.4% for AGIs $25k-50k , 0.4% for AGIs $50k-75k , 0.5% for AGIs $75k-100k , 0.8% for AGIs $100k-200k , 5.9% for AGIs over 200k ) Net capital gain/loss in AGI: +$1,951 (reported on 6.3% of returns )Here:
+$1,951State:
+$12,740
(% of AGI for various income ranges: 0.5% for AGIs $75k-100k , 1.6% for AGIs $100k-200k , 1.1% for AGIs over 200k ) Profit/loss from business: +$6,301 (reported on 14.6% of returns )Here:
+$6,301State:
+$10,311
(% of AGI for various income ranges: 7.3% for AGIs below $25k , 2.0% for AGIs $25k-50k , 0.7% for AGIs $50k-75k , 1.0% for AGIs $75k-100k , 3.1% for AGIs $100k-200k ) Taxable individual retirement arrangement distribution: $11,418 (reported on 8.3% of returns )28083:
$11,418North Carolina:
$15,575
(% of AGI for various income ranges: 2.4% for AGIs below $25k , 2.1% for AGIs $25k-50k , 2.1% for AGIs $50k-75k , 3.4% for AGIs $75k-100k , 4.5% for AGIs $100k-200k ) Total itemized deductions: $17,420 (27% of AGI, reported on 27.9% of returns )Here:
$17,420State:
$23,438
Here:
27.0% of AGIState:
21.5% of AGI
(% of AGI for various income ranges: 7.2% for AGIs below $25k , 11.3% for AGIs $25k-50k , 15.4% for AGIs $50k-75k , 17.0% for AGIs $75k-100k , 17.0% for AGIs $100k-200k , 19.1% for AGIs over 200k ) Charity contributions: $3,739 (reported on 24.0% of returns )(% of AGI for various income ranges: 1.0% for AGIs below $25k , 1.9% for AGIs $25k-50k , 2.9% for AGIs $50k-75k , 3.2% for AGIs $75k-100k , 3.9% for AGIs $100k-200k , 3.0% for AGIs over 200k ) Taxes paid: $5,244 (reported on 27.9% of returns )(% of AGI for various income ranges: 1.2% for AGIs below $25k , 2.7% for AGIs $25k-50k , 4.5% for AGIs $50k-75k , 5.8% for AGIs $75k-100k , 6.9% for AGIs $100k-200k , 7.4% for AGIs over 200k ) Earned income credit: $2,414 (reported on 29.4% of returns )(% of AGI for various income ranges: 9.2% for AGIs below $25k , 1.4% for AGIs $25k-50k ) Percentage of individuals using paid preparers for their 2012 taxes: 62.4%(% for various income ranges: 62.9% for AGIs below $25k , 59.4% for AGIs $25k-50k , 62.5% for AGIs $50k-75k , 68.9% for AGIs $75k-100k , 64.3% for AGIs $100k-200k , 100.0% for AGIs over 200k )
Averages for the 2004 tax year for zip code 28083, filed in 2005:
Average Adjusted Gross Income (AGI) in 2004: $33,849 (Individual Income Tax Returns) Here:
$33,849State:
$45,376
Salary/wage: $31,525 (reported on 87.1% of returns )Here:
$31,525State:
$39,442
(% of AGI for various income ranges: 90.6% for AGIs below $10k , 77.7% for AGIs $10k-25k , 86.2% for AGIs $25k-50k , 85.3% for AGIs $50k-75k , 84.6% for AGIs $75k-100k , 61.7% for AGIs over 100k ) Taxable interest for individuals: $888 (reported on 29.4% of returns )This zip code:
$888North Carolina:
$1,515
(% of AGI for various income ranges: 2.5% for AGIs below $10k , 1.1% for AGIs $10k-25k , 0.7% for AGIs $25k-50k , 0.6% for AGIs $50k-75k , 0.4% for AGIs $75k-100k , 1.0% for AGIs over 100k ) Taxable dividends: $2,183 (reported on 14.1% of returns )(% of AGI for various income ranges: 1.5% for AGIs below $10k , 0.7% for AGIs $10k-25k , 0.6% for AGIs $25k-50k , 0.6% for AGIs $50k-75k , 0.7% for AGIs $75k-100k , 2.5% for AGIs over 100k ) Net capital gain/loss: +$5,114 (reported on 9.9% of returns )Here:
+$5,114State:
+$11,152
(% of AGI for various income ranges: -0.4% for AGIs below $10k , 0.1% for AGIs $10k-25k , 0.3% for AGIs $25k-50k , 0.7% for AGIs $50k-75k , 1.1% for AGIs $75k-100k , 7.9% for AGIs over 100k ) Profit/loss from business: +$4,523 (reported on 12.5% of returns )Here:
+$4,523State:
+$9,490
(% of AGI for various income ranges: 2.1% for AGIs below $10k , 3.0% for AGIs $10k-25k , 1.4% for AGIs $25k-50k , 1.0% for AGIs $50k-75k , 1.5% for AGIs $75k-100k , 1.9% for AGIs over 100k ) IRA payment deduction: $2,777 (reported on 1.3% of returns )28083:
$2,777North Carolina:
$2,967
(% of AGI for various income ranges: 0.1% for AGIs $10k-25k , 0.1% for AGIs $25k-50k , 0.1% for AGIs $50k-75k , 0.1% for AGIs $75k-100k , 0.1% for AGIs over 100k ) Total itemized deductions: $15,486 (27% of AGI, reported on 34.8% of returns )Here:
$15,486State:
$19,464
Here:
27.1% of AGIState:
22.7% of AGI
(% of AGI for various income ranges: 9.3% for AGIs below $10k , 10.6% for AGIs $10k-25k , 15.7% for AGIs $25k-50k , 17.8% for AGIs $50k-75k , 18.0% for AGIs $75k-100k , 18.5% for AGIs over 100k ) Charity contributions deductions: $3,145 (5% of AGI, reported on 30.8% of returns )Here:
5.3% of AGIState:
4.5% of AGI
(% of AGI for various income ranges: 1.0% for AGIs below $10k , 1.7% for AGIs $10k-25k , 2.7% for AGIs $25k-50k , 3.3% for AGIs $50k-75k , 3.3% for AGIs $75k-100k , 3.5% for AGIs over 100k ) Total tax: $3,896 (reported on 67.4% of returns )(% of AGI for various income ranges: 2.1% for AGIs below $10k , 3.1% for AGIs $10k-25k , 5.8% for AGIs $25k-50k , 8.0% for AGIs $50k-75k , 10.0% for AGIs $75k-100k , 15.7% for AGIs over 100k ) Earned income credit: $1,899 (reported on 23.7% of returns )Percentage of individuals using paid preparers for their 2004 taxes: 70.1%(% for various income ranges: 66.4% for AGIs below $10k , 73.3% for AGIs $10k-25k , 68.4% for AGIs $25k-50k , 70.8% for AGIs $50k-75k , 69.2% for AGIs $75k-100k , 71.6% for AGIs over 100k )
Estimated median household income in 2022: This zip code:
$58,170North Carolina:
$67,481
Nearest zip codes: 28088 ,
28023 ,
28081 ,
28025 ,
28027 ,
28138 .
Landis Zip Code Map
Percentage of family households: This zip code:
42.9%North Carolina:
46.1%
Percentage of households with unmarried partners: This zip code:
8.0%North Carolina:
47.9%
Likely homosexual households (counted as self-reported same-sex unmarried-partner households)
Lesbian couples: 0.2% of all households Gay men: 0.2% of all households
Household received Food Stamps/SNAP in the past 12 months: 1,568Household did not receive Food Stamps/SNAP in the past 12 months: 8,375
Women who had a birth in the past 12 months: 166 (155 now married , 13 unmarried) Women who did not have a birth in the past 12 months: 5,627 (1,963 now married , 3,654 unmarried)
Housing units in zip code 28083 with a mortgage: 4,078 (261
second mortgage , 202
both second mortgage and home equity loan )
Houses without a mortgage: 29
Median monthly owner costs for units with a mortgage: $1,139
Median monthly owner costs for units without a mortgage: $410
Residents with income below the poverty level in 2022:
This zip code:
14.3%Whole state:
12.8%
Residents with income below 50% of the poverty level in 2022:
This zip code:
7.4%Whole state:
6.8%
Median number of rooms in houses and condos: Median number of rooms in apartments: Notable locations in this zip code not listed on our city pages
Click to draw/clear zip code borders Shopping Center: (1) . Display/hide its location on the map
Churches in zip code 28083 include: (A) , Lane Street Church (B) , Kelly Church (C) , Bethel Church (D) , Victory Church (E) , Brookdale Church (F) , Mills Chapel (G) , Mount Calvary Church (H) , Near the Cross Church (I) . Display/hide their locations on the map
Cemetery: (1) . Display/hide its location on the map
Reservoirs: (A) , Lake Fisher (B) , Edgison Lake (C) . Display/hide their locations on the map
Year house built (houses)
37 2020 or later999 2010 to 20192,326 2000 to 20091,189 1990 to 1999684 1980 to 1989667 1970 to 1979946 1960 to 19691,985 1950 to 19591,115 1940 to 19491,148 1939 or earlier
Zip code 28083 household income distribution in 2022 566 Less than $10,000541 $10,000 to $14,999209 $15,000 to $19,999511 $20,000 to $24,999281 $25,000 to $29,999271 $30,000 to $34,999410 $35,000 to $39,999687 $40,000 to $44,999487 $45,000 to $49,9991,237 $50,000 to $59,9991,167 $60,000 to $74,9991,880 $75,000 to $99,999502 $100,000 to $124,999427 $125,000 to $149,999369 $150,000 to $199,999340 $200,000 or moreEstimate of home value of owner-occupied houses/condos in 2022 in zip code 28083 21 Less than $10,000146 $10,000 to $14,99951 $15,000 to $19,99964 $20,000 to $24,99912 $25,000 to $29,9996 $30,000 to $34,99920 $40,000 to $49,9997 $50,000 to $59,99960 $60,000 to $69,99945 $70,000 to $79,999213 $80,000 to $89,999239 $90,000 to $99,999464 $100,000 to $124,999403 $125,000 to $149,999433 $150,000 to $174,999539 $175,000 to $199,9991,136 $200,000 to $249,999411 $250,000 to $299,999494 $300,000 to $399,99957 $400,000 to $499,99991 $500,000 to $749,99912 $1,500,000 to $1,999,99942 $2,000,000 or moreRent paid by renters in 2022 in zip code 28083 61 $150 to $19944 $200 to $2497 $250 to $29915 $300 to $349120 $350 to $39911 $400 to $44932 $450 to $499123 $500 to $549212 $550 to $59966 $600 to $649355 $650 to $699191 $700 to $749329 $750 to $799563 $800 to $899344 $900 to $999529 $1,000 to $1,249170 $1,250 to $1,499388 $1,500 to $1,999298 No cash rent
Median gross rent in 2022: $1,102.
Median price asked for vacant for-sale houses and condos in 2022: $190,765.
Estimated median house (or condo) value in 2022 for: White Non-Hispanic householders: $217,827Black or African American householders: $200,706Asian householders: $171,206Some other race householders: $220,198Two or more races householders: $85,603Hispanic or Latino householders: $203,340Estimated median house or condo value in 2022: $212,033
28083:
$212,033North Carolina:
$280,600
Lower value quartile - upper value quartile: $133,158 - $269,702
Mean price in 2022: Detached houses: $386,956Here:
$386,956State:
$375,326
Townhouses or other attached units: $309,129Here:
$309,129State:
$317,935
In 3-to-4-unit structures: $125,368Here:
$125,368State:
$254,939
In 5-or-more-unit structures: $717,120Here:
$717,120State:
$329,290
Mobile homes: $80,148Here:
$80,148State:
$124,933
Housing units in structures:
One, detached: 9,211One, attached: 133Two: 7313 or 4: 915 to 9: 24110 to 19: 37520 to 49: 9950 or more: 54Mobile homes: 538Unemployment : 5.1%
Means of transportation to work in zip code 28083 77.7% 9,246 Drove a car alone10.0% 1,185 Carpooled0.0% 5 Bus or trolley bus0.3% 35 Railroad0.4% 47 Taxi0.1% 6 Walked0.4% 43 Other means8.5% 1,015 Worked at homeTravel time to work (commute) in zip code 28083 317 Less than 5 minutes1,163 5 to 9 minutes1,608 10 to 14 minutes1,186 15 to 19 minutes1,522 20 to 24 minutes780 25 to 29 minutes1,740 30 to 34 minutes418 35 to 39 minutes369 40 to 44 minutes1,050 45 to 59 minutes311 60 to 89 minutes114 90 or more minutes
Neighborhoods in zip code 28083: Percentage of zip code residents living and working in this county: 49.9%
Household type by relationship:
Households: 26,308
Male householders: 4,608 (1,300 living alone ), Female householders: 5,315 (1,372 living alone )4,196 spouses (4,156 opposite-sex spouses ), 877 unmarried partners , (810 opposite-sex unmarried partners ), 6,918 children (6,122 natural , 380 adopted , 409 stepchildren ), 998 grandchildren , 285 brothers or sisters , 610 parents , 100 foster children , 1,105 other relatives , 996 non-relatives In group quarters: 105 (-1 institutionalized population )
Size of family households: 3,189 2-persons , 1,253 3-persons , 864 4-persons , 708 5-persons , 223 6-persons , 156 7-or-more-persons
Size of nonfamily households: 2,673 1-person , 820 2-persons , 54 3-persons
2,969 married couples with children. single-parent households (324 men , 1,789 women ).
89.1% of residents of 28083 zip code speak English at home. of residents speak Spanish at home (69% very well, 16% well, 15% not well ).of residents speak other Indo-European language at home (88% very well, 12% not at all ).of residents speak Asian or Pacific Island language at home (70% very well, 30% well ).
Foreign born population: 1,643 (6.2%)
(40.0%
of them are naturalized citizens )
This zip code:
6.2%Whole state:
8.6%
45% Honduras 10% Malaysia 8% Sweden 5% England 5% Colombia 4% Haiti 4% Thailand 24% American 7% German 6% English 5% African 4% Irish 3% Italian 1% European
Year of entry for the foreign-born population
370 2010 or later 702 2000 to 2009 401 1990 to 1999 343 Before 1990
There are
237 Medical Specialists in Zip Code 28083 .
Facilities with environmental interests located in this zip code:
CENTERGROVE CLEANERS INCORPORATED - DC (1775 CENTERGROVE RD in KANNAPOLIS, NC)
AIR MINOR (AIRS/AFS) STATE MASTER (North Carolina facility info) - AIR PROGRAM, HAZARDOUS WASTE PROGRAM Conditionally Exempt Small Quantity Generators, less than 100 kg/month of hazardous waste (Resource Conservation and Recovery Act (tracking hazardous waste)) - notification Business SIC classification: DRYCLEANING PLANTS, EXCEPT RUG CLEANING; NONCLASSIFIABLE ESTABLISHMENTSOrganizations: TOM COMMERFORD (CONTACT/OWNER)
A L BROWN HIGH (415 E 1ST ST in KANNAPOLIS, NC)
(National Center for Education Statistics) - STATE ID-304 Organizations: KANNAPOLIS CITY SCHOOLS (SCHOOL DISTRICT)
AUTOMOTIVE REFINISH TECHNOLOGY (2907 PENNSYLVANIA AVE in KANNAPOLIS, NC)
Conditionally Exempt Small Quantity Generators, less than 100 kg/month of hazardous waste (Resource Conservation and Recovery Act (tracking hazardous waste)) - notification
Housing units lacking complete plumbing facilities: 2.2%
Housing units lacking complete kitchen facilities: 2.0%
57.6% Electricity 35.6% Utility gas 3.9% Bottled, tank, or LP gas 1.4% Fuel oil, kerosene, etc. 0.9% Wood
Population in 1990: 14,113. Population change in the 1990s: +6,096 (+43.2%).
Place of birth for U.S.-born residents:
This state: 15,935Northeast: 3,602Midwest: 1,395South: 2,610West: 790
58% of the 28083 zip code residents lived in the same house 5 years ago.
Out of people who lived in different houses, 51% lived in this county.
Out of people who lived in different counties, 50% lived in North Carolina.
89% of the 28083 zip code residents lived in the same house 1 year ago.
Out of people who lived in different houses, 43% moved from this county.
Out of people who lived in different houses, 48% moved from different county within same state.
Out of people who lived in different houses, 6% moved from different state.
Out of people who lived in different houses, 3% moved from abroad.
Private vs. public school enrollment:
Students in private schools in grades 1 to 8 (elementary and middle school): 123
Here:
4.2%North Carolina:
13.8%
Students in private schools in grades 9 to 12 (high school): 224
Here:
17.3%North Carolina:
11.9%
Students in private undergraduate colleges: 132
Here:
9.5%North Carolina:
19.3%
Occupation by median earnings in the past 12 months ($)
67,485 Law enforcement workers including supervisors 59,335 Life, physical, and social science occupations 59,160 Health diagnosing and treating practitioners and other technical occupations 54,563 Installation, maintenance, and repair occupations 53,942 Business and financial operations occupations 53,645 Community and social service occupations
Top industries in this zip code by the number of employees in 2005:
Accommodation and Food Services: Full-Service Restaurants (50-99 employees: 3 establishments, 20-49 employees: 3 establishments, 10-19 employees: 2 establishments, 5-9 employees: 6 establishments, 1-4 employees: 2 establishments)Administrative and Support and Waste Management and Remediation Services: Temporary Help Services (250-499: 1)Health Care and Social Assistance: Nursing Care Facilities (100-249: 2)Accommodation and Food Services: Limited-Service Restaurants (50-99: 1, 20-49: 7, 10-19: 1, 5-9: 1, 1-4: 1)Other Services (except Public Administration): Religious Organizations (20-49: 2, 10-19: 2, 5-9: 13, 1-4: 9)Health Care and Social Assistance: All Other Outpatient Care Centers (100-249: 1)
People in group quarters in 2010:
190 people in nursing facilities/skilled-nursing facilities
13 people in group homes intended for adults
5 people in residential treatment centers for adults
People in group quarters in 2000:
231 people in nursing homes
10 people in homes for the mentally retarded
6 people in other noninstitutional group quarters
Fatal accident statistics in 2014:
Fatal accident count: 3Vehicles involved in fatal accidents: 4Fatal accidents caused by drunken drivers: 1Fatalities: 3Persons involved in fatal accidents: 11Pedestrians involved in fatal accidents: 1
Fatal accident statistics in 2013:
Fatal accident count: 2Vehicles involved in fatal accidents: 2Fatal accidents caused by drunken drivers: 0Fatalities: 2Persons involved in fatal accidents: 3Pedestrians involved in fatal accidents: 2
Home Mortgage Disclosure Act Aggregated Statistics For Year 2009(Based on 4 full and 4 partial tracts) A) FHA, FSA/RHS & VA B) Conventional C) Refinancings D) Home Improvement Loans F) Non-occupant Loans on G) Loans On Manufactured Number Average Value Number Average Value Number Average Value Number Average Value Number Average Value Number Average Value
LOANS ORIGINATED 169 $110,509 86 $101,063 470 $125,983 15 $52,686 76 $71,815 6 $79,358 APPLICATIONS APPROVED, NOT ACCEPTED 7 $122,873 3 $150,847 44 $90,824 4 $18,888 0 $0 1 $84,290 APPLICATIONS DENIED 25 $122,386 10 $154,265 253 $110,261 17 $44,795 22 $82,008 6 $68,308 APPLICATIONS WITHDRAWN 24 $96,890 12 $114,717 145 $127,398 0 $0 11 $106,125 3 $68,410 FILES CLOSED FOR INCOMPLETENESS 2 $136,400 2 $37,735 35 $145,472 6 $87,805 4 $110,610 0 $0
Aggregated Statistics For Year 2008(Based on 4 full and 4 partial tracts) A) FHA, FSA/RHS & VA B) Conventional C) Refinancings D) Home Improvement Loans E) Loans on Dwellings For 5+ Families F) Non-occupant Loans on G) Loans On Manufactured Number Average Value Number Average Value Number Average Value Number Average Value Number Average Value Number Average Value Number Average Value
LOANS ORIGINATED 155 $123,377 294 $102,727 507 $109,298 48 $34,829 0 $0 199 $86,121 5 $68,270 APPLICATIONS APPROVED, NOT ACCEPTED 4 $190,902 26 $98,133 102 $98,955 17 $36,218 2 $849,490 20 $84,385 0 $0 APPLICATIONS DENIED 36 $124,389 53 $108,662 468 $113,464 72 $36,548 0 $0 57 $82,527 9 $79,686 APPLICATIONS WITHDRAWN 21 $132,928 42 $119,946 148 $131,058 2 $17,615 0 $0 26 $121,487 2 $50,495 FILES CLOSED FOR INCOMPLETENESS 4 $97,810 8 $76,726 19 $116,511 1 $103,770 0 $0 6 $80,542 0 $0
Aggregated Statistics For Year 2007(Based on 4 full and 4 partial tracts) A) FHA, FSA/RHS & VA B) Conventional C) Refinancings D) Home Improvement Loans E) Loans on Dwellings For 5+ Families F) Non-occupant Loans on G) Loans On Manufactured Number Average Value Number Average Value Number Average Value Number Average Value Number Average Value Number Average Value Number Average Value
LOANS ORIGINATED 45 $134,703 757 $105,552 567 $99,612 74 $50,851 2 $849,490 398 $91,806 8 $78,332 APPLICATIONS APPROVED, NOT ACCEPTED 2 $104,920 77 $92,361 151 $90,979 24 $51,840 0 $0 55 $76,309 10 $72,398 APPLICATIONS DENIED 13 $125,321 131 $94,364 586 $102,819 97 $48,040 0 $0 79 $85,917 12 $76,130 APPLICATIONS WITHDRAWN 8 $138,594 91 $114,957 221 $108,478 12 $65,918 0 $0 53 $93,553 4 $148,330 FILES CLOSED FOR INCOMPLETENESS 0 $0 16 $79,906 34 $120,303 2 $139,325 0 $0 6 $87,362 0 $0
Aggregated Statistics For Year 2006(Based on 4 full and 4 partial tracts) A) FHA, FSA/RHS & VA B) Conventional C) Refinancings D) Home Improvement Loans F) Non-occupant Loans on G) Loans On Manufactured Number Average Value Number Average Value Number Average Value Number Average Value Number Average Value Number Average Value
LOANS ORIGINATED 75 $121,380 974 $88,948 669 $79,670 73 $52,431 398 $78,524 20 $56,500 APPLICATIONS APPROVED, NOT ACCEPTED 4 $165,748 96 $85,130 203 $80,148 25 $57,703 34 $74,300 7 $47,500 APPLICATIONS DENIED 10 $146,730 148 $80,838 630 $90,706 77 $43,705 59 $70,555 32 $55,695 APPLICATIONS WITHDRAWN 10 $126,188 88 $91,227 241 $107,696 11 $113,573 27 $98,357 5 $96,124 FILES CLOSED FOR INCOMPLETENESS 2 $121,790 34 $94,563 73 $107,128 0 $0 10 $75,216 0 $0
Aggregated Statistics For Year 2005(Based on 4 full and 4 partial tracts) A) FHA, FSA/RHS & VA B) Conventional C) Refinancings D) Home Improvement Loans F) Non-occupant Loans on G) Loans On Manufactured Number Average Value Number Average Value Number Average Value Number Average Value Number Average Value Number Average Value
LOANS ORIGINATED 130 $120,203 851 $86,796 699 $85,532 65 $40,471 244 $77,580 14 $43,579 APPLICATIONS APPROVED, NOT ACCEPTED 4 $92,072 73 $79,006 184 $82,276 24 $23,158 24 $65,388 6 $53,455 APPLICATIONS DENIED 11 $121,661 177 $75,330 640 $93,830 69 $24,443 67 $61,723 22 $64,320 APPLICATIONS WITHDRAWN 15 $142,323 120 $100,979 269 $98,402 23 $114,164 26 $85,659 5 $66,642 FILES CLOSED FOR INCOMPLETENESS 2 $56,965 22 $81,370 63 $128,856 2 $24,360 2 $44,975 0 $0
Aggregated Statistics For Year 2004(Based on 4 full and 4 partial tracts) A) FHA, FSA/RHS & VA B) Conventional C) Refinancings D) Home Improvement Loans E) Loans on Dwellings For 5+ Families F) Non-occupant Loans on G) Loans On Manufactured Number Average Value Number Average Value Number Average Value Number Average Value Number Average Value Number Average Value Number Average Value
LOANS ORIGINATED 209 $122,926 518 $88,814 714 $91,769 64 $32,079 0 $0 227 $72,006 8 $101,185 APPLICATIONS APPROVED, NOT ACCEPTED 2 $104,250 49 $77,231 141 $84,494 25 $34,103 0 $0 28 $74,587 19 $50,558 APPLICATIONS DENIED 26 $126,152 121 $78,224 503 $89,244 89 $33,890 2 $3,117,760 51 $72,464 51 $57,796 APPLICATIONS WITHDRAWN 24 $114,257 92 $84,991 193 $95,671 14 $44,724 0 $0 28 $58,505 6 $99,245 FILES CLOSED FOR INCOMPLETENESS 2 $98,405 29 $89,646 52 $106,881 0 $0 0 $0 6 $73,820 0 $0
Aggregated Statistics For Year 2003(Based on 4 full and 6 partial tracts) A) FHA, FSA/RHS & VA B) Conventional C) Refinancings D) Home Improvement Loans E) Loans on Dwellings For 5+ Families F) Non-occupant Loans on Number Average Value Number Average Value Number Average Value Number Average Value Number Average Value Number Average Value
LOANS ORIGINATED 185 $118,040 572 $88,100 1,316 $97,846 90 $39,818 0 $0 239 $78,292 APPLICATIONS APPROVED, NOT ACCEPTED 11 $105,185 93 $62,700 212 $87,554 28 $20,309 0 $0 28 $66,590 APPLICATIONS DENIED 34 $108,484 232 $66,427 537 $91,131 100 $26,498 0 $0 50 $63,380 APPLICATIONS WITHDRAWN 30 $120,514 47 $86,766 252 $98,512 7 $16,840 2 $917,790 25 $57,413 FILES CLOSED FOR INCOMPLETENESS 4 $127,145 21 $78,904 46 $106,507 1 $54,620 0 $0 8 $79,208
Aggregated Statistics For Year 2002(Based on 4 full and 6 partial tracts) A) FHA, FSA/RHS & VA B) Conventional C) Refinancings D) Home Improvement Loans F) Non-occupant Loans on Number Average Value Number Average Value Number Average Value Number Average Value Number Average Value
LOANS ORIGINATED 168 $110,549 406 $86,018 960 $90,664 88 $33,931 206 $68,484 APPLICATIONS APPROVED, NOT ACCEPTED 8 $52,378 82 $61,299 199 $83,149 32 $25,635 9 $56,108 APPLICATIONS DENIED 41 $89,616 235 $57,926 497 $80,334 102 $24,934 29 $54,170 APPLICATIONS WITHDRAWN 23 $127,562 27 $86,767 214 $89,503 28 $23,888 17 $72,947 FILES CLOSED FOR INCOMPLETENESS 2 $73,955 9 $94,603 55 $91,189 0 $0 6 $96,827
Aggregated Statistics For Year 2001(Based on 4 full and 6 partial tracts) A) FHA, FSA/RHS & VA B) Conventional C) Refinancings D) Home Improvement Loans F) Non-occupant Loans on Number Average Value Number Average Value Number Average Value Number Average Value Number Average Value
LOANS ORIGINATED 256 $109,515 444 $86,670 832 $92,998 83 $14,899 140 $63,599 APPLICATIONS APPROVED, NOT ACCEPTED 2 $102,955 58 $63,087 144 $93,336 12 $18,872 7 $46,529 APPLICATIONS DENIED 23 $115,262 193 $54,615 398 $77,070 85 $18,267 34 $49,752 APPLICATIONS WITHDRAWN 9 $98,414 32 $92,947 170 $82,751 8 $20,930 9 $56,562 FILES CLOSED FOR INCOMPLETENESS 1 $29,780 4 $86,270 44 $103,103 0 $0 4 $87,200
Aggregated Statistics For Year 2000(Based on 4 full and 6 partial tracts) A) FHA, FSA/RHS & VA B) Conventional C) Refinancings D) Home Improvement Loans F) Non-occupant Loans on Number Average Value Number Average Value Number Average Value Number Average Value Number Average Value
LOANS ORIGINATED 167 $102,344 435 $79,397 440 $69,909 97 $20,544 141 $69,994 APPLICATIONS APPROVED, NOT ACCEPTED 21 $43,722 100 $57,766 151 $69,595 51 $16,330 7 $41,650 APPLICATIONS DENIED 19 $66,685 287 $51,027 362 $72,214 124 $16,249 27 $44,946 APPLICATIONS WITHDRAWN 21 $94,400 63 $71,927 169 $61,262 6 $41,905 18 $62,635 FILES CLOSED FOR INCOMPLETENESS 1 $68,500 10 $94,290 23 $65,192 0 $0 0 $0
Aggregated Statistics For Year 1999(Based on 2 full and 3 partial tracts) A) FHA, FSA/RHS & VA B) Conventional C) Refinancings D) Home Improvement Loans E) Loans on Dwellings For 5+ Families F) Non-occupant Loans on Number Average Value Number Average Value Number Average Value Number Average Value Number Average Value Number Average Value
LOANS ORIGINATED 75 $100,600 216 $78,474 294 $78,968 67 $17,940 1 $4,604,600 72 $65,367 APPLICATIONS APPROVED, NOT ACCEPTED 2 $112,450 64 $63,017 148 $61,643 18 $15,197 0 $0 8 $66,382 APPLICATIONS DENIED 4 $81,485 194 $57,600 207 $69,398 65 $36,363 1 $2,970 24 $74,470 APPLICATIONS WITHDRAWN 4 $97,782 25 $84,822 133 $73,281 11 $29,879 0 $0 5 $75,744 FILES CLOSED FOR INCOMPLETENESS 0 $0 2 $84,655 22 $58,923 0 $0 0 $0 2 $46,975
Private Mortgage Insurance Companies Aggregated Statistics For Year 2009(Based on 4 full and 4 partial tracts) A) Conventional B) Refinancings C) Non-occupant Loans on Number Average Value Number Average Value Number Average Value
LOANS ORIGINATED 12 $110,242 16 $132,808 0 $0 APPLICATIONS APPROVED, NOT ACCEPTED 5 $96,822 1 $172,560 2 $93,535 APPLICATIONS DENIED 8 $98,299 4 $119,398 0 $0 APPLICATIONS WITHDRAWN 2 $69,960 3 $153,953 0 $0 FILES CLOSED FOR INCOMPLETENESS 0 $0 0 $0 0 $0
Aggregated Statistics For Year 2008(Based on 4 full and 4 partial tracts) A) Conventional B) Refinancings C) Non-occupant Loans on Number Average Value Number Average Value Number Average Value
LOANS ORIGINATED 120 $116,336 32 $133,665 32 $91,837 APPLICATIONS APPROVED, NOT ACCEPTED 47 $131,755 18 $128,155 21 $105,540 APPLICATIONS DENIED 6 $267,983 14 $103,499 8 $146,216 APPLICATIONS WITHDRAWN 2 $139,325 4 $88,368 0 $0 FILES CLOSED FOR INCOMPLETENESS 0 $0 0 $0 0 $0
Aggregated Statistics For Year 2007(Based on 4 full and 4 partial tracts) A) Conventional B) Refinancings C) Non-occupant Loans on Number Average Value Number Average Value Number Average Value
LOANS ORIGINATED 257 $118,915 64 $111,083 92 $105,349 APPLICATIONS APPROVED, NOT ACCEPTED 32 $126,090 17 $109,199 12 $100,352 APPLICATIONS DENIED 2 $167,580 0 $0 0 $0 APPLICATIONS WITHDRAWN 10 $98,014 2 $104,250 10 $92,769 FILES CLOSED FOR INCOMPLETENESS 0 $0 0 $0 0 $0
Aggregated Statistics For Year 2006(Based on 4 full and 4 partial tracts) A) Conventional B) Refinancings C) Non-occupant Loans on Number Average Value Number Average Value Number Average Value
LOANS ORIGINATED 136 $111,697 35 $112,567 23 $84,087 APPLICATIONS APPROVED, NOT ACCEPTED 12 $104,462 4 $106,102 0 $0 APPLICATIONS DENIED 2 $74,045 0 $0 0 $0 APPLICATIONS WITHDRAWN 7 $113,196 3 $120,643 4 $108,462 FILES CLOSED FOR INCOMPLETENESS 0 $0 0 $0 0 $0
Aggregated Statistics For Year 2005(Based on 4 full and 4 partial tracts) A) Conventional B) Refinancings C) Non-occupant Loans on D) Loans On Manufactured Number Average Value Number Average Value Number Average Value Number Average Value
LOANS ORIGINATED 139 $105,904 59 $109,188 31 $78,914 3 $40,110 APPLICATIONS APPROVED, NOT ACCEPTED 7 $117,150 16 $134,263 0 $0 0 $0 APPLICATIONS DENIED 0 $0 4 $101,328 0 $0 0 $0 APPLICATIONS WITHDRAWN 0 $0 0 $0 0 $0 0 $0 FILES CLOSED FOR INCOMPLETENESS 0 $0 2 $82,815 2 $82,815 0 $0
Aggregated Statistics For Year 2004(Based on 4 full and 4 partial tracts) A) Conventional B) Refinancings C) Non-occupant Loans on D) Loans On Manufactured Number Average Value Number Average Value Number Average Value Number Average Value
LOANS ORIGINATED 127 $101,030 53 $108,463 39 $77,437 4 $55,895 APPLICATIONS APPROVED, NOT ACCEPTED 14 $129,784 17 $100,823 8 $79,892 0 $0 APPLICATIONS DENIED 2 $79,950 0 $0 0 $0 0 $0 APPLICATIONS WITHDRAWN 6 $98,640 0 $0 4 $82,195 0 $0 FILES CLOSED FOR INCOMPLETENESS 2 $129,580 4 $118,378 0 $0 0 $0
Aggregated Statistics For Year 2003(Based on 4 full and 6 partial tracts) A) Conventional B) Refinancings C) Non-occupant Loans on Number Average Value Number Average Value Number Average Value
LOANS ORIGINATED 144 $101,901 179 $117,484 27 $74,949 APPLICATIONS APPROVED, NOT ACCEPTED 18 $102,074 32 $114,070 1 $72,970 APPLICATIONS DENIED 8 $117,389 7 $100,523 1 $141,470 APPLICATIONS WITHDRAWN 14 $104,726 19 $106,371 4 $107,535 FILES CLOSED FOR INCOMPLETENESS 0 $0 6 $101,695 0 $0
Aggregated Statistics For Year 2002(Based on 4 full and 6 partial tracts) A) Conventional B) Refinancings C) Non-occupant Loans on Number Average Value Number Average Value Number Average Value
LOANS ORIGINATED 137 $102,376 152 $106,098 30 $75,478 APPLICATIONS APPROVED, NOT ACCEPTED 32 $105,572 42 $110,752 7 $75,564 APPLICATIONS DENIED 2 $80,950 9 $118,033 0 $0 APPLICATIONS WITHDRAWN 6 $98,123 8 $125,256 1 $112,430 FILES CLOSED FOR INCOMPLETENESS 4 $106,030 1 $106,480 0 $0
Aggregated Statistics For Year 2001(Based on 4 full and 6 partial tracts) A) Conventional B) Refinancings C) Non-occupant Loans on Number Average Value Number Average Value Number Average Value
LOANS ORIGINATED 156 $100,751 139 $110,840 10 $82,168 APPLICATIONS APPROVED, NOT ACCEPTED 18 $98,210 31 $115,985 0 $0 APPLICATIONS DENIED 7 $100,741 20 $119,206 4 $108,090 APPLICATIONS WITHDRAWN 4 $68,240 13 $103,263 0 $0 FILES CLOSED FOR INCOMPLETENESS 10 $95,838 7 $97,804 0 $0
Aggregated Statistics For Year 2000(Based on 4 full and 6 partial tracts) A) Conventional B) Refinancings C) Non-occupant Loans on Number Average Value Number Average Value Number Average Value
LOANS ORIGINATED 129 $97,142 28 $92,816 18 $67,424 APPLICATIONS APPROVED, NOT ACCEPTED 27 $96,698 4 $85,160 1 $67,010 APPLICATIONS DENIED 7 $122,481 7 $117,279 1 $53,610 APPLICATIONS WITHDRAWN 5 $118,052 2 $88,660 0 $0 FILES CLOSED FOR INCOMPLETENESS 0 $0 0 $0 0 $0
Aggregated Statistics For Year 1999(Based on 2 full and 3 partial tracts) A) Conventional B) Refinancings C) Non-occupant Loans on Number Average Value Number Average Value Number Average Value
LOANS ORIGINATED 55 $93,096 21 $88,983 2 $66,405 APPLICATIONS APPROVED, NOT ACCEPTED 6 $97,460 6 $111,643 1 $88,730 APPLICATIONS DENIED 1 $85,670 0 $0 0 $0 APPLICATIONS WITHDRAWN 2 $90,575 1 $45,210 0 $0 FILES CLOSED FOR INCOMPLETENESS 1 $93,940 0 $0 0 $0
2002 - 2018 National Fire Incident Reporting System (NFIRS) incidents See full 2006 National Fire Incident Reporting System statistics for zip code 28083, North Carolina
Most common first names in zip code 28083 among deceased individuals Name Count Lived (average)
James 102 74.0 years Mary 70 79.3 years William 57 74.8 years John 55 76.4 years Robert 49 71.5 years Charles 47 70.5 years Dorothy 34 77.8 years Ruby 32 81.2 years Annie 32 85.1 years Margaret 31 79.1 years
Most common last names in zip code 28083 among deceased individuals Last name Count Lived (average)
Smith 42 77.9 years Davis 27 75.5 years Brown 27 73.9 years Johnson 25 70.5 years Jones 24 76.2 years Miller 23 76.3 years Sloop 23 79.9 years Williams 21 78.3 years Beaver 19 76.9 years Griffin 19 75.7 years
Businesses in zip code 28083
Name Count Name Count
ALDI 1 Little Caesars Pizza 2 AT&T 1 Long John Silver's 1 Academy Sports + Outdoors 1 Lowe's 1 Arby's 1 Marriott 1 AutoZone 1 McDonald's 1 Blockbuster 1 Microtel 1 Burger King 1 New Balance 1 CVS 1 Nike 4 Chevrolet 1 OfficeMax 1 Church's Chicken 1 Pizza Hut 1 Cricket Wireless 1 Quiznos 1 Dairy Queen 1 RadioShack 1 Dunkin Donuts 2 Ruby Tuesday 1 Econo Lodge 1 SONIC Drive-In 1 FedEx 3 Sam's Club 1 Ford 1 Sprint Nextel 2 GameStop 1 Steak 'n Shake 1 H&R Block 3 T-Mobile 3 Hardee's 2 Taco Bell 2 Hobby Lobby 1 U-Haul 1 Holiday Inn 1 UPS 4 Home Depot 1 Waffle House 1 IHOP 1 Walgreens 1 KFC 1 Walmart 1 Kohl's 1
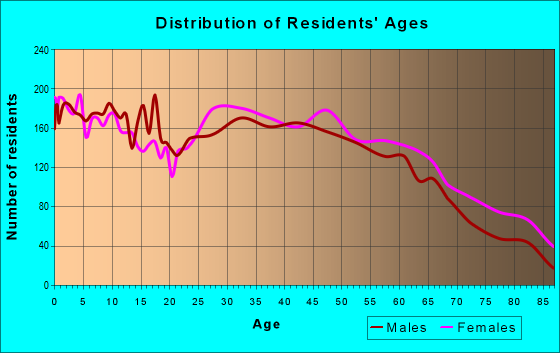
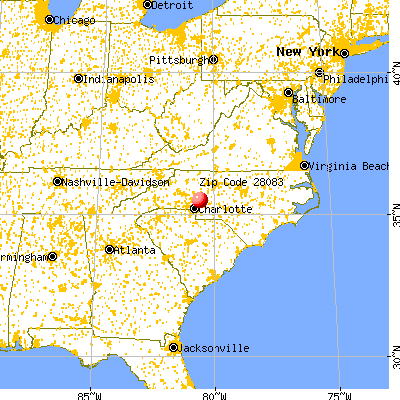

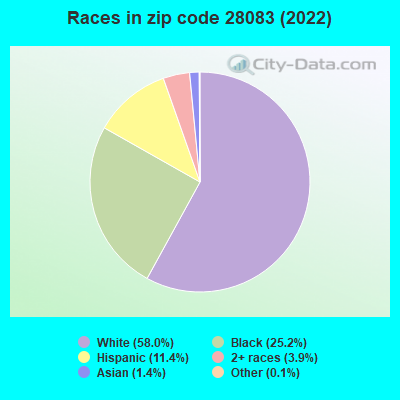


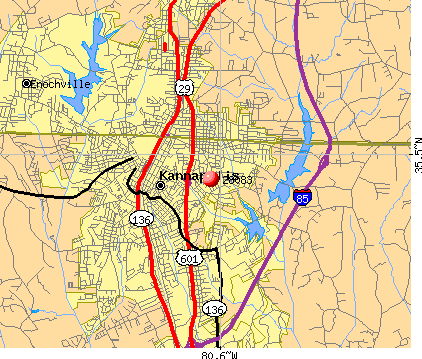 Nearest zip codes: 28088, 28023, 28081, 28025, 28027, 28138.
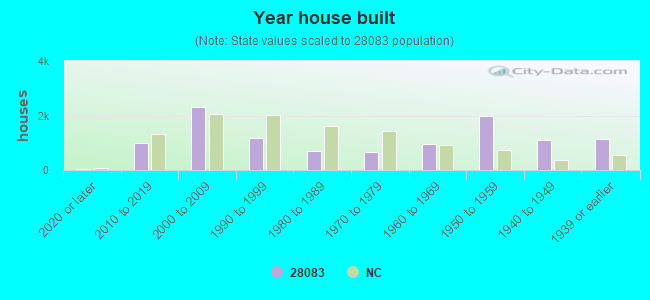
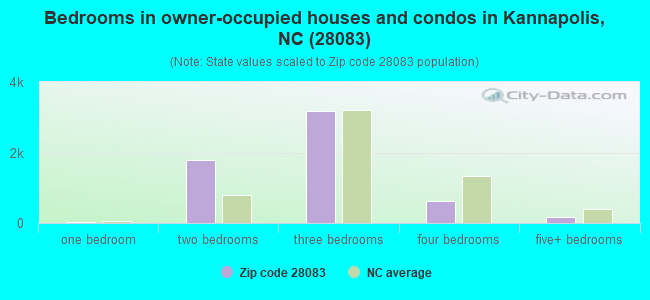
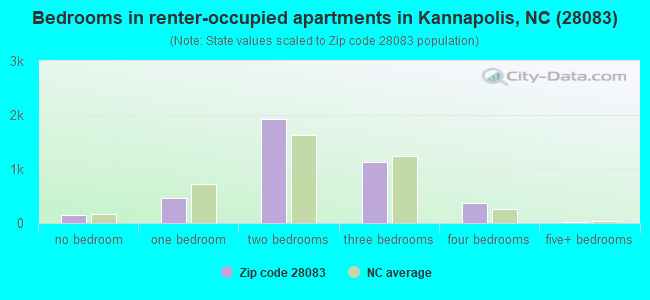
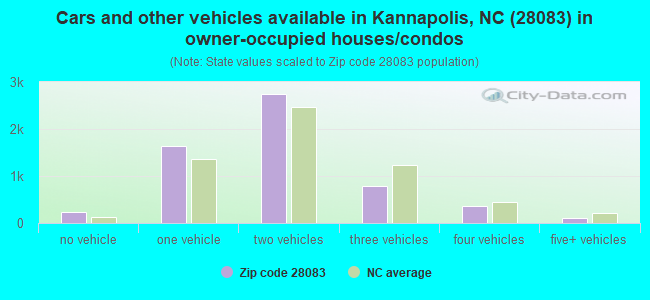
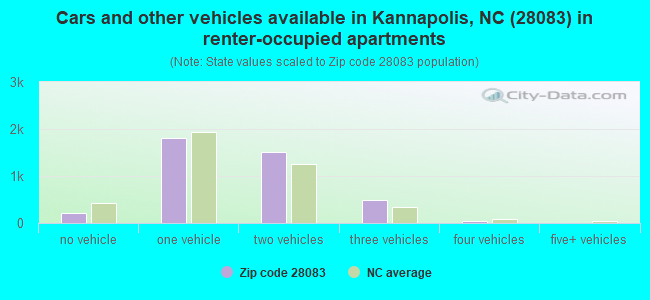


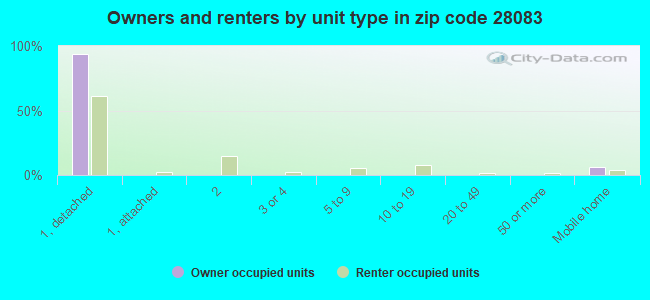
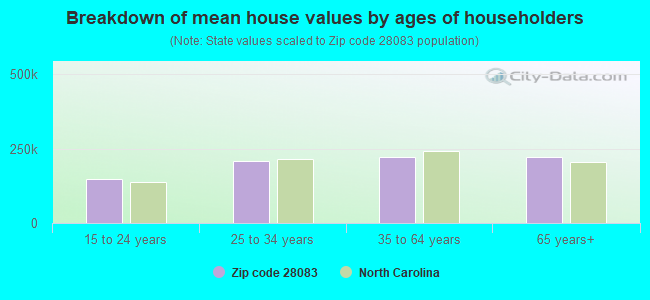


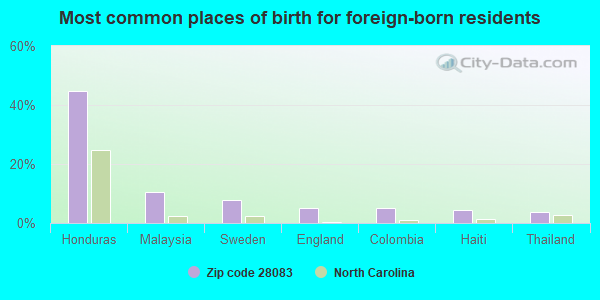
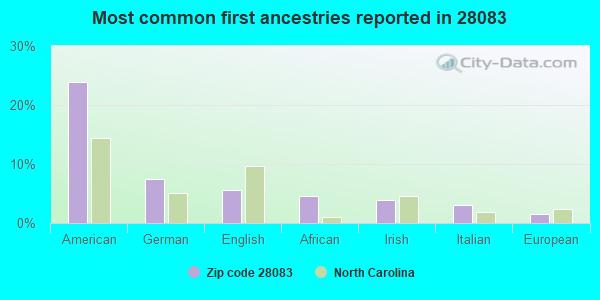
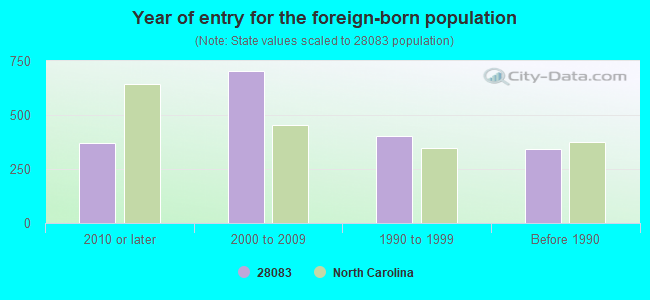


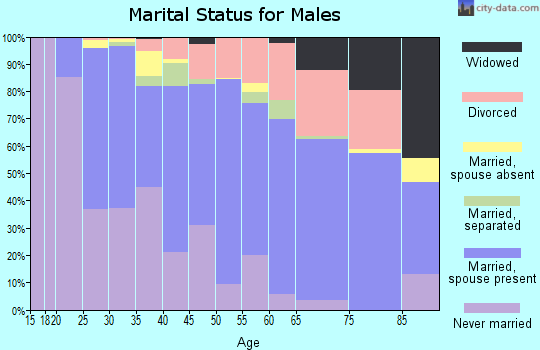
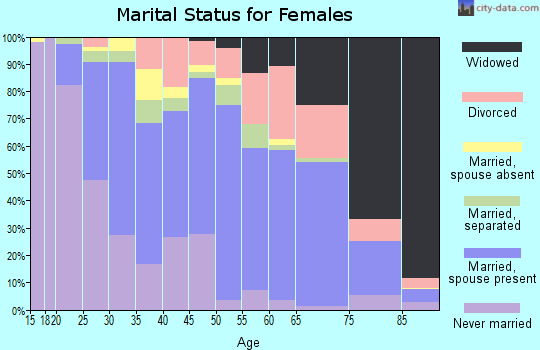
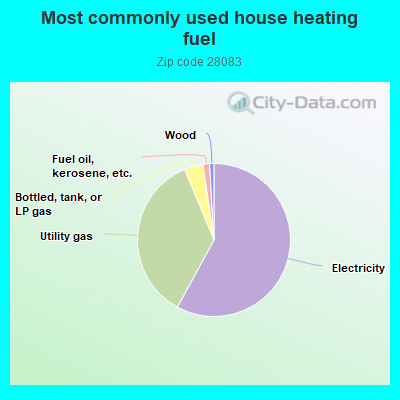
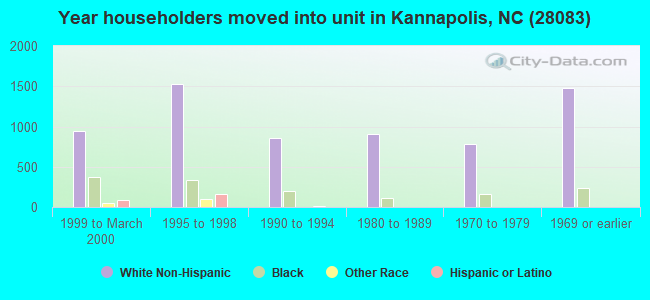
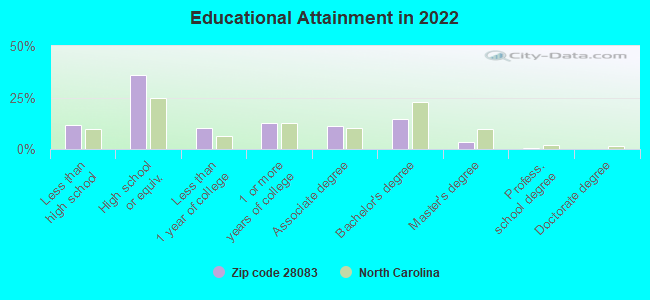
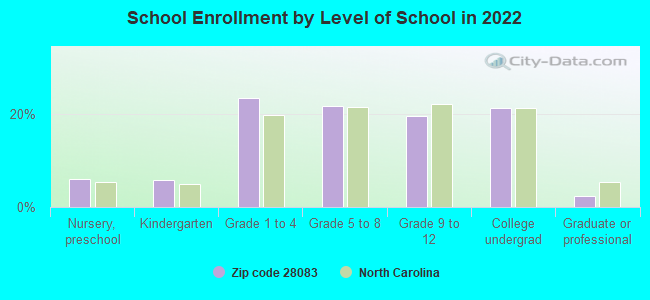
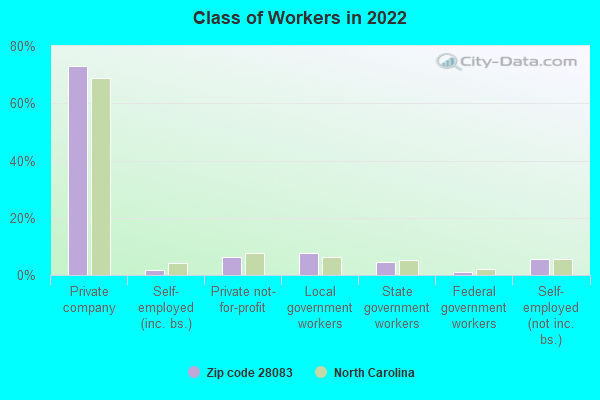
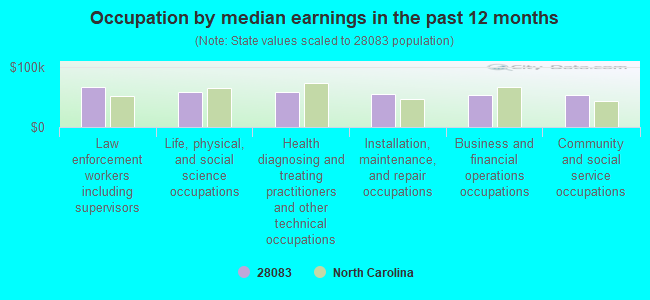
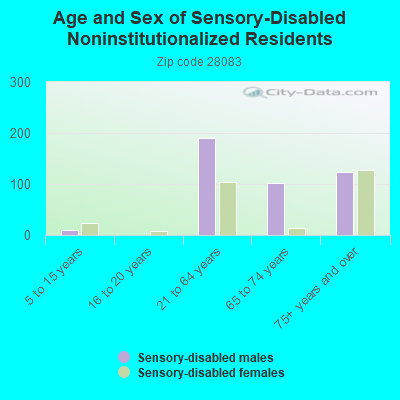
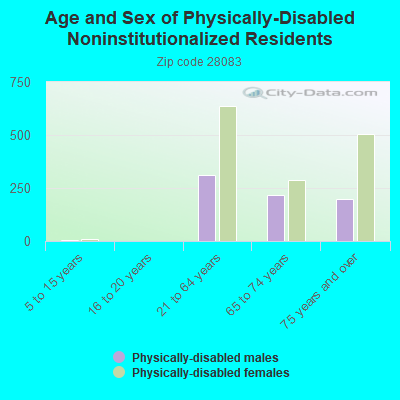
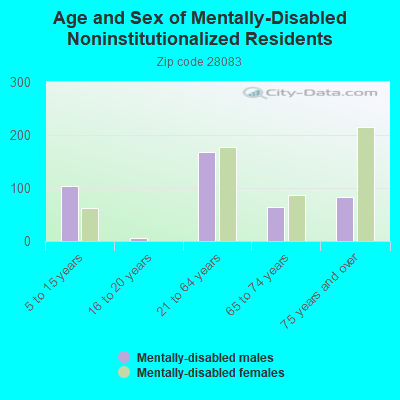
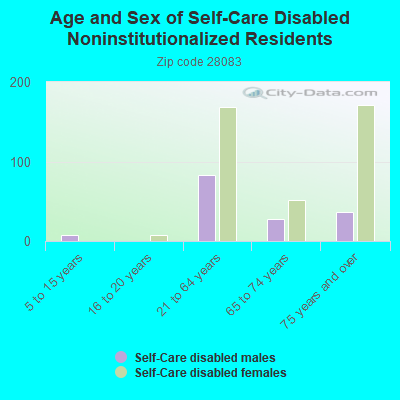
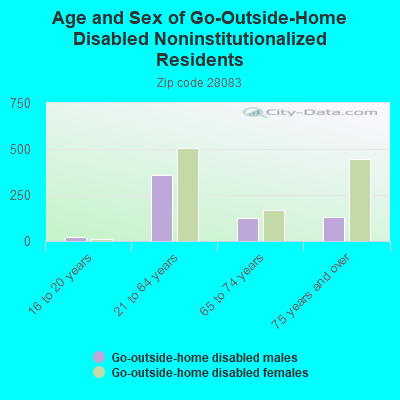
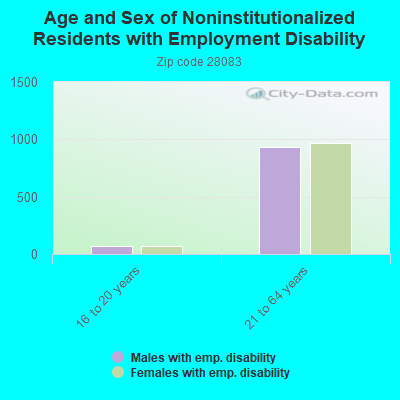
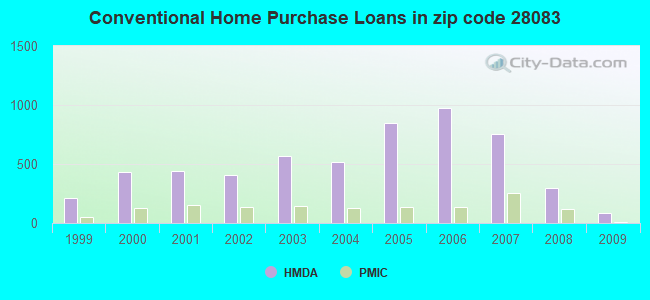
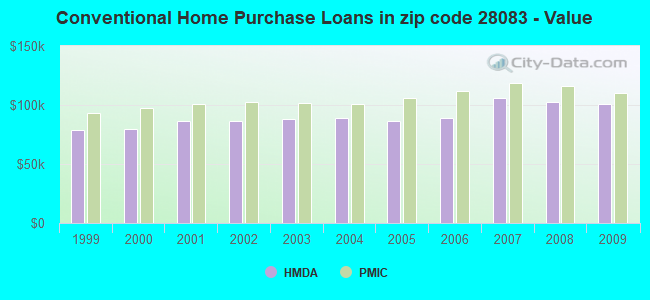
 Based on the data from the years 2002 - 2018 the average number of fires per year is 54. The highest number of reported fire incidents - 115 took place in 2010, and the least - 0 in 2005. The data has a decreasing trend.
 When looking into fire subcategories, the most reports belonged to: Structure Fires (41.1%), and Outside Fires (32.8%).