Races in Keene, New Hampshire (NH) Detailed Stats
Ancestries, Foreign-born residents, place of birth
Settings
X


Recent posts about races in Keene, New Hampshire on our local forum with over 2,400,000 registered users:
 | Keene - The good, the bad and the ugly (26 replies) |
| Moving to New Hampshire (Lebanon, Hanover, Keene, Grantham, Plainfield, Enfield, Etna) (38 replies) |
| Possible move to Keene NH (18 replies) |
| Current NH rental market (36 replies) |
| Bad parts of Keene? (35 replies) |
| Commute from Keene to Claremont (20 replies) |
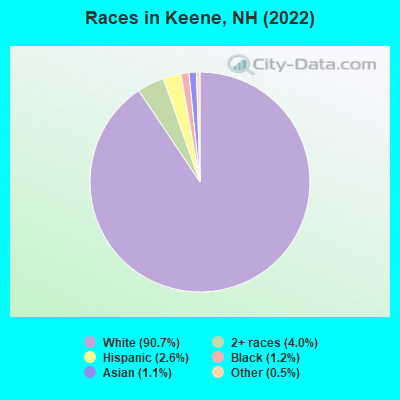
According to 2022 data, the most numerous races in Keene, NH are White alone (20,975 residents), Hispanic (593 residents), and Two or more races (936 residents). 95.8% of Keene residents speak English at home. 4.2% of Keene, NH residents are foreign-born (1.3% born in Europe, 1.2% born in Asia, 0.7% born in Africa, 0.5% born in North America), which is 19.2% less than the foreign-born rate of 5.0% across the entire state of New Hampshire.
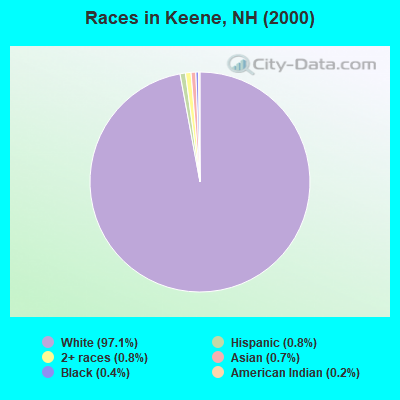
Race distribution in Keene
2000
2022

- 21,91697.1%White alone
- 1720.8%Hispanic
- 1720.8%Two or more races
- 1530.7%Asian alone
- 810.4%Black alone
- 410.2%American Indian alone
- 210.09%Other race alone
- 70.03%Native Hawaiian and Other
Pacific Islander alone
-
- 20,97590.7%White alone
- 9364.0%Two or more races
- 5932.6%Hispanic
- 2841.2%Black alone
- 2571.1%Asian alone
- 1260.5%Other race alone
- 100.04%American Indian alone
- 70.03%Native Hawaiian and Other
Pacific Islander alone
2000
2022
-
- 1,175,25295.1%White alone
- 20,4891.7%Hispanic
- 15,8031.3%Asian alone
- 11,6060.9%Two or more races
- 8,3540.7%Black alone
- 2,6980.2%American Indian alone
- 1,2540.1%Other race alone
- 3300.03%Native Hawaiian and Other
Pacific Islander alone

-
- 1,208,10186.6%White alone
- 63,4794.5%Hispanic
- 60,7244.4%Two or more races
- 36,5192.6%Asian alone
- 17,9311.3%Black alone
- 6,6150.5%Other race alone
- 1,0140.07%American Indian alone
- 8480.06%Native Hawaiian and Other
Pacific Islander alone

Income and house value in Keene
- Median household income in 2022
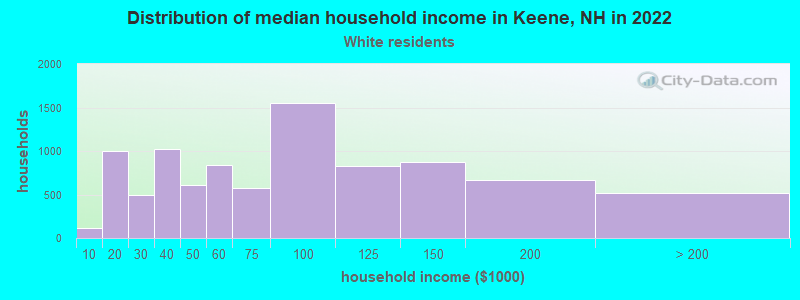
- $73,768White non-Hispanic householders
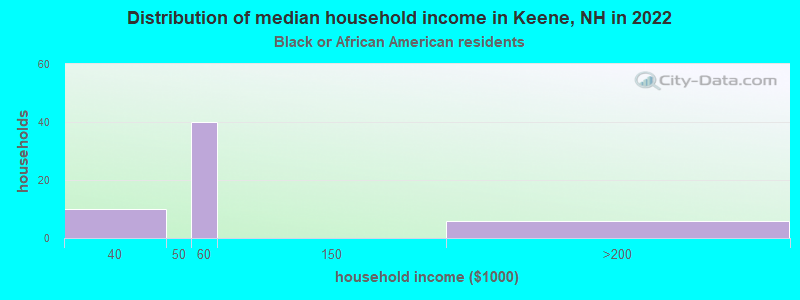
- $56,311Black householders
- $49,621Two or more races householders
- $58,985Hispanic or Latino race householders
- Median 2022 house value
- $256,994White Non-Hispanic householders
- $344,560Asian householders
- $275,102Two or more races householders
Household income for White non-Hispanic householders
Household income for Black householders
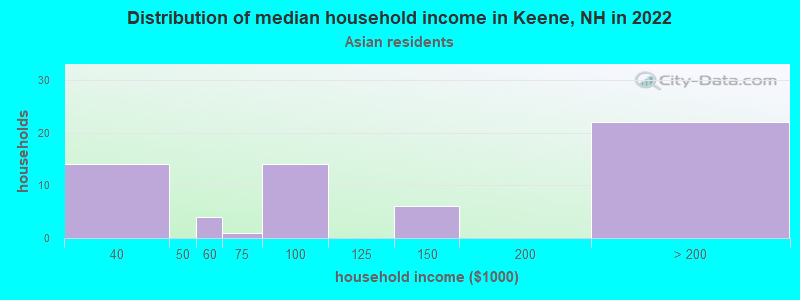
Household income for Asian householders
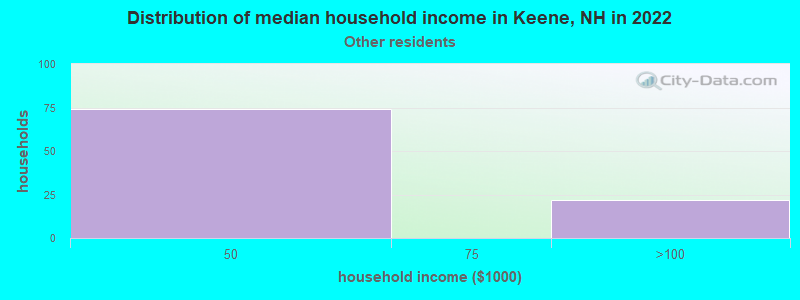
Household income for Some other race householders
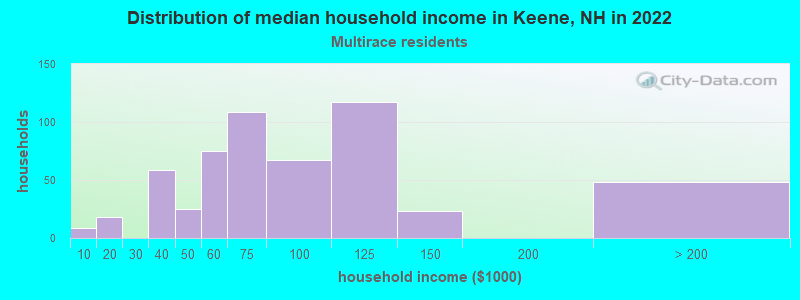
Household income for Two or more races householders
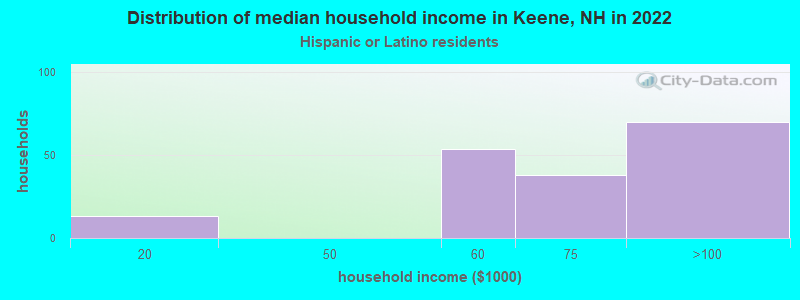
Household income for Hispanic or Latino race householders
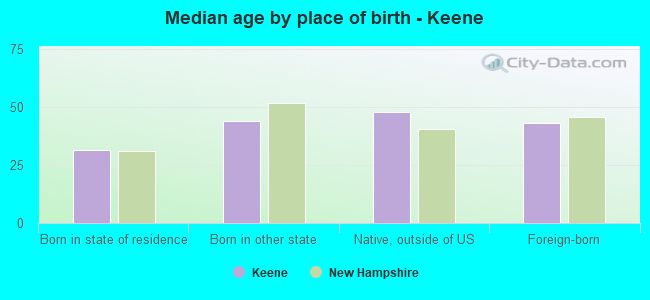
Median age by race in Keene
- 37.9Median age for White residents
- 36.4Males
- 39.8Females
- 24.9Median age for Black or African American residents
- 66.1Males
- 16.2Females
- 25.7Median age for American Indian / Alaska Native residents
- 5.2Males
- -763,157,894.0Females
- 19.7Median age for Asian residents
- 22.2Males
- 15.4Females
- -666,666,666.0Median age for Native Hawaiian / Pacific Islander residents
- -666,666,666.0Males
- -666,666,666.0Females
- 62.2Median age for Other race residents
- 27.0Males
- -639,053,253.8Females
- 26.1Median age for Two or more races residents
- 25.6Males
- 21.9Females
- 37.6Median age for White alone residents
- 35.9Males
- 40.5Females
- 48.6Median age for Hispanic or Latino residents
- 50.6Males
- 27.1Females
Owner/renter occupied households by race in Keene
- House owners and renters - White residents
- 4,73652.9%Owner occupied
- 4,21247.1%Renter occupied
- House owners and renters - Black or African American residents
- 710.6%Owner occupied
- 5689.4%Renter occupied
- House owners and renters - Asian residents
- 1225.0%Owner occupied
- 3675.0%Renter occupied
- House owners and renters - Other race residents
- 87100.0%Owner occupied
- House owners and renters - Two or more races residents
- 26268.1%Owner occupied
- 12331.9%Renter occupied
- House owners and renters - White alone residents
- 4,69053.1%Owner occupied
- 4,13746.9%Renter occupied
- House owners and renters - Hispanic or Latino residents
- 8130.1%Owner occupied
- 18969.9%Renter occupied
Language usage in Keene
- English speakers - Total
- 95.8% of residents of Keene speak English at home.
- 0.9% of residents speak Spanish at home
- 15478.2%Speak English very well
- 4321.8%Speak English less than very well
- 3.3% of residents speak other language at home
- 56676.8%Speak English very well
- 17123.2%Speak English less than very well
- English speakers - Born in the United States
- 98.7% of residents of Keene speak English at home.
- 0.6% of residents speak Spanish at home
- 3149.2%Speak English very well
- 3250.8%Speak English less than very well
- 0.9% of residents speak other language at home
- 9892.5%Speak English very well
- 87.5%Speak English less than very well
All residents speak only English at home
- English speakers - Foreign-born
- 32.5% of residents of Keene speak English at home.
- 13.4% of residents speak Spanish at home
- 130100.0%Speak English very well
- 50.6% of residents speak other language at home
- 33868.8%Speak English very well
- 15331.2%Speak English less than very well
White (Caucasian) - Speak only English
| Native: | 98.0% (19,454) |
| Foreign-born: | 32.8% (220) |
White (Caucasian) - Speak another language
| Native: | 2.1% (412) |
| Foreign-born: | 70.7% (474) |
Black or African American - Speak only English
| Native: | 100.0% (94) |
| Foreign-born: | 37.7% (40) |
Asian - Speak only English
| Native: | 8.5% (1) |
| Foreign-born: | 22.9% (32) |
Asian - Speak another language
| Native: | 100.0% (11) |
| Foreign-born: | 77.2% (109) |
Other race - Speak another language
| Native: | 5.2% (6) |
| Foreign-born: | 100.0% (46) |
Two or more races - Speak only English
| Native: | 97.6% (1,127) |
| Foreign-born: | 55.9% (150) |
White alone - Speak only English
| Native: | 98.0% (19,295) |
| Foreign-born: | 35.6% (224) |
White alone - Speak another language
| Native: | 2.1% (405) |
| Foreign-born: | 70.2% (442) |
Hispanic or Latino - Speak another language
| Native: | 5.6% (20) |
| Foreign-born: | 100.0% (147) |
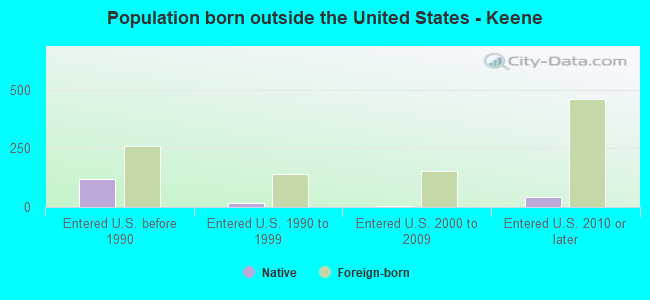
Foreign-born residents in Keene
970 residents are foreign born (1.3% Europe, 1.2% Asia, 0.7% Africa, 0.5% North America).
| This city: | 4.2% |
| New Hampshire: | 6.0% |

Marital status for residents in Keene
Marital status - White (Caucasian) population 15 years and over
- Males
- 47.4%Never married
- 35.9%Now married
- 0.4%Separated
- 3.5%Widowed
- 12.8%Divorced
- Females
- 40.0%Never married
- 35.3%Now married
- 0.8%Separated
- 8.4%Widowed
- 15.5%Divorced
Women who gave birth in the past 12 months
| Now married: | 84.7% (127) |
| Unmarried: | 15.3% (23) |
Women who did not give birth in the past 12 months
| Now married: | 25.5% (1,330) |
| Unmarried: | 74.5% (3,887) |
Marital status - Black or African American population 15 years and over
- Males
- 31.3%Never married
- 68.7%Now married
- 0.0%Separated
- 0.0%Widowed
- 0.0%Divorced
- Females
- 56.6%Never married
- 35.7%Now married
- 0.0%Separated
- 0.0%Widowed
- 7.8%Divorced
Women who did not give birth in the past 12 months
| Now married: | 38.7% (45) |
| Unmarried: | 61.3% (71) |
Marital status - American Indian / Alaska Native population 15 years and over
- Males
- 0.0%Never married
- 0.0%Now married
- 0.0%Separated
- 0.0%Widowed
- 100.0%Divorced
- Females
- 0.0%Never married
- 100.0%Now married
- 0.0%Separated
- 0.0%Widowed
- 0.0%Divorced
Women who did not give birth in the past 12 months
| Now married: | 100.0% (20) |
| Unmarried: | 0.0% (0) |
Marital status - Asian population 15 years and over
- Males
- 41.4%Never married
- 58.6%Now married
- 0.0%Separated
- 0.0%Widowed
- 0.0%Divorced
- Females
- 59.5%Never married
- 22.6%Now married
- 0.0%Separated
- 1.2%Widowed
- 16.7%Divorced
Women who did not give birth in the past 12 months
| Now married: | 22.9% (19) |
| Unmarried: | 77.1% (65) |
Marital status - Other race population 15 years and over
- Males
- 39.8%Never married
- 60.2%Now married
- 0.0%Separated
- 0.0%Widowed
- 0.0%Divorced
- Females
- 37.5%Never married
- 62.5%Now married
- 0.0%Separated
- 0.0%Widowed
- 0.0%Divorced
Women who did not give birth in the past 12 months
| Now married: | 0.0% (0) |
| Unmarried: | 100.0% (11) |
Marital status - Two or more races population 15 years and over
- Males
- 49.2%Never married
- 28.0%Now married
- 18.6%Separated
- 0.0%Widowed
- 4.2%Divorced
- Females
- 68.7%Never married
- 22.7%Now married
- 0.0%Separated
- 0.0%Widowed
- 8.7%Divorced
Women who did not give birth in the past 12 months
| Now married: | 25.3% (140) |
| Unmarried: | 74.7% (414) |
Marital status - White alone, not Hispanic / Latino population 15 years and over
- Males
- 47.4%Never married
- 35.8%Now married
- 0.4%Separated
- 3.5%Widowed
- 12.9%Divorced
- Females
- 40.1%Never married
- 35.1%Now married
- 0.8%Separated
- 8.4%Widowed
- 15.6%Divorced
Women who gave birth in the past 12 months
| Now married: | 76.2% (74) |
| Unmarried: | 23.8% (23) |
Women who did not give birth in the past 12 months
| Now married: | 25.6% (1,342) |
| Unmarried: | 74.4% (3,891) |
Marital status - Hispanic or Latino population 15 years and over
- Males
- 52.3%Never married
- 16.2%Now married
- 31.5%Separated
- 0.0%Widowed
- 0.0%Divorced
- Females
- 69.5%Never married
- 26.3%Now married
- 0.0%Separated
- 4.2%Widowed
- 0.0%Divorced
Women who gave birth in the past 12 months
| Now married: | 100.0% (61) |
| Unmarried: | 0.0% (0) |
Women who did not give birth in the past 12 months
| Now married: | 0.0% (0) |
| Unmarried: | 100.0% (161) |
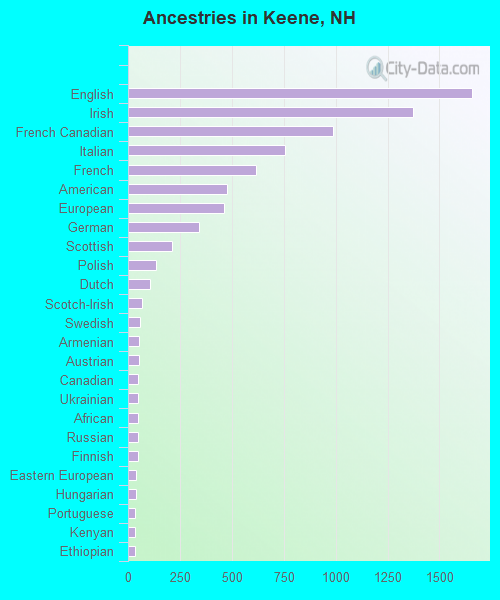
Ancestries in Keene

- 1,65618.9%English
- 1,37315.7%Irish
- 98611.3%French Canadian
- 7558.6%Italian
- 6157.0%French
- 4775.5%American
- 4615.3%European
- 3403.9%German
- 2122.4%Scottish
- 1361.6%Polish
- 1051.2%Dutch
- 690.8%Scotch-Irish
- 570.7%Swedish
- 550.6%Armenian
- 530.6%Austrian
- 490.6%Canadian
- 480.5%Ukrainian
- 470.5%African
- 460.5%Russian
- 460.5%Finnish
- 400.5%Eastern European
- 400.5%Hungarian
- 350.4%Portuguese
- 330.4%Kenyan
- 320.4%Ethiopian
- 310.4%British
- 300.3%Norwegian
- 240.3%Lebanese
- 170.2%Greek
- 170.2%West Indian
- 160.2%Slavic
- 100.1%Romanian
- 100.1%Belgian
- 80.09%Bulgarian
- 70.08%Czech
- 60.07%Turkish
- 50.06%Scandinavian
- 40.05%Pennsylvania German
- 10.01%Danish
- 10.01%Nigerian
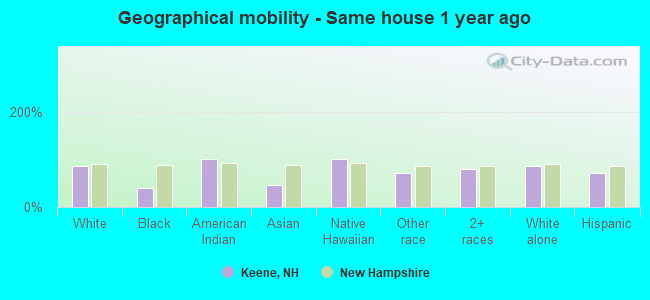
Geographical mobility in Keene

- Same house 1 year ago
- 18,09385.5%White (Caucasian)
- 8840.3%Black or African American
- 26100.0%American Indian / Alaska Native
- 7046.4%Asian
- 8100.0%Native Hawaiian / Pacific Islander
- 12971.1%Other race
- 1,21780.0%Two or more races
- 17,85385.3%White alone, not Hispanic / Latino
- 39472.4%Hispanic or Latino
-
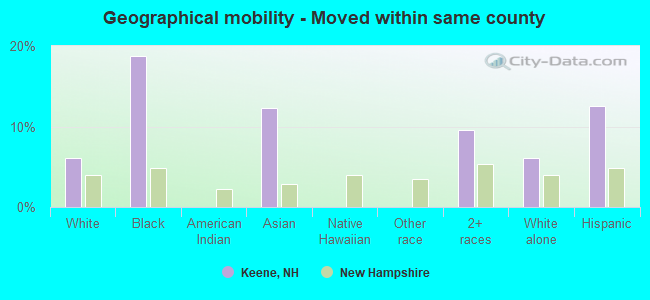
- Moved within same county
- 1,2806.0%White / Caucasian
- 4118.8%Black or African American
- 1912.3%Asian
- 1459.5%Two or more races
- 1,2806.1%White alone, not Hispanic / Latino
- 6812.6%Hispanic or Latino
-
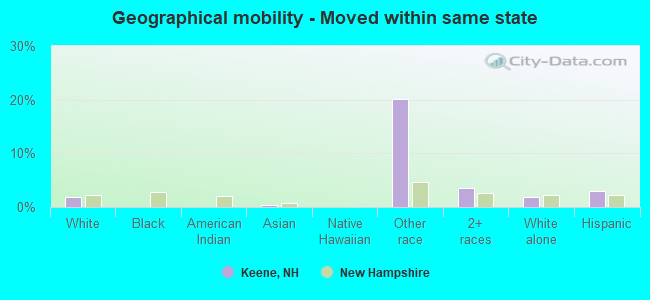
- Moved within same state
- 3991.9%White / Caucasian
- 00.3%Asian
- 3620.1%Other race
- 533.5%Two or more races
- 3991.9%White alone, not Hispanic / Latino
- 173.1%Hispanic or Latino
-
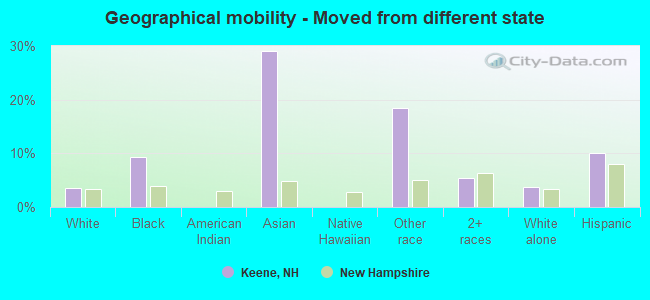
- Moved from different state
- 7563.6%White / Caucasian
- 219.4%Black or African American
- 4429.1%Asian
- 3318.4%Other race
- 825.4%Two or more races
- 7643.7%White alone, not Hispanic / Latino
- 5510.0%Hispanic or Latino
-
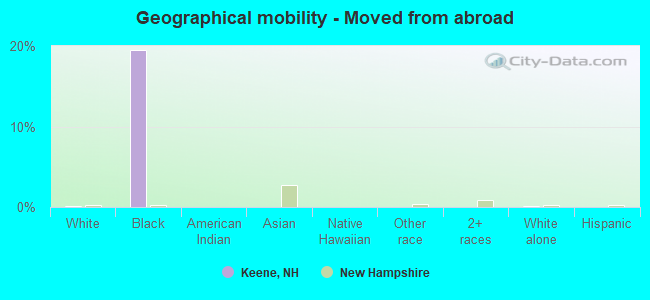
- Moved from abroad
- 270.1%White
- 4319.5%Black or African American
- 270.1%White alone, not Hispanic / Latino
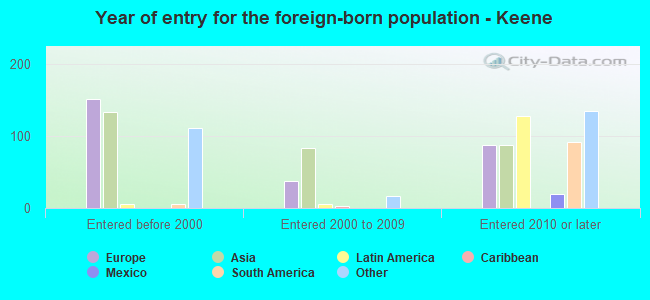
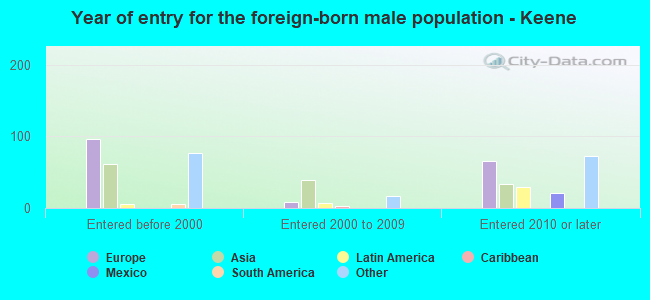
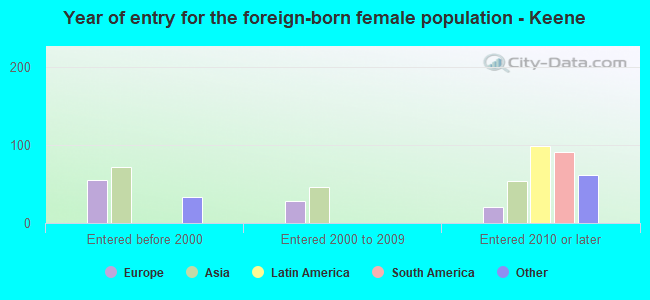
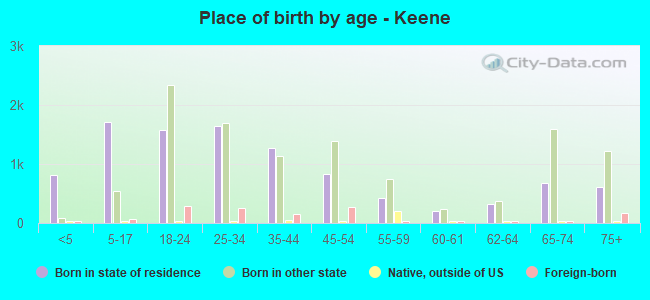
Children Nativity (place of birth) in Keene
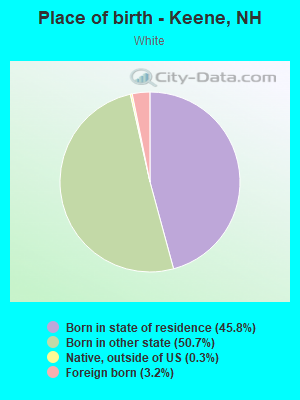
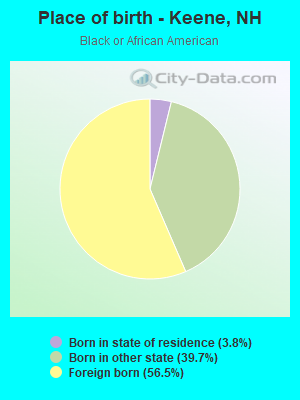
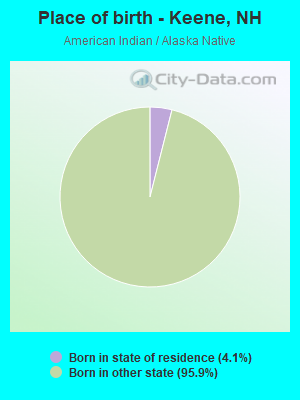
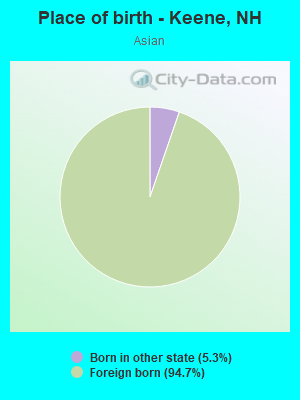
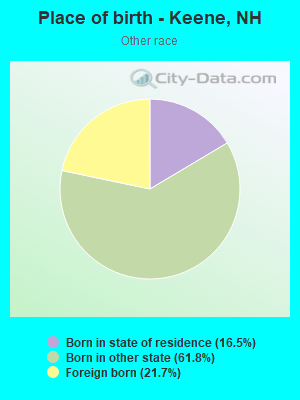
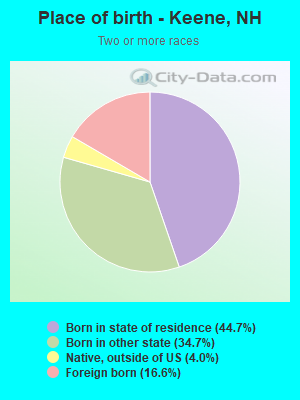
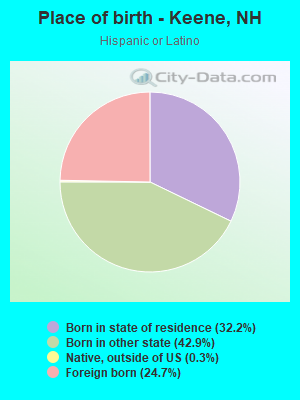
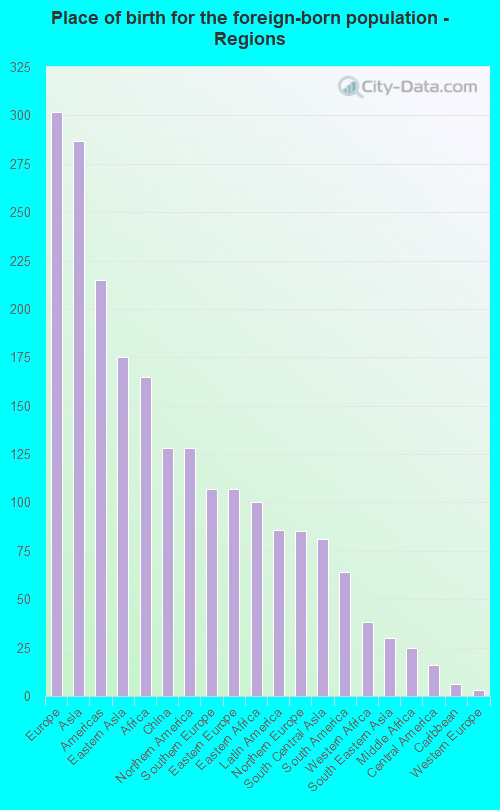
Place of birth for residents in Keene
![Place of birth for the foreign-born population - Regions]()
- 302Europe
- 287Asia
- 215Americas
- 175Eastern Asia
- 165Africa
- 128China
- 128Northern America
- 107Southern Europe
- 107Eastern Europe
- 100Eastern Africa
- 86Latin America
- 85Northern Europe
- 81South Central Asia
- 64South America
- 38Western Africa
- 30South Eastern Asia
- 25Middle Africa
- 16Central America
- 6Caribbean
- 3Western Europe
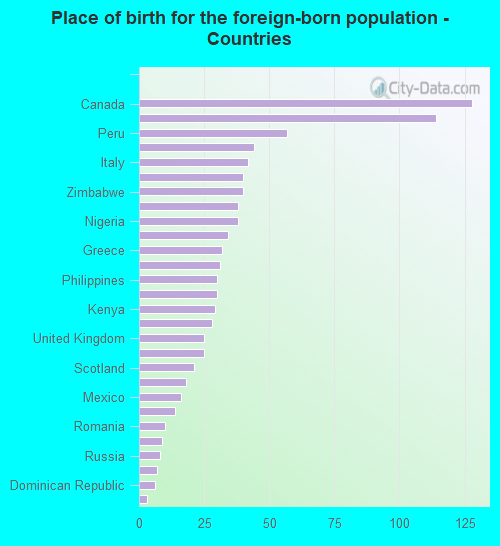
![Place of birth for the foreign-born population - Countries]()
- 128Canada
- 114China
- 57Peru
- 44Ukraine
- 42Italy
- 40India
- 40Zimbabwe
- 38England
- 38Nigeria
- 34Hungary
- 32Greece
- 31Spain
- 30Philippines
- 30Ethiopia
- 29Kenya
- 28Korea
- 25United Kingdom
- 25Democratic Republic of Congo (Zaire)
- 21Scotland
- 18Japan
- 16Mexico
- 14Taiwan
- 10Romania
- 9Bulgaria
- 8Russia
- 7Colombia
- 6Dominican Republic
- 3Germany
Zip codes: 03431.