Races in Liberal, Kansas (KS) Detailed Stats
Data:
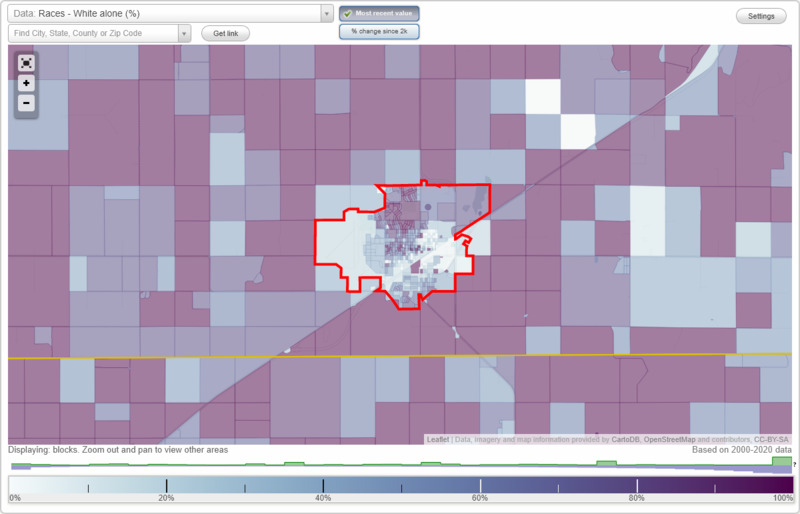
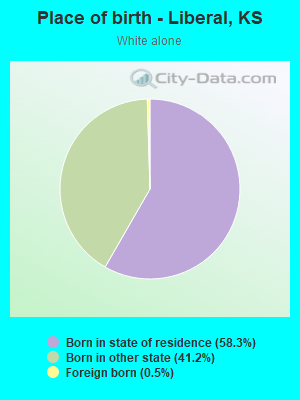
Races - White alone (%)
Races - White alone (% change since 2000)
Races - Black alone (%)
Races - Black alone (% change since 2000)
Races - American Indian alone (%)
Races - American Indian alone (% change since 2000)
Races - Asian alone (%)
Races - Asian alone (% change since 2000)
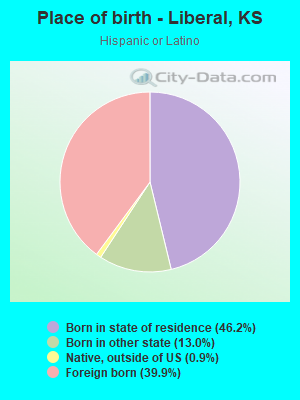
Races - Hispanic (%)
Races - Hispanic (% change since 2000)
Races - Native Hawaiian and Other Pacific Islander alone (%)
Races - Native Hawaiian and Other Pacific Islander alone (% change since 2000)
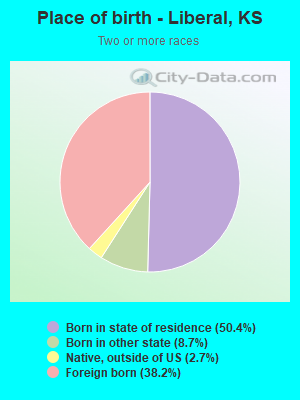
Races - Two or more races(%)
Races - Two or more races(% change since 2000)
Races - Other race alone (%)
Races - Other race alone (% change since 2000)
Racial diversity
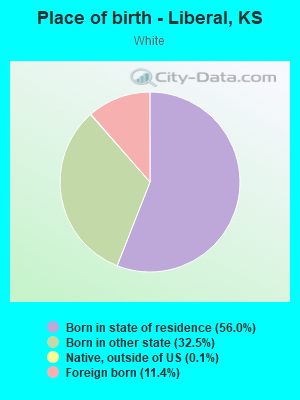
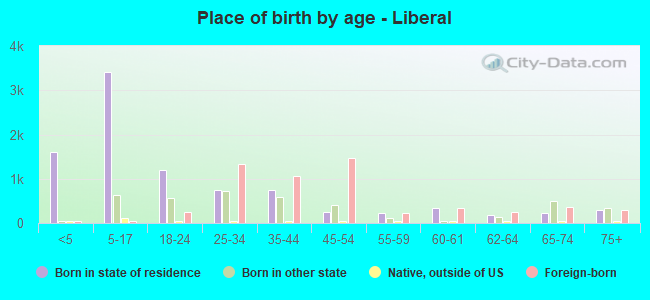
Place of birth - Born in state of residence (%)
Place of birth - Born in state of residence (%) - White
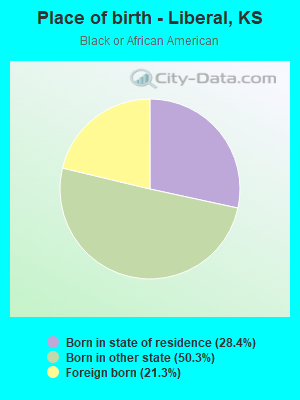
Place of birth - Born in state of residence (%) - Black or African American
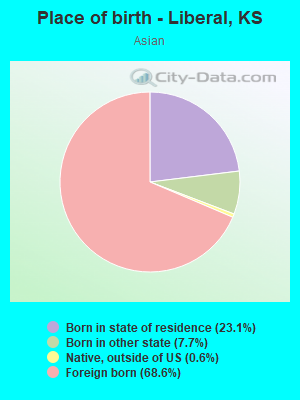
Place of birth - Born in state of residence (%) - Asian
Place of birth - Born in state of residence (%) - Hispanic or Latino
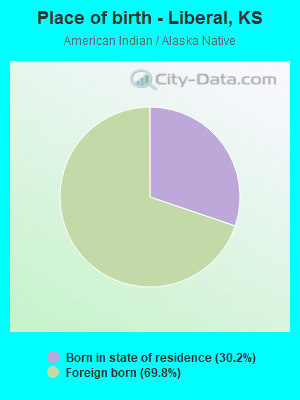
Place of birth - Born in state of residence (%) - American Indian and Alaska Native
Place of birth - Born in state of residence (%) - Multirace
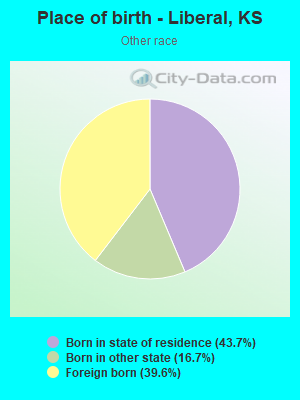
Place of birth - Born in state of residence (%) - Other Race
Place of birth - Born in other state (%)
Place of birth - Born in other state (%) - White
Place of birth - Born in other state (%) - Black or African American
Place of birth - Born in other state (%) - Asian
Place of birth - Born in other state (%) - Hispanic or Latino
Place of birth - Born in other state (%) - American Indian and Alaska Native
Place of birth - Born in other state (%) - Multirace
Place of birth - Born in other state (%) - Other Race
Place of birth - Native, outside of US (%)
Place of birth - Native, outside of US (%) - White
Place of birth - Native, outside of US (%) - Black or African American
Place of birth - Native, outside of US (%) - Asian
Place of birth - Native, outside of US (%) - Hispanic or Latino
Place of birth - Native, outside of US (%) - American Indian and Alaska Native
Place of birth - Native, outside of US (%) - Multirace
Place of birth - Native, outside of US (%) - Other Race
Place of birth - Foreign born (%)
Place of birth - Foreign born (%) - White
Place of birth - Foreign born (%) - Black or African American
Place of birth - Foreign born (%) - Asian
Place of birth - Foreign born (%) - Hispanic or Latino
Place of birth - Foreign born (%) - American Indian and Alaska Native
Place of birth - Foreign born (%) - Multirace
Place of birth - Foreign born (%) - Other Race
Residents speaking English at home (%)
Residents speaking English at home - Born in the United States (%)
Residents speaking English at home - Native, born elsewhere (%)
Residents speaking English at home - Foreign born (%)
Residents speaking Spanish at home (%)
Residents speaking Spanish at home - Born in the United States (%)
Residents speaking Spanish at home - Native, born elsewhere (%)
Residents speaking Spanish at home - Foreign born (%)
Residents speaking other language at home (%)
Residents speaking other language at home - Born in the United States (%)
Residents speaking other language at home - Native, born elsewhere (%)
Residents speaking other language at home - Foreign born (%)
Marital status - Never married (%)
Marital status - Now married (%)
Marital status - Separated (%)
Marital status - Widowed (%)
Marital status - Divorced (%)
Ancestries Reported - Arab (%)
Ancestries Reported - Czech (%)
Ancestries Reported - Danish (%)
Ancestries Reported - Dutch (%)
Ancestries Reported - English (%)
Ancestries Reported - French (%)
Ancestries Reported - French Canadian (%)
Ancestries Reported - German (%)
Ancestries Reported - Greek (%)
Ancestries Reported - Hungarian (%)
Ancestries Reported - Irish (%)
Ancestries Reported - Italian (%)
Ancestries Reported - Lithuanian (%)
Ancestries Reported - Norwegian (%)
Ancestries Reported - Polish (%)
Ancestries Reported - Portuguese (%)
Ancestries Reported - Russian (%)
Ancestries Reported - Scotch-Irish (%)
Ancestries Reported - Scottish (%)
Ancestries Reported - Slovak (%)
Ancestries Reported - Subsaharan African (%)
Ancestries Reported - Swedish (%)
Ancestries Reported - Swiss (%)
Ancestries Reported - Ukrainian (%)
Ancestries Reported - United States (%)
Ancestries Reported - Welsh (%)
Ancestries Reported - West Indian (%)
Ancestries Reported - Other (%)
Geographical mobility - Same house 1 year ago (%)
Geographical mobility - Same house 1 year ago (%) - White
Geographical mobility - Same house 1 year ago (%) - Black or African American
Geographical mobility - Same house 1 year ago (%) - Asian
Geographical mobility - Same house 1 year ago (%) - Hispanic or Latino
Geographical mobility - Same house 1 year ago (%) - American Indian and Alaska Native
Geographical mobility - Same house 1 year ago (%) - Multirace
Geographical mobility - Same house 1 year ago (%) - Other Race
Geographical mobility - Moved within same county (%)
Geographical mobility - Moved within same county (%) - White
Geographical mobility - Moved within same county (%) - Black or African American
Geographical mobility - Moved within same county (%) - Asian
Geographical mobility - Moved within same county (%) - Hispanic or Latino
Geographical mobility - Moved within same county (%) - American Indian and Alaska Native
Geographical mobility - Moved within same county (%) - Multirace
Geographical mobility - Moved within same county (%) - Other Race
Geographical mobility - Moved from different county within same state (%)
Geographical mobility - Moved from different county within same state (%) - White
Geographical mobility - Moved from different county within same state (%) - Black or African American
Geographical mobility - Moved from different county within same state (%) - Asian
Geographical mobility - Moved from different county within same state (%) - Hispanic or Latino
Geographical mobility - Moved from different county within same state (%) - American Indian and Alaska Native
Geographical mobility - Moved from different county within same state (%) - Multirace
Geographical mobility - Moved from different county within same state (%) - Other Race
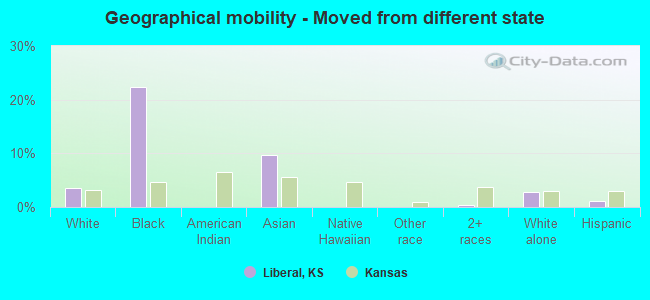
Geographical mobility - Moved from different state (%)
Geographical mobility - Moved from different state (%) - White
Geographical mobility - Moved from different state (%) - Black or African American
Geographical mobility - Moved from different state (%) - Asian
Geographical mobility - Moved from different state (%) - Hispanic or Latino
Geographical mobility - Moved from different state (%) - American Indian and Alaska Native
Geographical mobility - Moved from different state (%) - Multirace
Geographical mobility - Moved from different state (%) - Other Race
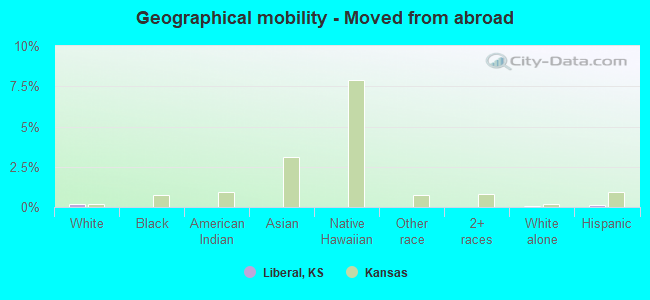
Geographical mobility - Moved from abroad (%)
Geographical mobility - Moved from abroad (%) - White
Geographical mobility - Moved from abroad (%) - Black or African American
Geographical mobility - Moved from abroad (%) - Asian
Geographical mobility - Moved from abroad (%) - Hispanic or Latino
Geographical mobility - Moved from abroad (%) - American Indian and Alaska Native
Geographical mobility - Moved from abroad (%) - Multirace
Geographical mobility - Moved from abroad (%) - Other Race
Place of birth for the foreign-born population - Ireland (%)
Place of birth for the foreign-born population - Denmark (%)
Place of birth for the foreign-born population - Norway (%)
Place of birth for the foreign-born population - Sweden (%)
Place of birth for the foreign-born population - United Kingdom (%)
Place of birth for the foreign-born population - England (%)
Place of birth for the foreign-born population - Scotland (%)
Place of birth for the foreign-born population - Other Northern Europe (%)
Place of birth for the foreign-born population - Austria (%)
Place of birth for the foreign-born population - Belgium (%)
Place of birth for the foreign-born population - France (%)
Place of birth for the foreign-born population - Germany (%)
Place of birth for the foreign-born population - Netherlands (%)
Place of birth for the foreign-born population - Switzerland (%)
Place of birth for the foreign-born population - Other Western Europe (%)
Place of birth for the foreign-born population - Greece (%)
Place of birth for the foreign-born population - Italy (%)
Place of birth for the foreign-born population - Portugal (%)
Place of birth for the foreign-born population - Spain (%)
Place of birth for the foreign-born population - Other Southern Europe (%)
Place of birth for the foreign-born population - Albania (%)
Place of birth for the foreign-born population - Belarus (%)
Place of birth for the foreign-born population - Bosnia and Herzegovina (%)
Place of birth for the foreign-born population - Bulgaria (%)
Place of birth for the foreign-born population - Croatia (%)
Place of birth for the foreign-born population - Czechoslovakia (%)
Place of birth for the foreign-born population - Hungary (%)
Place of birth for the foreign-born population - Latvia (%)
Place of birth for the foreign-born population - Lithuania (%)
Place of birth for the foreign-born population - North Macedonia (Macedonia) (%)
Place of birth for the foreign-born population - Moldova (%)
Place of birth for the foreign-born population - Poland (%)
Place of birth for the foreign-born population - Romania (%)
Place of birth for the foreign-born population - Russia (%)
Place of birth for the foreign-born population - Serbia (%)
Place of birth for the foreign-born population - Ukraine (%)
Place of birth for the foreign-born population - Other Eastern Europe (%)
Place of birth for the foreign-born population - China (%)
Place of birth for the foreign-born population - Hong Kong (%)
Place of birth for the foreign-born population - Taiwan (%)
Place of birth for the foreign-born population - Japan (%)
Place of birth for the foreign-born population - Korea (%)
Place of birth for the foreign-born population - Other Eastern Asia (%)
Place of birth for the foreign-born population - Afghanistan (%)
Place of birth for the foreign-born population - Bangladesh (%)
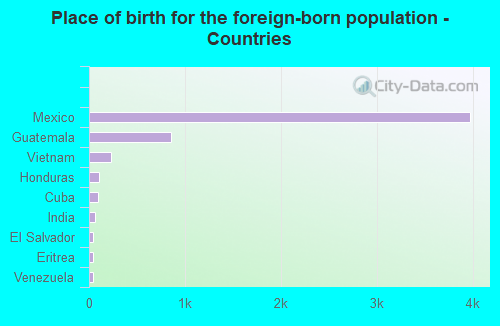
Place of birth for the foreign-born population - India (%)
Place of birth for the foreign-born population - Iran (%)
Place of birth for the foreign-born population - Kazakhstan (%)
Place of birth for the foreign-born population - Nepal (%)
Place of birth for the foreign-born population - Pakistan (%)
Place of birth for the foreign-born population - Sri Lanka (%)
Place of birth for the foreign-born population - Uzbekistan (%)
Place of birth for the foreign-born population - Other South Central Asia (%)
Place of birth for the foreign-born population - Burma (%)
Place of birth for the foreign-born population - Cambodia (%)
Place of birth for the foreign-born population - Indonesia (%)
Place of birth for the foreign-born population - Laos (%)
Place of birth for the foreign-born population - Malaysia (%)
Place of birth for the foreign-born population - Philippines (%)
Place of birth for the foreign-born population - Singapore (%)
Place of birth for the foreign-born population - Thailand (%)
Place of birth for the foreign-born population - Vietnam (%)
Place of birth for the foreign-born population - Other South Eastern Asia (%)
Place of birth for the foreign-born population - Armenia (%)
Place of birth for the foreign-born population - Iraq (%)
Place of birth for the foreign-born population - Israel (%)
Place of birth for the foreign-born population - Jordan (%)
Place of birth for the foreign-born population - Kuwait (%)
Place of birth for the foreign-born population - Lebanon (%)
Place of birth for the foreign-born population - Saudi Arabia (%)
Place of birth for the foreign-born population - Syria (%)
Place of birth for the foreign-born population - Turkey (%)
Place of birth for the foreign-born population - Yemen (%)
Place of birth for the foreign-born population - Other Western Asia (%)
Place of birth for the foreign-born population - Eritrea (%)
Place of birth for the foreign-born population - Ethiopia (%)
Place of birth for the foreign-born population - Kenya (%)
Place of birth for the foreign-born population - Somalia (%)
Place of birth for the foreign-born population - Uganda (%)
Place of birth for the foreign-born population - Zimbabwe (%)
Place of birth for the foreign-born population - Other Eastern Africa (%)
Place of birth for the foreign-born population - Cameroon (%)
Place of birth for the foreign-born population - Congo (%)
Place of birth for the foreign-born population - Democratic Republic of Congo (Zaire) (%)
Place of birth for the foreign-born population - Other Middle Africa (%)
Place of birth for the foreign-born population - Egypt (%)
Place of birth for the foreign-born population - Morocco (%)
Place of birth for the foreign-born population - Sudan (%)
Place of birth for the foreign-born population - Other Northern Africa (%)
Place of birth for the foreign-born population - South Africa (%)
Place of birth for the foreign-born population - Other Southern Africa (%)
Place of birth for the foreign-born population - Cabo Verde (%)
Place of birth for the foreign-born population - Ghana (%)
Place of birth for the foreign-born population - Liberia (%)
Place of birth for the foreign-born population - Nigeria (%)
Place of birth for the foreign-born population - Senegal (%)
Place of birth for the foreign-born population - Sierra Leone (%)
Place of birth for the foreign-born population - Other Western Africa (%)
Place of birth for the foreign-born population - Australia (%)
Place of birth for the foreign-born population - New Zealand (%)
Place of birth for the foreign-born population - Fiji (%)
Place of birth for the foreign-born population - Micronesia (%)
Place of birth for the foreign-born population - Bahamas (%)
Place of birth for the foreign-born population - Barbados (%)
Place of birth for the foreign-born population - Cuba (%)
Place of birth for the foreign-born population - Dominica (%)
Place of birth for the foreign-born population - Dominican Republic (%)
Place of birth for the foreign-born population - Grenada (%)
Place of birth for the foreign-born population - Haiti (%)
Place of birth for the foreign-born population - Jamaica (%)
Place of birth for the foreign-born population - St. Vincent and the Grenadines (%)
Place of birth for the foreign-born population - Trinidad and Tobago (%)
Place of birth for the foreign-born population - West Indies (%)
Place of birth for the foreign-born population - Other Caribbean (%)
Place of birth for the foreign-born population - Belize (%)
Place of birth for the foreign-born population - Costa Rica (%)
Place of birth for the foreign-born population - El Salvador (%)
Place of birth for the foreign-born population - Guatemala (%)
Place of birth for the foreign-born population - Honduras (%)
Place of birth for the foreign-born population - Mexico (%)
Place of birth for the foreign-born population - Nicaragua (%)
Place of birth for the foreign-born population - Panama (%)
Place of birth for the foreign-born population - Other Central America (%)
Place of birth for the foreign-born population - Argentina (%)
Place of birth for the foreign-born population - Bolivia (%)
Place of birth for the foreign-born population - Brazil (%)
Place of birth for the foreign-born population - Chile (%)
Place of birth for the foreign-born population - Colombia (%)
Place of birth for the foreign-born population - Ecuador (%)
Place of birth for the foreign-born population - Guyana (%)
Place of birth for the foreign-born population - Peru (%)
Place of birth for the foreign-born population - Uruguay (%)
Place of birth for the foreign-born population - Venezuela (%)
Place of birth for the foreign-born population - Other South America (%)
Place of birth for the foreign-born population - Canada (%)
Place of birth for the foreign-born population - Other Northern America (%)
Place of birth for the foreign-born population - Other (%)
Latest news about races in Liberal, KS collected exclusively by city-data.com from local newspapers, TV, and radio stations
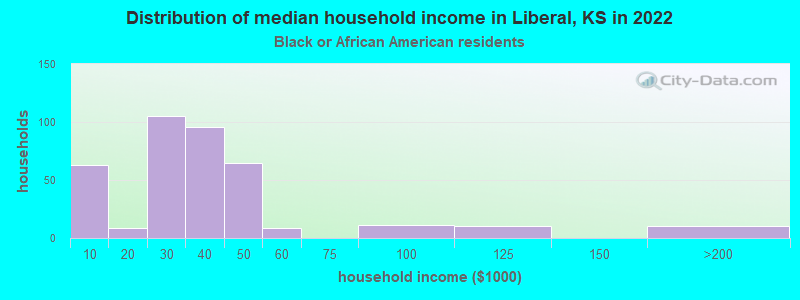
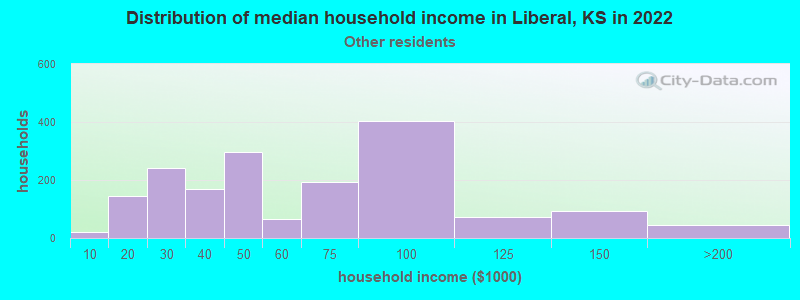
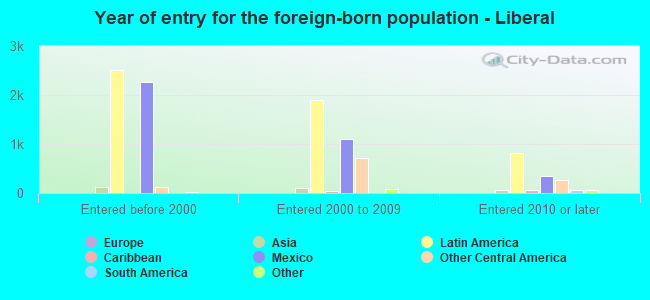
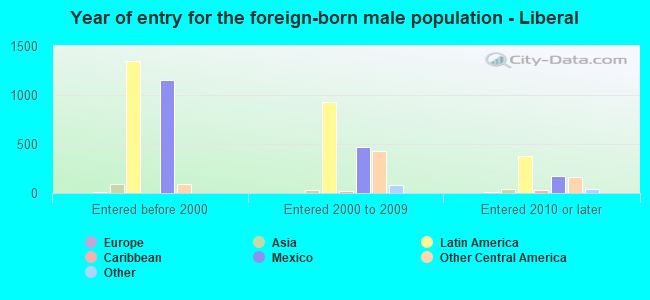
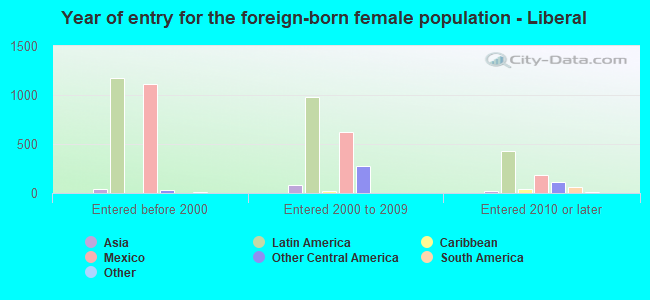
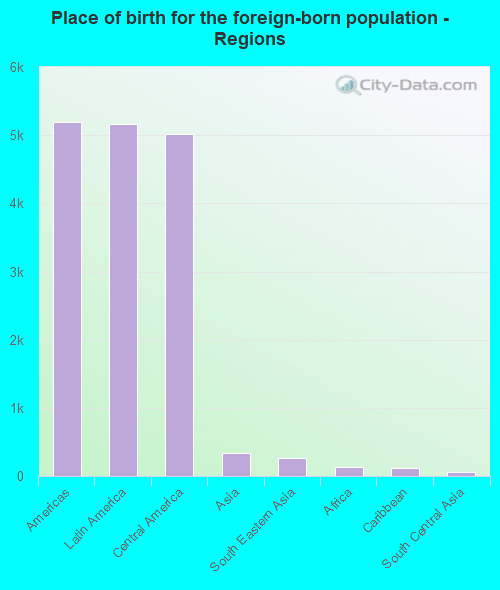
According to 2022 data, the most numerous races in Liberal, KS are White alone (4,743 residents), Hispanic (13,051 residents), and Black alone (607 residents). 40.0% of Liberal residents speak English at home. 29.8% of Liberal, KS residents are foreign-born (26.5% born in Latin America), which is 76.5% greater than the foreign-born rate of 7.0% across the entire state of Kansas.
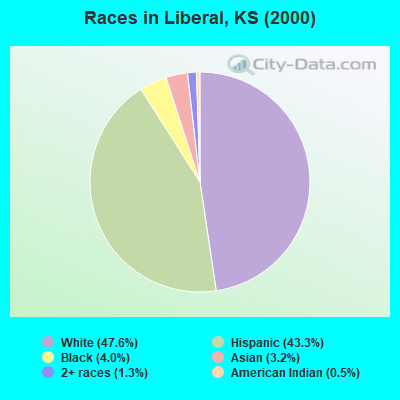
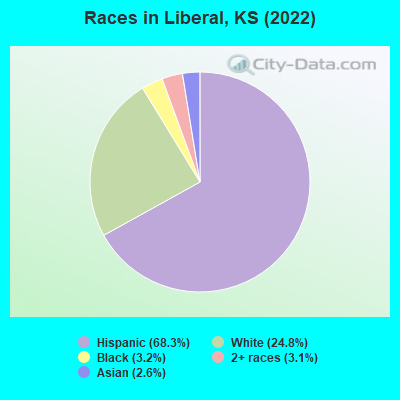
Race distribution in Liberal
2000 2022
2,233,997 83.1% White alone 188,252 7.0% Hispanic 151,407 5.6% Black alone 46,301 1.7% Asian alone 42,508 1.6% Two or more races 22,322 0.8% American Indian alone 2,477 0.09% Other race alone 1,154 0.04% Native Hawaiian and Other
2,147,943 73.1% White alone 381,746 13.0% Hispanic 147,666 5.0% Black alone 145,362 4.9% Two or more races 85,085 2.9% Asian alone 13,263 0.5% Other race alone 12,065 0.4% American Indian alone 4,020 0.1% Native Hawaiian and Other
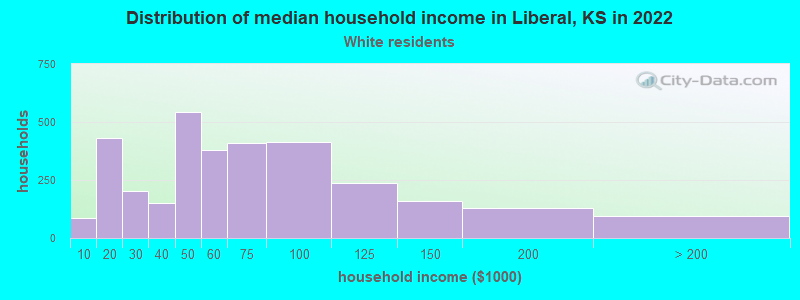
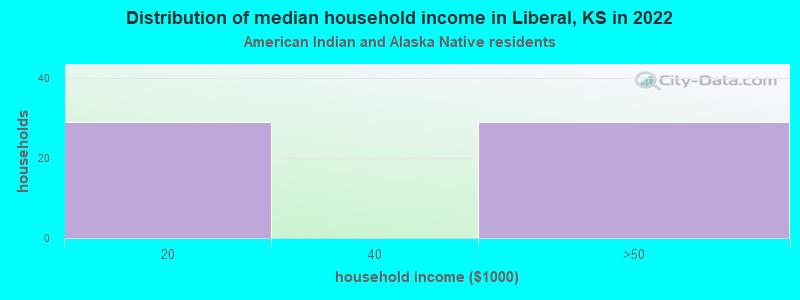
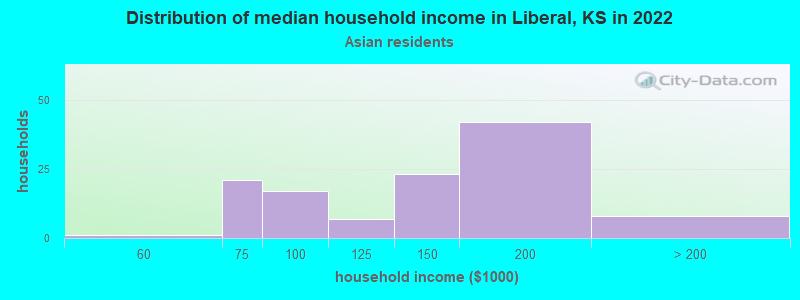
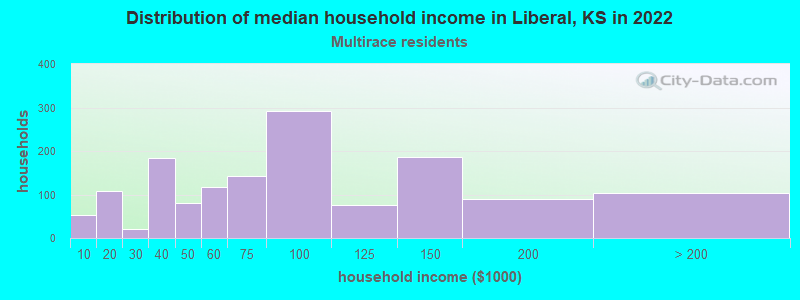
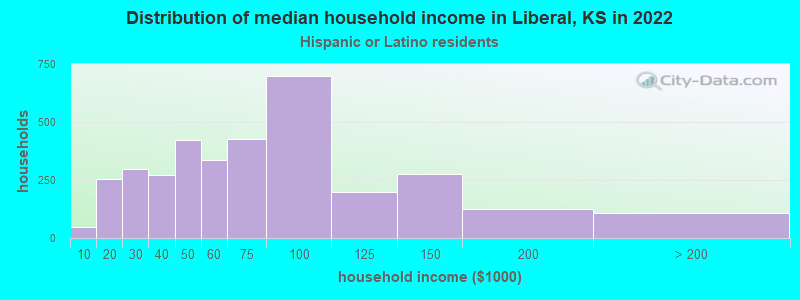
Income and house value in Liberal Median household income in 2022 $50,658 White non-Hispanic householders$31,701 Black householders$134,931 Asian householders$49,966 Some other race householders$79,192 Two or more races householders$63,787 Hispanic or Latino race householdersMedian 2022 house value $168,644 White Non-Hispanic householders$138,744 Black or African American householders$295,772 American Indian or Alaska Native householders $105,832 Asian householders$124,547 Some other race householders$112,931 Two or more races householders$121,535 Hispanic or Latino householders
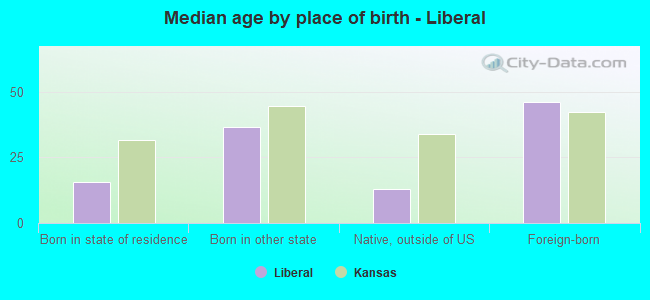
Median age by race in Liberal
35.0 Median age for White residents35.5 34.2 38.4 Median age for Black or African American residents39.0 29.8 28.5 Median age for American Indian / Alaska Native residents45.5 24.7 45.2 Median age for Asian residents40.5 44.1 -627,039,626.4 Median age for Native Hawaiian / Pacific Islander residents-669,240,668.6 -641,269,840.6 26.1 Median age for Other race residents25.4 30.8 23.4 Median age for Two or more races residents23.0 27.7 46.4 Median age for White alone residents45.1 48.4 24.8 Median age for Hispanic or Latino residents24.3 25.4
Owner/renter occupied households by race in Liberal
House owners and renters - White residents 2,107 65.3% Owner occupied1,118 34.7% Renter occupiedHouse owners and renters - Black or African American residents 53 13.8% Owner occupied330 86.2% Renter occupiedHouse owners and renters - American Indian / Alaska Native residents 35 59.4% Owner occupied24 40.6% Renter occupiedHouse owners and renters - Asian residents 87 71.5% Owner occupied35 28.5% Renter occupiedHouse owners and renters - Other race residents 1,258 71.6% Owner occupied499 28.4% Renter occupiedHouse owners and renters - Two or more races residents 1,021 69.3% Owner occupied452 30.7% Renter occupiedHouse owners and renters - White alone residents 1,419 62.9% Owner occupied838 37.1% Renter occupiedHouse owners and renters - Hispanic or Latino residents 2,563 72.1% Owner occupied993 27.9% Renter occupied
Language usage in Liberal
English speakers - Total 40.0% of residents of Liberal speak English at home.
57.3% of residents speak Spanish at home 5,031 50.4% Speak English very well4,956 49.6% Speak English less than very well3.2% of residents speak other language at home 154 27.5% Speak English very well407 72.5% Speak English less than very well
English speakers - Born in the United States 64.6% of residents of Liberal speak English at home.
35.6% of residents speak Spanish at home 1,211 84.0% Speak English very well231 16.0% Speak English less than very well0.8% of residents speak other language at home 22 64.7% Speak English very well12 35.3% Speak English less than very well
English speakers - Native, born elsewhere 3.0% of residents of Liberal speak English at home.
82.0% of residents speak Spanish at home 109 100.0% Speak English very well
English speakers - Foreign-born 2.8% of residents of Liberal speak English at home.
89.1% of residents speak Spanish at home 769 15.4% Speak English very well4,217 84.6% Speak English less than very well7.8% of residents speak other language at home 33 7.6% Speak English very well401 92.4% Speak English less than very well
White (Caucasian) - Speak only English Native:
79.4% (4,866)Foreign-born:
3.4% (29)
White (Caucasian) - Speak another language Native:
14.0% (861)Foreign-born:
85.4% (741)
Black or African American - Speak another language Native:
3.3% (16)Foreign-born:
98.2% (127)
American Indian / Alaska Native - Speak another language Native:
100.0% (90)Foreign-born:
100.0% (305)
Asian - Speak only English Native:
33.2% (45)Foreign-born:
12.8% (43)
Asian - Speak another language Native:
59.7% (81)Foreign-born:
87.3% (292)
Other race - Speak another language Native:
70.1% (2,415)Foreign-born:
96.6% (2,527)
Two or more races - Speak only English Native:
30.3% (887)Foreign-born:
4.8% (107)
Two or more races - Speak another language Native:
84.6% (2,476)Foreign-born:
95.7% (2,148)
White alone - Speak only English Native:
97.5% (4,403)Foreign-born:
24.1% (5)
White alone - Speak another language Native:
2.3% (103)Foreign-born:
78.4% (18)
Hispanic or Latino - Speak only English Native:
22.7% (1,457)Foreign-born:
2.4% (126)
Hispanic or Latino - Speak another language Native:
76.7% (4,917)Foreign-born:
96.5% (5,048)
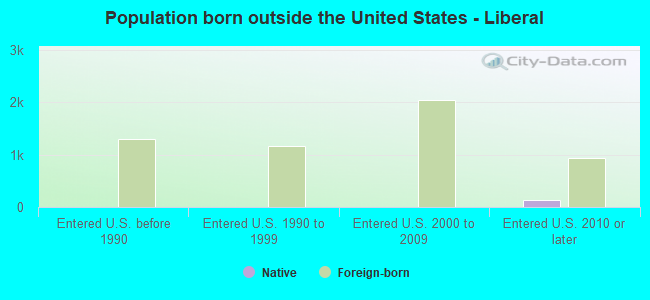
Foreign-born residents in Liberal 5,694 residents are foreign born (26.5% Latin America ).
This city:
29.8%Kansas:
7.1%
Marital status for residents in Liberal Marital status - White (Caucasian) population 15 years and over
Males 39.0% Never married44.4% Now married2.0% Separated4.1% Widowed10.5% DivorcedFemales 26.8% Never married40.0% Now married4.8% Separated13.4% Widowed14.9% DivorcedWomen who gave birth in the past 12 months Now married:
39.9% (75)Unmarried:
60.1% (113)
Women who did not give birth in the past 12 months Now married:
46.1% (810)Unmarried:
53.9% (947)
Marital status - Black or African American population 15 years and over
Males 91.1% Never married8.9% Now married0.0% Separated0.0% Widowed0.0% DivorcedFemales 77.4% Never married5.8% Now married7.1% Separated2.6% Widowed7.1% DivorcedWomen who gave birth in the past 12 months Now married:
0.0% (0)Unmarried:
100.0% (18)
Women who did not give birth in the past 12 months Now married:
0.0% (0)Unmarried:
100.0% (104)
Marital status - American Indian / Alaska Native population 15 years and over
Males 44.6% Never married48.2% Now married7.1% Separated0.0% Widowed0.0% DivorcedFemales 29.8% Never married70.2% Now married0.0% Separated0.0% Widowed0.0% DivorcedWomen who gave birth in the past 12 months Now married:
100.0% (25)Unmarried:
0.0% (0)
Women who did not give birth in the past 12 months Now married:
64.7% (87)Unmarried:
35.3% (48)
Marital status - Asian population 15 years and over
Males 34.0% Never married49.3% Now married0.0% Separated0.0% Widowed16.7% DivorcedFemales 41.5% Never married43.8% Now married0.0% Separated8.5% Widowed6.2% DivorcedWomen who did not give birth in the past 12 months Now married:
35.2% (58)Unmarried:
64.8% (107)
Marital status - Other race population 15 years and over
Males 30.9% Never married62.4% Now married0.0% Separated0.0% Widowed6.7% DivorcedFemales 31.2% Never married37.5% Now married6.7% Separated12.2% Widowed12.5% DivorcedWomen who gave birth in the past 12 months Now married:
55.4% (64)Unmarried:
44.6% (52)
Women who did not give birth in the past 12 months Now married:
52.4% (776)Unmarried:
47.6% (704)
Marital status - Two or more races population 15 years and over
Males 52.2% Never married35.5% Now married0.4% Separated5.3% Widowed6.5% DivorcedFemales 35.4% Never married48.3% Now married4.6% Separated1.4% Widowed10.3% DivorcedWomen who gave birth in the past 12 months Now married:
34.6% (24)Unmarried:
65.4% (45)
Women who did not give birth in the past 12 months Now married:
41.6% (357)Unmarried:
58.4% (501)
Marital status - White alone, not Hispanic / Latino population 15 years and over
Males 34.6% Never married43.1% Now married0.9% Separated7.1% Widowed14.3% DivorcedFemales 19.3% Never married39.1% Now married5.5% Separated17.8% Widowed18.3% DivorcedWomen who gave birth in the past 12 months Now married:
87.7% (49)Unmarried:
12.3% (7)
Women who did not give birth in the past 12 months Now married:
45.8% (399)Unmarried:
54.2% (472)
Marital status - Hispanic or Latino population 15 years and over
Males 42.5% Never married50.2% Now married1.3% Separated1.7% Widowed4.3% DivorcedFemales 35.0% Never married42.4% Now married5.1% Separated7.4% Widowed10.1% DivorcedWomen who gave birth in the past 12 months Now married:
39.1% (126)Unmarried:
60.9% (197)
Women who did not give birth in the past 12 months Now married:
48.3% (1,475)Unmarried:
51.7% (1,577)
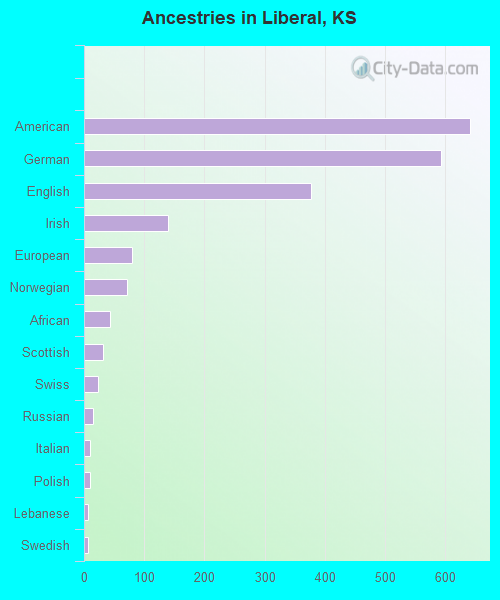
Ancestries in Liberal
641 4.9% American594 4.5% German378 2.9% English140 1.1% Irish79 0.6% European71 0.5% Norwegian43 0.3% African31 0.2% Scottish23 0.2% Swiss15 0.1% Russian10 0.08% Italian10 0.08% Polish6 0.05% Lebanese6 0.05% Swedish5 0.04% Danish3 0.02% Brazilian
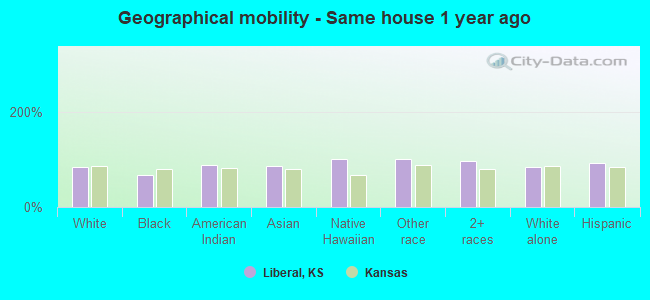
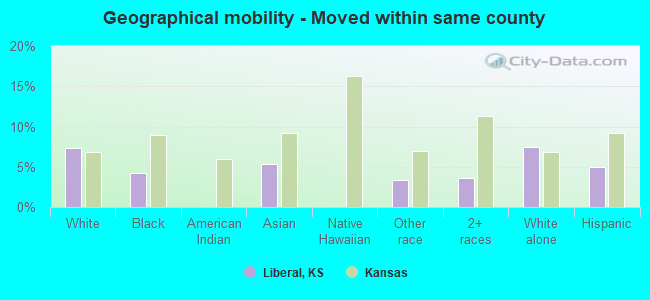
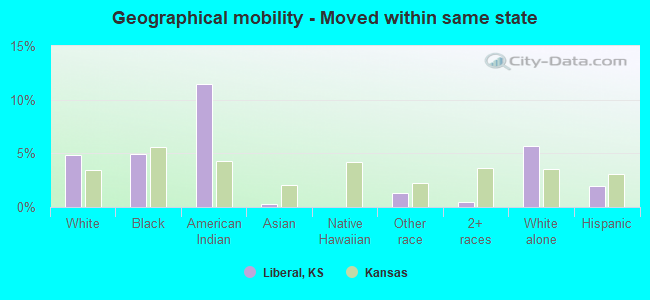
Geographical mobility in Liberal Same house 1 year ago 6,745 84.2% White (Caucasian)407 66.6% Black or African American224 88.0% American Indian / Alaska Native420 84.9% Asian45 100.0% Native Hawaiian / Pacific Islander6,479 100.0% Other race5,083 96.0% Two or more races3,928 83.9% White alone, not Hispanic / Latino11,812 92.7% Hispanic or LatinoMoved within same county 583 7.3% White / Caucasian26 4.2% Black or African American26 5.3% Asian212 3.3% Other race193 3.7% Two or more races351 7.5% White alone, not Hispanic / Latino631 5.0% Hispanic or LatinoMoved within same state 387 4.8% White / Caucasian30 4.9% Black or African American29 11.4% American Indian / Alaska Native1 0.2% Asian83 1.3% Other race24 0.4% Two or more races268 5.7% White alone, not Hispanic / Latino249 2.0% Hispanic or LatinoMoved from different state 282 3.5% White / Caucasian137 22.4% Black or African American48 9.7% Asian0 0.0% Other race21 0.4% Two or more races133 2.8% White alone, not Hispanic / Latino141 1.1% Hispanic or LatinoMoved from abroad 14 0.2% White4 0.1% White alone, not Hispanic / Latino17 0.1% Hispanic or Latino
Children Nativity (place of birth) in Liberal
Children under 6 years - Living with two parents Both parents native 477 100.0% NativeBoth parents foreign-born 387 100.0% NativeOne native, one foreign-born parent 345 100.0% NativeChildren under 6 years - Living with one parent Native parent 385 100.0% NativeForeign-born parent 251 100.0% NativeChildren 6 to 17 years - Living with two parents Both parents native 601 100.0% NativeBoth parents foreign-born 1,423 99.1% Native13 0.9% Foreign-bornOne native, one foreign-born parent 577 100.0% NativeChildren 6 to 17 years - Living with one parent Native parent 677 100.0% NativeForeign-born parent 546 50.8% Native528 49.2% Foreign-born
Grandparents responsible for own grandchildren in Liberal
Grandparents (30 to 59 years) White / Caucasian 13 100.0% Responsible for grandchildrenBlack or African American 6 100.0% Not responsible for grandchildrenAsian 11 100.0% Not responsible for grandchildrenOther race 25 24.7% Responsible for grandchildren77 75.3% Not responsible for grandchildrenTwo or more races 49 100.0% Not responsible for grandchildrenWhite alone, not Hispanic / Latino 14 100.0% Responsible for grandchildrenHispanic or Latino 15 15.5% Responsible for grandchildren84 84.5% Not responsible for grandchildrenGrandparents (60 years and over) White / Caucasian 24 100.0% Not responsible for grandchildrenAsian 27 100.0% Not responsible for grandchildrenOther race 86 75.7% Responsible for grandchildren27 24.3% Not responsible for grandchildrenTwo or more races 49 43.6% Responsible for grandchildren64 56.4% Not responsible for grandchildrenWhite alone, not Hispanic / Latino 27 100.0% Not responsible for grandchildrenHispanic or Latino 97 63.0% Responsible for grandchildren57 37.0% Not responsible for grandchildren