Races in Midland, Texas (TX) Detailed Stats
Data:
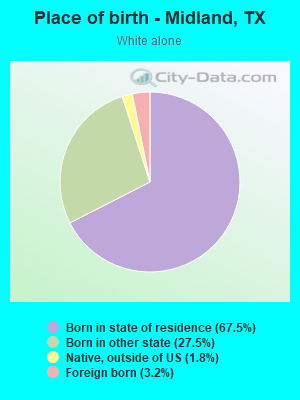
Races - White alone (%)
Races - White alone (% change since 2000)
Races - Black alone (%)
Races - Black alone (% change since 2000)
Races - American Indian alone (%)
Races - American Indian alone (% change since 2000)
Races - Asian alone (%)
Races - Asian alone (% change since 2000)
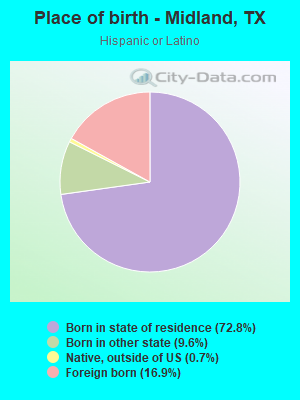
Races - Hispanic (%)
Races - Hispanic (% change since 2000)
Races - Native Hawaiian and Other Pacific Islander alone (%)
Races - Native Hawaiian and Other Pacific Islander alone (% change since 2000)
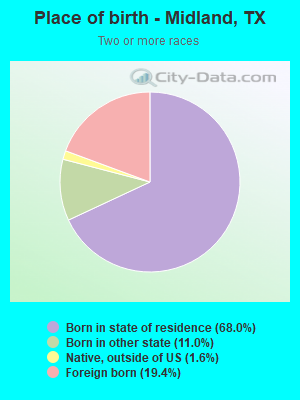
Races - Two or more races(%)
Races - Two or more races(% change since 2000)
Races - Other race alone (%)
Races - Other race alone (% change since 2000)
Racial diversity
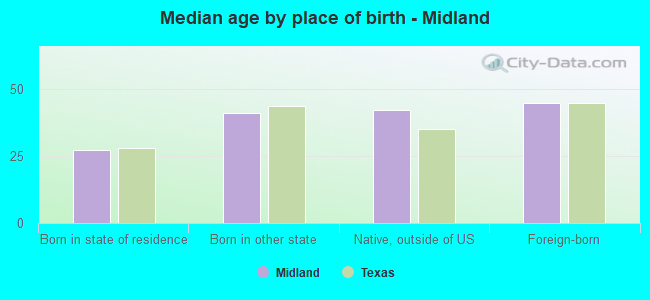
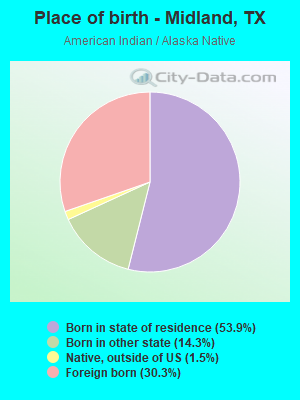
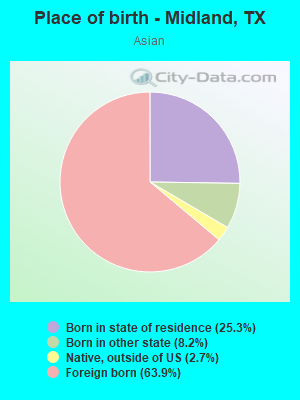
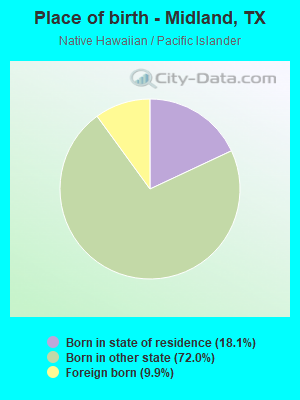
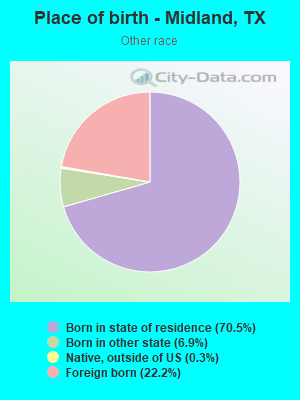
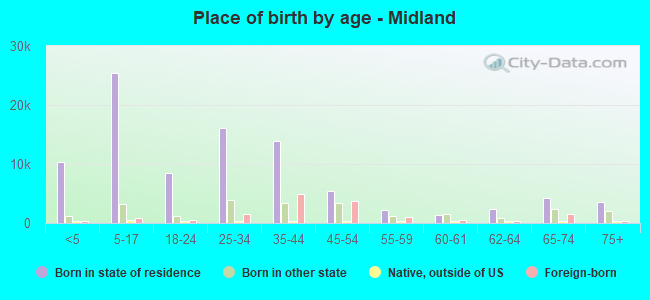
Place of birth - Born in state of residence (%)
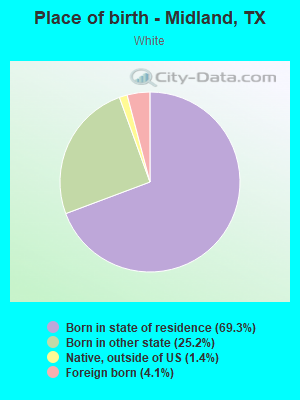
Place of birth - Born in state of residence (%) - White
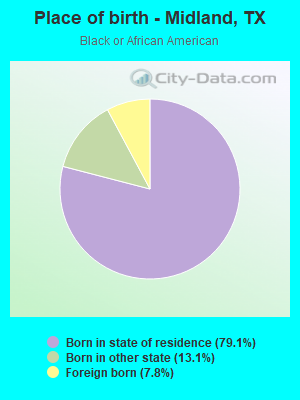
Place of birth - Born in state of residence (%) - Black or African American
Place of birth - Born in state of residence (%) - Asian
Place of birth - Born in state of residence (%) - Hispanic or Latino
Place of birth - Born in state of residence (%) - American Indian and Alaska Native
Place of birth - Born in state of residence (%) - Multirace
Place of birth - Born in state of residence (%) - Other Race
Place of birth - Born in other state (%)
Place of birth - Born in other state (%) - White
Place of birth - Born in other state (%) - Black or African American
Place of birth - Born in other state (%) - Asian
Place of birth - Born in other state (%) - Hispanic or Latino
Place of birth - Born in other state (%) - American Indian and Alaska Native
Place of birth - Born in other state (%) - Multirace
Place of birth - Born in other state (%) - Other Race
Place of birth - Native, outside of US (%)
Place of birth - Native, outside of US (%) - White
Place of birth - Native, outside of US (%) - Black or African American
Place of birth - Native, outside of US (%) - Asian
Place of birth - Native, outside of US (%) - Hispanic or Latino
Place of birth - Native, outside of US (%) - American Indian and Alaska Native
Place of birth - Native, outside of US (%) - Multirace
Place of birth - Native, outside of US (%) - Other Race
Place of birth - Foreign born (%)
Place of birth - Foreign born (%) - White
Place of birth - Foreign born (%) - Black or African American
Place of birth - Foreign born (%) - Asian
Place of birth - Foreign born (%) - Hispanic or Latino
Place of birth - Foreign born (%) - American Indian and Alaska Native
Place of birth - Foreign born (%) - Multirace
Place of birth - Foreign born (%) - Other Race
Residents speaking English at home (%)
Residents speaking English at home - Born in the United States (%)
Residents speaking English at home - Native, born elsewhere (%)
Residents speaking English at home - Foreign born (%)
Residents speaking Spanish at home (%)
Residents speaking Spanish at home - Born in the United States (%)
Residents speaking Spanish at home - Native, born elsewhere (%)
Residents speaking Spanish at home - Foreign born (%)
Residents speaking other language at home (%)
Residents speaking other language at home - Born in the United States (%)
Residents speaking other language at home - Native, born elsewhere (%)
Residents speaking other language at home - Foreign born (%)
Marital status - Never married (%)
Marital status - Now married (%)
Marital status - Separated (%)
Marital status - Widowed (%)
Marital status - Divorced (%)
Ancestries Reported - Arab (%)
Ancestries Reported - Czech (%)
Ancestries Reported - Danish (%)
Ancestries Reported - Dutch (%)
Ancestries Reported - English (%)
Ancestries Reported - French (%)
Ancestries Reported - French Canadian (%)
Ancestries Reported - German (%)
Ancestries Reported - Greek (%)
Ancestries Reported - Hungarian (%)
Ancestries Reported - Irish (%)
Ancestries Reported - Italian (%)
Ancestries Reported - Lithuanian (%)
Ancestries Reported - Norwegian (%)
Ancestries Reported - Polish (%)
Ancestries Reported - Portuguese (%)
Ancestries Reported - Russian (%)
Ancestries Reported - Scotch-Irish (%)
Ancestries Reported - Scottish (%)
Ancestries Reported - Slovak (%)
Ancestries Reported - Subsaharan African (%)
Ancestries Reported - Swedish (%)
Ancestries Reported - Swiss (%)
Ancestries Reported - Ukrainian (%)
Ancestries Reported - United States (%)
Ancestries Reported - Welsh (%)
Ancestries Reported - West Indian (%)
Ancestries Reported - Other (%)
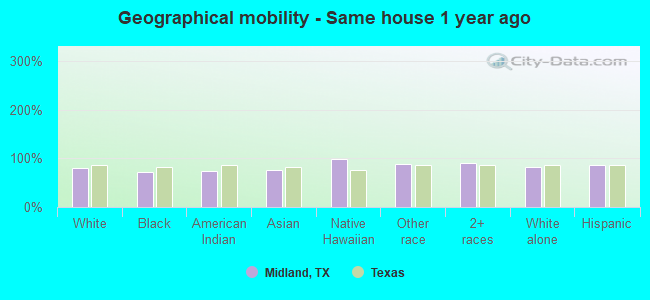
Geographical mobility - Same house 1 year ago (%)
Geographical mobility - Same house 1 year ago (%) - White
Geographical mobility - Same house 1 year ago (%) - Black or African American
Geographical mobility - Same house 1 year ago (%) - Asian
Geographical mobility - Same house 1 year ago (%) - Hispanic or Latino
Geographical mobility - Same house 1 year ago (%) - American Indian and Alaska Native
Geographical mobility - Same house 1 year ago (%) - Multirace
Geographical mobility - Same house 1 year ago (%) - Other Race
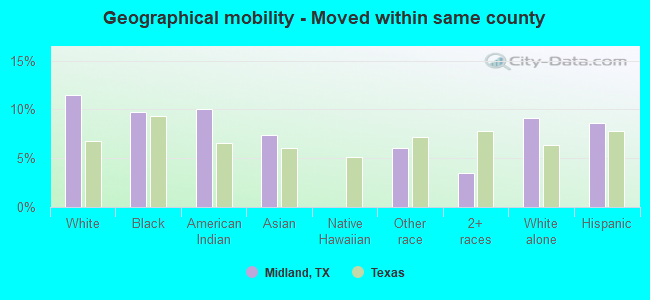
Geographical mobility - Moved within same county (%)
Geographical mobility - Moved within same county (%) - White
Geographical mobility - Moved within same county (%) - Black or African American
Geographical mobility - Moved within same county (%) - Asian
Geographical mobility - Moved within same county (%) - Hispanic or Latino
Geographical mobility - Moved within same county (%) - American Indian and Alaska Native
Geographical mobility - Moved within same county (%) - Multirace
Geographical mobility - Moved within same county (%) - Other Race
Geographical mobility - Moved from different county within same state (%)
Geographical mobility - Moved from different county within same state (%) - White
Geographical mobility - Moved from different county within same state (%) - Black or African American
Geographical mobility - Moved from different county within same state (%) - Asian
Geographical mobility - Moved from different county within same state (%) - Hispanic or Latino
Geographical mobility - Moved from different county within same state (%) - American Indian and Alaska Native
Geographical mobility - Moved from different county within same state (%) - Multirace
Geographical mobility - Moved from different county within same state (%) - Other Race
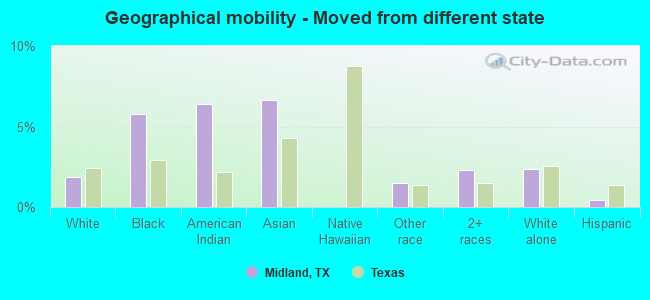
Geographical mobility - Moved from different state (%)
Geographical mobility - Moved from different state (%) - White
Geographical mobility - Moved from different state (%) - Black or African American
Geographical mobility - Moved from different state (%) - Asian
Geographical mobility - Moved from different state (%) - Hispanic or Latino
Geographical mobility - Moved from different state (%) - American Indian and Alaska Native
Geographical mobility - Moved from different state (%) - Multirace
Geographical mobility - Moved from different state (%) - Other Race
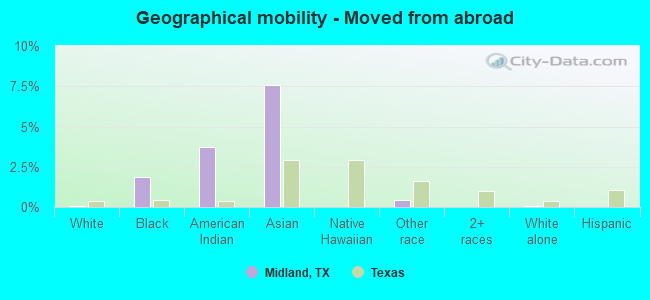
Geographical mobility - Moved from abroad (%)
Geographical mobility - Moved from abroad (%) - White
Geographical mobility - Moved from abroad (%) - Black or African American
Geographical mobility - Moved from abroad (%) - Asian
Geographical mobility - Moved from abroad (%) - Hispanic or Latino
Geographical mobility - Moved from abroad (%) - American Indian and Alaska Native
Geographical mobility - Moved from abroad (%) - Multirace
Geographical mobility - Moved from abroad (%) - Other Race
Place of birth for the foreign-born population - Ireland (%)
Place of birth for the foreign-born population - Denmark (%)
Place of birth for the foreign-born population - Norway (%)
Place of birth for the foreign-born population - Sweden (%)
Place of birth for the foreign-born population - United Kingdom (%)
Place of birth for the foreign-born population - England (%)
Place of birth for the foreign-born population - Scotland (%)
Place of birth for the foreign-born population - Other Northern Europe (%)
Place of birth for the foreign-born population - Austria (%)
Place of birth for the foreign-born population - Belgium (%)
Place of birth for the foreign-born population - France (%)
Place of birth for the foreign-born population - Germany (%)
Place of birth for the foreign-born population - Netherlands (%)
Place of birth for the foreign-born population - Switzerland (%)
Place of birth for the foreign-born population - Other Western Europe (%)
Place of birth for the foreign-born population - Greece (%)
Place of birth for the foreign-born population - Italy (%)
Place of birth for the foreign-born population - Portugal (%)
Place of birth for the foreign-born population - Spain (%)
Place of birth for the foreign-born population - Other Southern Europe (%)
Place of birth for the foreign-born population - Albania (%)
Place of birth for the foreign-born population - Belarus (%)
Place of birth for the foreign-born population - Bosnia and Herzegovina (%)
Place of birth for the foreign-born population - Bulgaria (%)
Place of birth for the foreign-born population - Croatia (%)
Place of birth for the foreign-born population - Czechoslovakia (%)
Place of birth for the foreign-born population - Hungary (%)
Place of birth for the foreign-born population - Latvia (%)
Place of birth for the foreign-born population - Lithuania (%)
Place of birth for the foreign-born population - North Macedonia (Macedonia) (%)
Place of birth for the foreign-born population - Moldova (%)
Place of birth for the foreign-born population - Poland (%)
Place of birth for the foreign-born population - Romania (%)
Place of birth for the foreign-born population - Russia (%)
Place of birth for the foreign-born population - Serbia (%)
Place of birth for the foreign-born population - Ukraine (%)
Place of birth for the foreign-born population - Other Eastern Europe (%)
Place of birth for the foreign-born population - China (%)
Place of birth for the foreign-born population - Hong Kong (%)
Place of birth for the foreign-born population - Taiwan (%)
Place of birth for the foreign-born population - Japan (%)
Place of birth for the foreign-born population - Korea (%)
Place of birth for the foreign-born population - Other Eastern Asia (%)
Place of birth for the foreign-born population - Afghanistan (%)
Place of birth for the foreign-born population - Bangladesh (%)
Place of birth for the foreign-born population - India (%)
Place of birth for the foreign-born population - Iran (%)
Place of birth for the foreign-born population - Kazakhstan (%)
Place of birth for the foreign-born population - Nepal (%)
Place of birth for the foreign-born population - Pakistan (%)
Place of birth for the foreign-born population - Sri Lanka (%)
Place of birth for the foreign-born population - Uzbekistan (%)
Place of birth for the foreign-born population - Other South Central Asia (%)
Place of birth for the foreign-born population - Burma (%)
Place of birth for the foreign-born population - Cambodia (%)
Place of birth for the foreign-born population - Indonesia (%)
Place of birth for the foreign-born population - Laos (%)
Place of birth for the foreign-born population - Malaysia (%)
Place of birth for the foreign-born population - Philippines (%)
Place of birth for the foreign-born population - Singapore (%)
Place of birth for the foreign-born population - Thailand (%)
Place of birth for the foreign-born population - Vietnam (%)
Place of birth for the foreign-born population - Other South Eastern Asia (%)
Place of birth for the foreign-born population - Armenia (%)
Place of birth for the foreign-born population - Iraq (%)
Place of birth for the foreign-born population - Israel (%)
Place of birth for the foreign-born population - Jordan (%)
Place of birth for the foreign-born population - Kuwait (%)
Place of birth for the foreign-born population - Lebanon (%)
Place of birth for the foreign-born population - Saudi Arabia (%)
Place of birth for the foreign-born population - Syria (%)
Place of birth for the foreign-born population - Turkey (%)
Place of birth for the foreign-born population - Yemen (%)
Place of birth for the foreign-born population - Other Western Asia (%)
Place of birth for the foreign-born population - Eritrea (%)
Place of birth for the foreign-born population - Ethiopia (%)
Place of birth for the foreign-born population - Kenya (%)
Place of birth for the foreign-born population - Somalia (%)
Place of birth for the foreign-born population - Uganda (%)
Place of birth for the foreign-born population - Zimbabwe (%)
Place of birth for the foreign-born population - Other Eastern Africa (%)
Place of birth for the foreign-born population - Cameroon (%)
Place of birth for the foreign-born population - Congo (%)
Place of birth for the foreign-born population - Democratic Republic of Congo (Zaire) (%)
Place of birth for the foreign-born population - Other Middle Africa (%)
Place of birth for the foreign-born population - Egypt (%)
Place of birth for the foreign-born population - Morocco (%)
Place of birth for the foreign-born population - Sudan (%)
Place of birth for the foreign-born population - Other Northern Africa (%)
Place of birth for the foreign-born population - South Africa (%)
Place of birth for the foreign-born population - Other Southern Africa (%)
Place of birth for the foreign-born population - Cabo Verde (%)
Place of birth for the foreign-born population - Ghana (%)
Place of birth for the foreign-born population - Liberia (%)
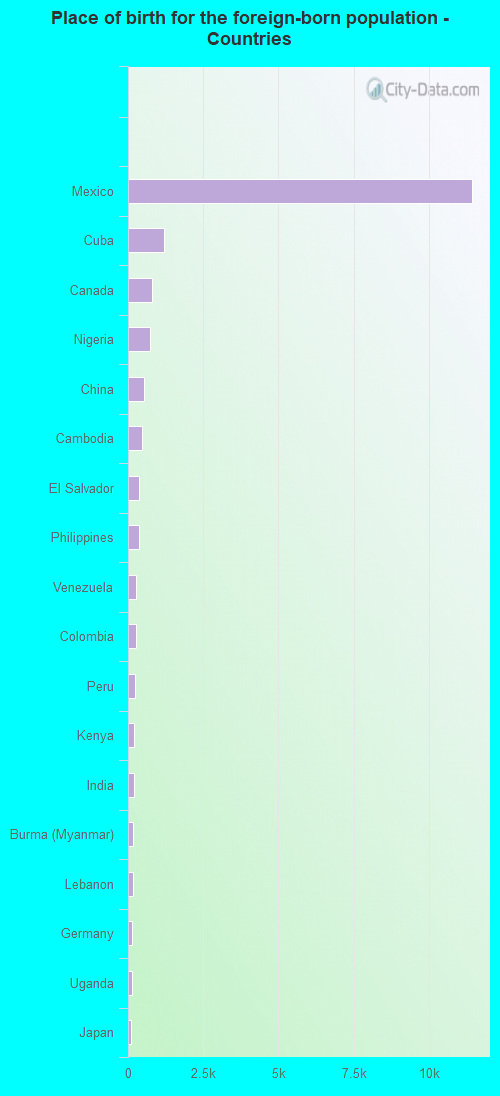
Place of birth for the foreign-born population - Nigeria (%)
Place of birth for the foreign-born population - Senegal (%)
Place of birth for the foreign-born population - Sierra Leone (%)
Place of birth for the foreign-born population - Other Western Africa (%)
Place of birth for the foreign-born population - Australia (%)
Place of birth for the foreign-born population - New Zealand (%)
Place of birth for the foreign-born population - Fiji (%)
Place of birth for the foreign-born population - Micronesia (%)
Place of birth for the foreign-born population - Bahamas (%)
Place of birth for the foreign-born population - Barbados (%)
Place of birth for the foreign-born population - Cuba (%)
Place of birth for the foreign-born population - Dominica (%)
Place of birth for the foreign-born population - Dominican Republic (%)
Place of birth for the foreign-born population - Grenada (%)
Place of birth for the foreign-born population - Haiti (%)
Place of birth for the foreign-born population - Jamaica (%)
Place of birth for the foreign-born population - St. Vincent and the Grenadines (%)
Place of birth for the foreign-born population - Trinidad and Tobago (%)
Place of birth for the foreign-born population - West Indies (%)
Place of birth for the foreign-born population - Other Caribbean (%)
Place of birth for the foreign-born population - Belize (%)
Place of birth for the foreign-born population - Costa Rica (%)
Place of birth for the foreign-born population - El Salvador (%)
Place of birth for the foreign-born population - Guatemala (%)
Place of birth for the foreign-born population - Honduras (%)
Place of birth for the foreign-born population - Mexico (%)
Place of birth for the foreign-born population - Nicaragua (%)
Place of birth for the foreign-born population - Panama (%)
Place of birth for the foreign-born population - Other Central America (%)
Place of birth for the foreign-born population - Argentina (%)
Place of birth for the foreign-born population - Bolivia (%)
Place of birth for the foreign-born population - Brazil (%)
Place of birth for the foreign-born population - Chile (%)
Place of birth for the foreign-born population - Colombia (%)
Place of birth for the foreign-born population - Ecuador (%)
Place of birth for the foreign-born population - Guyana (%)
Place of birth for the foreign-born population - Peru (%)
Place of birth for the foreign-born population - Uruguay (%)
Place of birth for the foreign-born population - Venezuela (%)
Place of birth for the foreign-born population - Other South America (%)
Place of birth for the foreign-born population - Canada (%)
Place of birth for the foreign-born population - Other Northern America (%)
Place of birth for the foreign-born population - Other (%)
Latest news about races in Midland, TX collected exclusively by city-data.com from local newspapers, TV, and radio stations
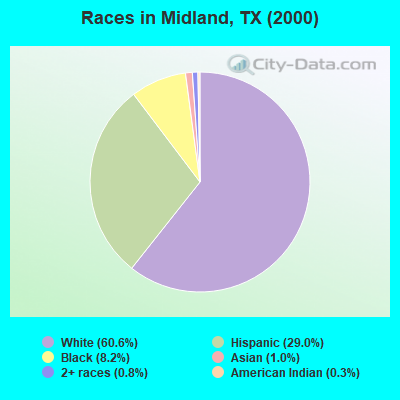
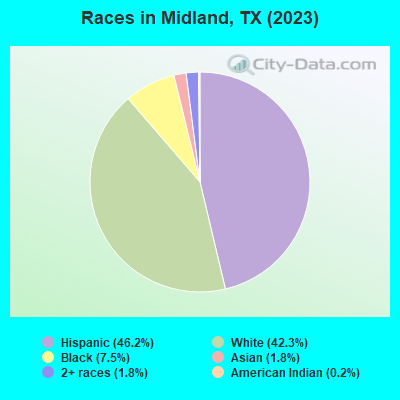
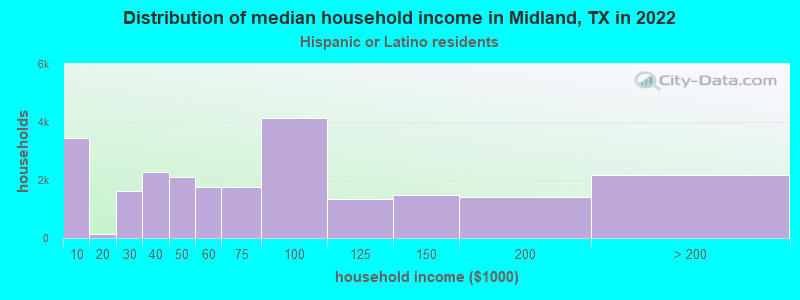
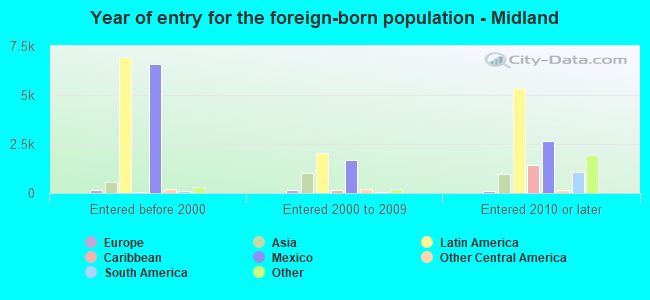
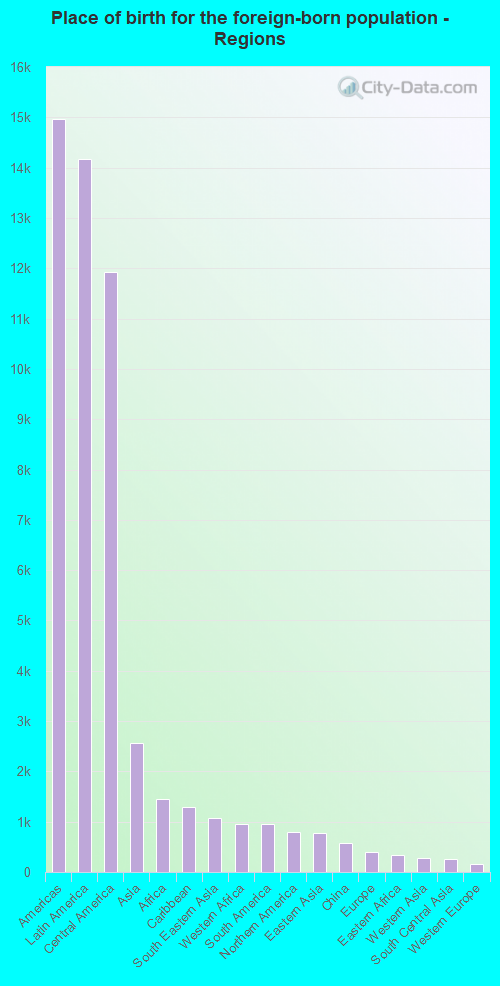
According to 2022 data, the most numerous races in Midland, TX are Hispanic (61,613 residents), White alone (56,997 residents), and Black alone (10,777 residents). 71.5% of Midland residents speak English at home. 14.4% of Midland, TX residents are foreign-born (10.3% born in Latin America, 1.9% born in Asia), which is 17.8% less than the foreign-born rate of 17.0% across the entire state of Texas.
Race distribution in Midland
2000 2022
10,933,313 52.4% White alone 6,669,666 32.0% Hispanic 2,364,255 11.3% Black alone 554,445 2.7% Asian alone 230,567 1.1% Two or more races 68,859 0.3% American Indian alone 19,958 0.10% Other race alone 10,757 0.05% Native Hawaiian and Other
12,070,642 40.2% Hispanic 11,683,430 38.9% White alone 3,508,706 11.7% Black alone 1,608,173 5.4% Asian alone 956,560 3.2% Two or more races 125,763 0.4% Other race alone 47,023 0.2% American Indian alone 29,275 0.10% Native Hawaiian and Other
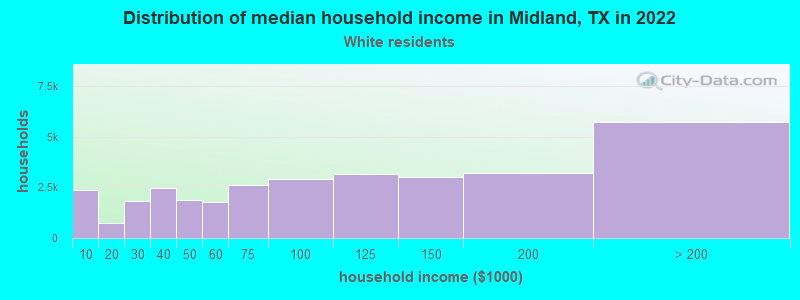
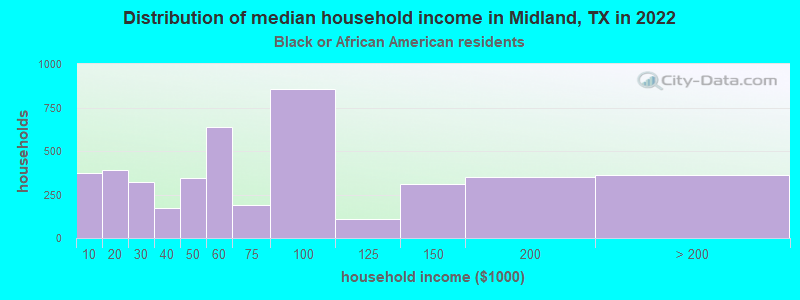
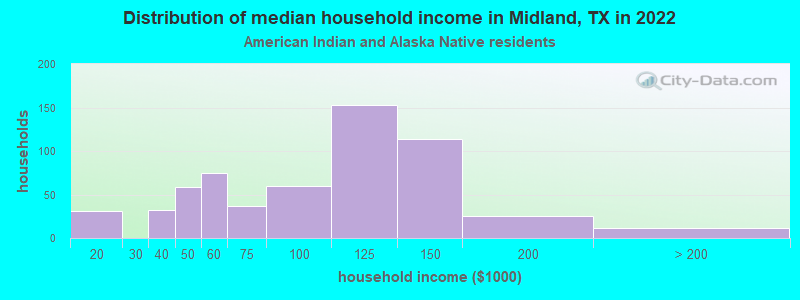
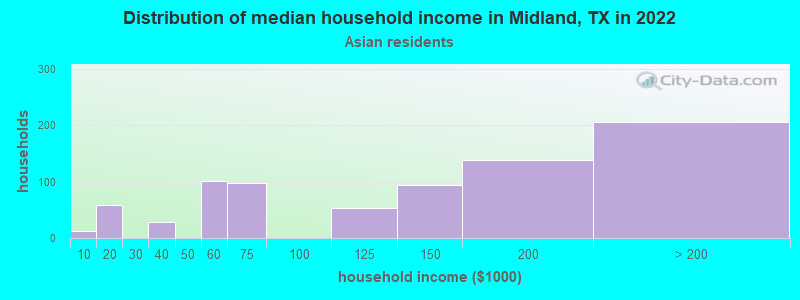
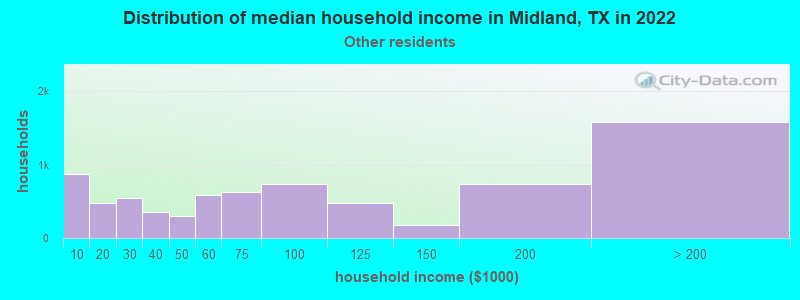
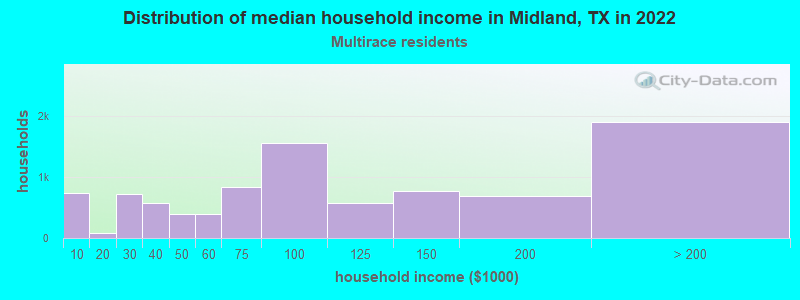
Income and house value in Midland Median household income in 2022 $103,916 White non-Hispanic householders$54,287 Black householders$44,345 American Indian and Alaska Native householders$131,947 Asian householders$46,510 Some other race householders$86,902 Two or more races householders$66,176 Hispanic or Latino race householdersMedian 2022 house value $335,779 White Non-Hispanic householders$144,194 Black or African American householders$295,275 American Indian or Alaska Native householders $567,058 Asian householders$263,277 Native Hawaiian and other Pacific Islander householders$144,600 Some other race householders$192,800 Two or more races householders$150,675 Hispanic or Latino householders
Median age by race in Midland
33.6 Median age for White residents33.1 33.9 33.5 Median age for Black or African American residents36.1 33.4 45.7 Median age for American Indian / Alaska Native residents65.1 45.3 36.7 Median age for Asian residents37.5 35.9 -666,666,666.0 Median age for Native Hawaiian / Pacific Islander residents-666,666,666.0 -666,666,666.0 27.7 Median age for Other race residents33.1 27.3 30.8 Median age for Two or more races residents30.3 33.1 36.2 Median age for White alone residents35.7 36.8 28.0 Median age for Hispanic or Latino residents28.7 27.7
Owner/renter occupied households by race in Midland
House owners and renters - White residents 20,610 65.4% Owner occupied10,926 34.6% Renter occupiedHouse owners and renters - Black or African American residents 2,235 46.1% Owner occupied2,612 53.9% Renter occupiedHouse owners and renters - American Indian / Alaska Native residents 280 48.1% Owner occupied302 51.9% Renter occupiedHouse owners and renters - Asian residents 517 73.7% Owner occupied185 26.3% Renter occupiedHouse owners and renters - Native Hawaiian / Pacific Islander residents 40 100.0% Renter occupiedHouse owners and renters - Other race residents 3,357 40.7% Owner occupied4,897 59.3% Renter occupiedHouse owners and renters - Two or more races residents 7,025 76.0% Owner occupied2,221 24.0% Renter occupiedHouse owners and renters - White alone residents 17,392 67.4% Owner occupied8,415 32.6% Renter occupiedHouse owners and renters - Hispanic or Latino residents 14,102 59.6% Owner occupied9,576 40.4% Renter occupied
Language usage in Midland
English speakers - Total 71.5% of residents of Midland speak English at home.
25.5% of residents speak Spanish at home 20,185 64.3% Speak English very well11,197 35.7% Speak English less than very well2.9% of residents speak other language at home 2,483 69.2% Speak English very well1,106 30.8% Speak English less than very well
English speakers - Born in the United States 82.5% of residents of Midland speak English at home.
15.2% of residents speak Spanish at home 2,544 71.7% Speak English very well1,003 28.3% Speak English less than very well2.3% of residents speak other language at home 534 100.0% Speak English very well
English speakers - Native, born elsewhere 88.2% of residents of Midland speak English at home.
6.6% of residents speak Spanish at home 99 100.0% Speak English very well5.2% of residents speak other language at home 78 100.0% Speak English very well
English speakers - Foreign-born 15.3% of residents of Midland speak English at home.
66.3% of residents speak Spanish at home 3,920 39.4% Speak English very well6,027 60.6% Speak English less than very well18.5% of residents speak other language at home 1,871 67.5% Speak English very well902 32.5% Speak English less than very well
White (Caucasian) - Speak only English Native:
88.9% (56,754)Foreign-born:
56.1% (1,666)
White (Caucasian) - Speak another language Native:
11.1% (7,122)Foreign-born:
43.9% (1,304)
Black or African American - Speak only English Native:
95.6% (7,616)Foreign-born:
38.5% (531)
Black or African American - Speak another language Native:
4.4% (350)Foreign-born:
60.5% (836)
American Indian / Alaska Native - Speak another language Native:
46.3% (397)Foreign-born:
98.9% (389)
Asian - Speak only English Native:
22.7% (173)Foreign-born:
8.0% (158)
Asian - Speak another language Native:
26.8% (204)Foreign-born:
92.8% (1,840)
Native Hawaiian / Pacific Islander - Speak another language Native:
80.8% (43)Foreign-born:
100.0% (7)
Other race - Speak only English Native:
51.1% (7,180)Foreign-born:
6.8% (308)
Other race - Speak another language Native:
48.9% (6,865)Foreign-born:
93.2% (4,235)
Two or more races - Speak only English Native:
58.4% (10,669)Foreign-born:
1.3% (62)
Two or more races - Speak another language Native:
41.6% (7,593)Foreign-born:
98.7% (4,853)
White alone - Speak only English Native:
98.5% (48,147)Foreign-born:
92.5% (1,545)
White alone - Speak another language Native:
1.5% (726)Foreign-born:
38.3% (640)
Hispanic or Latino - Speak only English Native:
53.7% (24,255)Foreign-born:
4.7% (491)
Hispanic or Latino - Speak another language Native:
46.3% (20,935)Foreign-born:
95.3% (9,947)
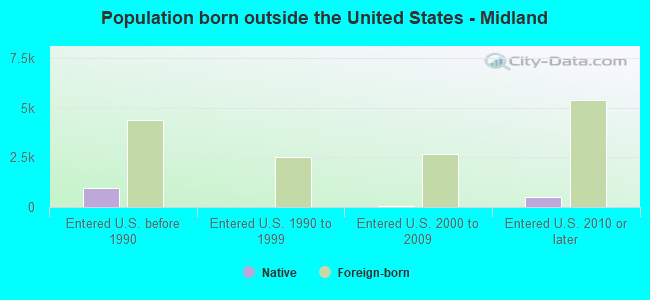
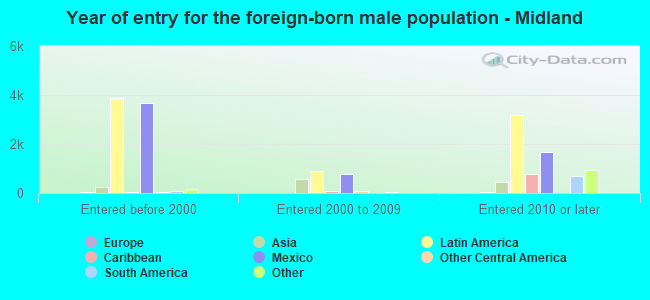
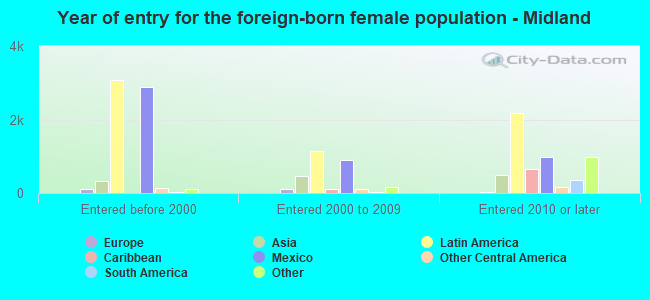
Foreign-born residents in Midland 19,411 residents are foreign born (10.3% Latin America , 1.9% Asia ).
This city:
14.4%Texas:
17.1%
Marital status for residents in Midland Marital status - White (Caucasian) population 15 years and over
Males 30.3% Never married58.7% Now married0.3% Separated2.9% Widowed7.7% DivorcedFemales 24.1% Never married53.7% Now married0.7% Separated9.4% Widowed12.0% DivorcedWomen who gave birth in the past 12 months Now married:
100.0% (845)Unmarried:
0.0% (0)
Women who did not give birth in the past 12 months Now married:
54.5% (8,768)Unmarried:
45.5% (7,306)
Marital status - Black or African American population 15 years and over
Males 44.1% Never married48.9% Now married3.7% Separated0.0% Widowed3.3% DivorcedFemales 28.6% Never married46.8% Now married0.0% Separated15.1% Widowed9.5% DivorcedWomen who gave birth in the past 12 months Now married:
100.0% (139)Unmarried:
0.0% (0)
Women who did not give birth in the past 12 months Now married:
46.1% (985)Unmarried:
53.9% (1,152)
Marital status - American Indian / Alaska Native population 15 years and over
Males 54.0% Never married39.7% Now married4.1% Separated0.0% Widowed2.2% DivorcedFemales 19.2% Never married47.0% Now married13.7% Separated9.6% Widowed10.5% DivorcedWomen who did not give birth in the past 12 months Now married:
43.4% (85)Unmarried:
56.6% (110)
Marital status - Asian population 15 years and over
Males 29.1% Never married69.3% Now married0.0% Separated1.5% Widowed0.0% DivorcedFemales 14.2% Never married80.1% Now married0.0% Separated4.1% Widowed1.6% DivorcedWomen who gave birth in the past 12 months Now married:
100.0% (41)Unmarried:
0.0% (0)
Women who did not give birth in the past 12 months Now married:
79.8% (557)Unmarried:
20.2% (141)
Marital status - Other race population 15 years and over
Males 40.0% Never married44.3% Now married3.4% Separated0.9% Widowed11.4% DivorcedFemales 35.4% Never married38.0% Now married3.4% Separated9.5% Widowed13.7% DivorcedWomen who gave birth in the past 12 months Now married:
75.9% (463)Unmarried:
24.1% (147)
Women who did not give birth in the past 12 months Now married:
33.5% (2,015)Unmarried:
66.5% (3,996)
Marital status - Two or more races population 15 years and over
Males 26.9% Never married64.3% Now married1.3% Separated0.7% Widowed6.8% DivorcedFemales 29.7% Never married48.9% Now married4.9% Separated1.8% Widowed14.8% DivorcedWomen who gave birth in the past 12 months Now married:
100.0% (416)Unmarried:
0.0% (0)
Women who did not give birth in the past 12 months Now married:
50.1% (3,209)Unmarried:
49.9% (3,193)
Marital status - White alone, not Hispanic / Latino population 15 years and over
Males 26.1% Never married62.1% Now married0.4% Separated3.6% Widowed7.8% DivorcedFemales 21.3% Never married55.8% Now married0.9% Separated8.9% Widowed13.1% DivorcedWomen who gave birth in the past 12 months Now married:
100.0% (767)Unmarried:
0.0% (0)
Women who did not give birth in the past 12 months Now married:
57.4% (6,971)Unmarried:
42.6% (5,178)
Marital status - Hispanic or Latino population 15 years and over
Males 30.3% Never married57.7% Now married6.6% Separated0.7% Widowed4.6% DivorcedFemales 39.6% Never married43.4% Now married4.6% Separated4.0% Widowed8.4% DivorcedWomen who gave birth in the past 12 months Now married:
86.7% (957)Unmarried:
13.3% (147)
Women who did not give birth in the past 12 months Now married:
43.6% (6,854)Unmarried:
56.4% (8,866)
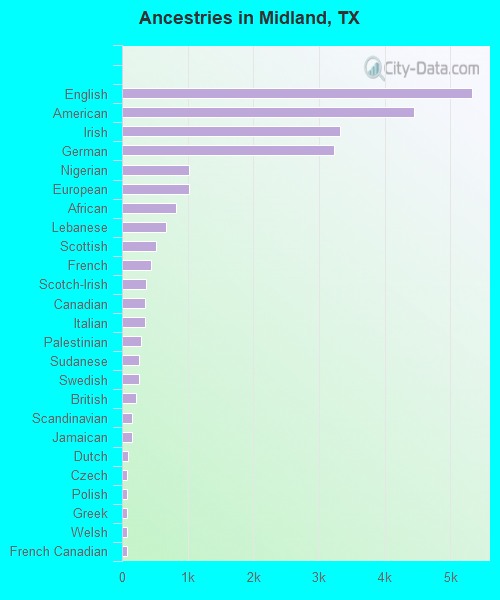
Ancestries in Midland
5,325 6.6% English4,456 5.5% American3,320 4.1% Irish3,227 4.0% German1,026 1.3% Nigerian1,014 1.3% European826 1.0% African669 0.8% Lebanese524 0.6% Scottish436 0.5% French361 0.4% Scotch-Irish357 0.4% Canadian354 0.4% Italian294 0.4% Palestinian255 0.3% Sudanese254 0.3% Swedish208 0.3% British158 0.2% Scandinavian145 0.2% Jamaican87 0.1% Dutch82 0.1% Czech80 0.10% Polish76 0.09% Greek71 0.09% Welsh69 0.09% French Canadian60 0.07% West Indian57 0.07% Guyanese57 0.07% Eastern European56 0.07% Norwegian53 0.07% Northern European47 0.06% Russian46 0.06% South African36 0.04% Czechoslovakian36 0.04% Ukrainian34 0.04% Slovak28 0.03% Australian27 0.03% Cajun26 0.03% Hungarian26 0.03% Ghanaian26 0.03% Iranian23 0.03% Albanian23 0.03% Bermudan19 0.02% Romanian15 0.02% Egyptian14 0.02% Danish10 0.01% Brazilian7 0.01% Austrian6 0.01% Croatian
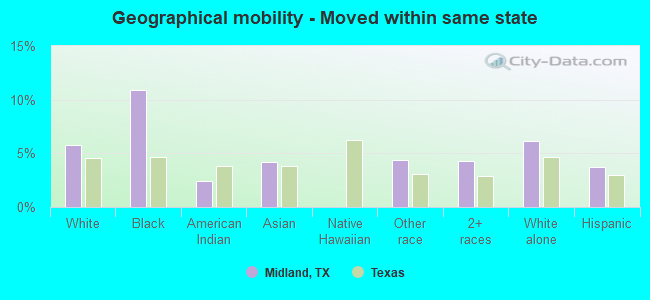
Geographical mobility in Midland Same house 1 year ago 57,692 80.8% White (Caucasian)7,668 72.1% Black or African American948 73.7% American Indian / Alaska Native2,042 75.1% Asian59 98.2% Native Hawaiian / Pacific Islander19,670 89.1% Other race22,741 90.0% Two or more races46,271 82.3% White alone, not Hispanic / Latino53,173 87.2% Hispanic or LatinoMoved within same county 8,182 11.5% White / Caucasian1,034 9.7% Black or African American130 10.1% American Indian / Alaska Native202 7.4% Asian1,346 6.1% Other race879 3.5% Two or more races5,105 9.1% White alone, not Hispanic / Latino5,258 8.6% Hispanic or LatinoMoved within same state 4,148 5.8% White / Caucasian1,159 10.9% Black or African American31 2.4% American Indian / Alaska Native113 4.2% Asian958 4.3% Other race1,076 4.3% Two or more races3,454 6.1% White alone, not Hispanic / Latino2,301 3.8% Hispanic or LatinoMoved from different state 1,317 1.8% White / Caucasian614 5.8% Black or African American82 6.4% American Indian / Alaska Native181 6.7% Asian333 1.5% Other race577 2.3% Two or more races1,317 2.3% White alone, not Hispanic / Latino255 0.4% Hispanic or LatinoMoved from abroad 43 0.1% White199 1.9% Black or African American48 3.7% American Indian / Alaska Native206 7.6% Asian91 0.4% Other race43 0.1% White alone, not Hispanic / Latino
Children Nativity (place of birth) in Midland
Children under 6 years - Living with two parents Both parents native 6,817 100.0% NativeBoth parents foreign-born 599 100.0% NativeOne native, one foreign-born parent 628 88.6% Native81 11.4% Foreign-bornChildren under 6 years - Living with one parent Native parent 4,947 100.0% NativeForeign-born parent 496 100.0% NativeChildren 6 to 17 years - Living with two parents Both parents native 14,535 100.0% NativeBoth parents foreign-born 2,382 92.2% Native202 7.8% Foreign-bornOne native, one foreign-born parent 2,980 100.0% NativeChildren 6 to 17 years - Living with one parent Native parent 4,726 100.0% NativeForeign-born parent 1,390 60.5% Native906 39.5% Foreign-born
Grandparents responsible for own grandchildren in Midland
Grandparents (30 to 59 years) White / Caucasian 184 62.2% Responsible for grandchildren112 37.8% Not responsible for grandchildrenBlack or African American 56 68.8% Responsible for grandchildren26 31.2% Not responsible for grandchildrenAmerican Indian / Alaska Native 56 100.0% Responsible for grandchildrenAsian 16 100.0% Responsible for grandchildrenOther race 94 7.4% Responsible for grandchildren1,178 92.6% Not responsible for grandchildrenTwo or more races 69 15.5% Responsible for grandchildren373 84.5% Not responsible for grandchildrenWhite alone, not Hispanic / Latino 123 59.3% Responsible for grandchildren84 40.7% Not responsible for grandchildrenHispanic or Latino 322 21.0% Responsible for grandchildren1,211 79.0% Not responsible for grandchildrenGrandparents (60 years and over) White / Caucasian 437 50.8% Responsible for grandchildren423 49.2% Not responsible for grandchildrenBlack or African American 71 44.3% Responsible for grandchildren89 55.7% Not responsible for grandchildrenAmerican Indian / Alaska Native 14 100.0% Not responsible for grandchildrenAsian 23 56.1% Responsible for grandchildren18 43.9% Not responsible for grandchildrenOther race 369 100.0% Not responsible for grandchildrenTwo or more races 68 100.0% Not responsible for grandchildrenWhite alone, not Hispanic / Latino 334 49.2% Responsible for grandchildren345 50.8% Not responsible for grandchildrenHispanic or Latino 207 25.4% Responsible for grandchildren608 74.6% Not responsible for grandchildren