Estimated zip code population in 2022: 40,404
Zip code population in 2010: 32,854
Zip code population in 2000: 26,304
Houses and condos: 16,608
Renter-occupied apartments: 6,529
% of renters here:
40%State:
38%
March 2022 cost of living index in zip code 79707: 85.6
(less than average, U.S. average is 100)
Land area: 70.8
sq. mi.
Water area: 0.2
sq. mi.
Population density: 571 people per square mile (low).
OSM Map
General Map
Google Map
MSN Map
OSM Map
General Map
Google Map
MSN Map
OSM Map
General Map
Google Map
MSN Map
OSM Map
General Map
Google Map
MSN Map
Please wait while loading the map...
Real estate property taxes paid for housing units in 2022:
This zip code:
1.3% ($5,466)Texas:
1.5% ($4,050)
Median real estate property taxes paid for housing units with mortgages in 2022: $5,913 (1.4%)
Median real estate property taxes paid for housing units with no mortgage in 2022: $4,908 (1.1%)
Profiles of local businesses
Business Search - 14 Million verified businesses
Males: 20,730 Females: 19,674
For population 25 years and over in 79707:
High school or higher: 92.7%Bachelor's degree or higher: 42.2%Graduate or professional degree: 13.7%Unemployed: 2.8%Mean travel time to work (commute): 20.4 minutes
For population 15 years and over in 79707:
Never married: 27.1%Now married: 61.9%Separated: 1.0%Widowed: 3.6%Divorced: 6.4%
Zip code 79707 compared to state average:
Median house value above state average. Black race population percentage below state average. Foreign-born population percentage below state average. 22,187 54.9% White 12,658 31.3% Hispanic or Latino 2,480 6.1% Black 1,872 4.6% Asian 1,092 2.7% Two or more races 80 0.2% American Indian 32 0.08% Native Hawaiian and Other
Data:
Median household income ($)
Median household income (% change since 2000)
Household income diversity
Ratio of average income to average house value (%)
Ratio of average income to average rent
Median household income ($) - White
Median household income ($) - Black or African American
Median household income ($) - Asian
Median household income ($) - Hispanic or Latino
Median household income ($) - American Indian and Alaska Native
Median household income ($) - Multirace
Median household income ($) - Other Race
Median household income for houses/condos with a mortgage ($)
Median household income for apartments without a mortgage ($)
Races - White alone (%)
Races - White alone (% change since 2000)
Races - Black alone (%)
Races - Black alone (% change since 2000)
Races - American Indian alone (%)
Races - American Indian alone (% change since 2000)
Races - Asian alone (%)
Races - Asian alone (% change since 2000)
Races - Hispanic (%)
Races - Hispanic (% change since 2000)
Races - Native Hawaiian and Other Pacific Islander alone (%)
Races - Native Hawaiian and Other Pacific Islander alone (% change since 2000)
Races - Two or more races (%)
Races - Two or more races (% change since 2000)
Races - Other race alone (%)
Races - Other race alone (% change since 2000)
Racial diversity
Unemployment (%)
Unemployment (% change since 2000)
Unemployment (%) - White
Unemployment (%) - Black or African American
Unemployment (%) - Asian
Unemployment (%) - Hispanic or Latino
Unemployment (%) - American Indian and Alaska Native
Unemployment (%) - Multirace
Unemployment (%) - Other Race
Population density (people per square mile)
Population - Males (%)
Population - Females (%)
Population - Males (%) - White
Population - Males (%) - Black or African American
Population - Males (%) - Asian
Population - Males (%) - Hispanic or Latino
Population - Males (%) - American Indian and Alaska Native
Population - Males (%) - Multirace
Population - Males (%) - Other Race
Population - Females (%) - White
Population - Females (%) - Black or African American
Population - Females (%) - Asian
Population - Females (%) - Hispanic or Latino
Population - Females (%) - American Indian and Alaska Native
Population - Females (%) - Multirace
Population - Females (%) - Other Race
Coronavirus confirmed cases (May 17, 2024)
Deaths caused by coronavirus (May 17, 2024)
Coronavirus confirmed cases (per 100k population) (May 17, 2024)
Deaths caused by coronavirus (per 100k population) (May 17, 2024)
Daily increase in number of cases (May 17, 2024)
Weekly increase in number of cases (May 17, 2024)
Cases doubled (in days) (May 17, 2024)
Hospitalized patients (Apr 18, 2022)
Negative test results (Apr 18, 2022)
Total test results (Apr 18, 2022)
COVID Vaccine doses distributed (per 100k population) (Sep 19, 2023)
COVID Vaccine doses administered (per 100k population) (Sep 19, 2023)
COVID Vaccine doses distributed (Sep 19, 2023)
COVID Vaccine doses administered (Sep 19, 2023)
Likely homosexual households (%)
Likely homosexual households (% change since 2000)
Likely homosexual households - Lesbian couples (%)
Likely homosexual households - Lesbian couples (% change since 2000)
Likely homosexual households - Gay men (%)
Likely homosexual households - Gay men (% change since 2000)
Cost of living index
Median gross rent ($)
Median contract rent ($)
Median monthly housing costs ($)
Median house or condo value ($)
Median house or condo value ($ change since 2000)
Mean house or condo value by units in structure - 1, detached ($)
Mean house or condo value by units in structure - 1, attached ($)
Mean house or condo value by units in structure - 2 ($)
Mean house or condo value by units in structure by units in structure - 3 or 4 ($)
Mean house or condo value by units in structure - 5 or more ($)
Mean house or condo value by units in structure - Boat, RV, van, etc. ($)
Mean house or condo value by units in structure - Mobile home ($)
Median house or condo value ($) - White
Median house or condo value ($) - Black or African American
Median house or condo value ($) - Asian
Median house or condo value ($) - Hispanic or Latino
Median house or condo value ($) - American Indian and Alaska Native
Median house or condo value ($) - Multirace
Median house or condo value ($) - Other Race
Median resident age
Resident age diversity
Median resident age - Males
Median resident age - Females
Median resident age - White
Median resident age - Black or African American
Median resident age - Asian
Median resident age - Hispanic or Latino
Median resident age - American Indian and Alaska Native
Median resident age - Multirace
Median resident age - Other Race
Median resident age - Males - White
Median resident age - Males - Black or African American
Median resident age - Males - Asian
Median resident age - Males - Hispanic or Latino
Median resident age - Males - American Indian and Alaska Native
Median resident age - Males - Multirace
Median resident age - Males - Other Race
Median resident age - Females - White
Median resident age - Females - Black or African American
Median resident age - Females - Asian
Median resident age - Females - Hispanic or Latino
Median resident age - Females - American Indian and Alaska Native
Median resident age - Females - Multirace
Median resident age - Females - Other Race
Commute - mean travel time to work (minutes)
Travel time to work - Less than 5 minutes (%)
Travel time to work - Less than 5 minutes (% change since 2000)
Travel time to work - 5 to 9 minutes (%)
Travel time to work - 5 to 9 minutes (% change since 2000)
Travel time to work - 10 to 19 minutes (%)
Travel time to work - 10 to 19 minutes (% change since 2000)
Travel time to work - 20 to 29 minutes (%)
Travel time to work - 20 to 29 minutes (% change since 2000)
Travel time to work - 30 to 39 minutes (%)
Travel time to work - 30 to 39 minutes (% change since 2000)
Travel time to work - 40 to 59 minutes (%)
Travel time to work - 40 to 59 minutes (% change since 2000)
Travel time to work - 60 to 89 minutes (%)
Travel time to work - 60 to 89 minutes (% change since 2000)
Travel time to work - 90 or more minutes (%)
Travel time to work - 90 or more minutes (% change since 2000)
Marital status - Never married (%)
Marital status - Now married (%)
Marital status - Separated (%)
Marital status - Widowed (%)
Marital status - Divorced (%)
Median family income ($)
Median family income (% change since 2000)
Median non-family income ($)
Median non-family income (% change since 2000)
Median per capita income ($)
Median per capita income (% change since 2000)
Median family income ($) - White
Median family income ($) - Black or African American
Median family income ($) - Asian
Median family income ($) - Hispanic or Latino
Median family income ($) - American Indian and Alaska Native
Median family income ($) - Multirace
Median family income ($) - Other Race
Median year house/condo built
Median year apartment built
Year house built - Built 2005 or later (%)
Year house built - Built 2000 to 2004 (%)
Year house built - Built 1990 to 1999 (%)
Year house built - Built 1980 to 1989 (%)
Year house built - Built 1970 to 1979 (%)
Year house built - Built 1960 to 1969 (%)
Year house built - Built 1950 to 1959 (%)
Year house built - Built 1940 to 1949 (%)
Year house built - Built 1939 or earlier (%)
Average household size
Household density (households per square mile)
Average household size - White
Average household size - Black or African American
Average household size - Asian
Average household size - Hispanic or Latino
Average household size - American Indian and Alaska Native
Average household size - Multirace
Average household size - Other Race
Occupied housing units (%)
Vacant housing units (%)
Owner occupied housing units (%)
Renter occupied housing units (%)
Vacancy status - For rent (%)
Vacancy status - For sale only (%)
Vacancy status - Rented or sold, not occupied (%)
Vacancy status - For seasonal, recreational, or occasional use (%)
Vacancy status - For migrant workers (%)
Vacancy status - Other vacant (%)
Residents with income below the poverty level (%)
Residents with income below 50% of the poverty level (%)
Children below poverty level (%)
Poor families by family type - Married-couple family (%)
Poor families by family type - Male, no wife present (%)
Poor families by family type - Female, no husband present (%)
Poverty status for native-born residents (%)
Poverty status for foreign-born residents (%)
Poverty among high school graduates not in families (%)
Poverty among people who did not graduate high school not in families (%)
Residents with income below the poverty level (%) - White
Residents with income below the poverty level (%) - Black or African American
Residents with income below the poverty level (%) - Asian
Residents with income below the poverty level (%) - Hispanic or Latino
Residents with income below the poverty level (%) - American Indian and Alaska Native
Residents with income below the poverty level (%) - Multirace
Residents with income below the poverty level (%) - Other Race
Air pollution - Air Quality Index (AQI)
Air pollution - CO
Air pollution - NO2
Air pollution - SO2
Air pollution - Ozone
Air pollution - PM10
Air pollution - PM25
Air pollution - Pb
Crime - Murders per 100,000 population
Crime - Rapes per 100,000 population
Crime - Robberies per 100,000 population
Crime - Assaults per 100,000 population
Crime - Burglaries per 100,000 population
Crime - Thefts per 100,000 population
Crime - Auto thefts per 100,000 population
Crime - Arson per 100,000 population
Crime - City-data.com crime index
Crime - Violent crime index
Crime - Property crime index
Crime - Murders per 100,000 population (5 year average)
Crime - Rapes per 100,000 population (5 year average)
Crime - Robberies per 100,000 population (5 year average)
Crime - Assaults per 100,000 population (5 year average)
Crime - Burglaries per 100,000 population (5 year average)
Crime - Thefts per 100,000 population (5 year average)
Crime - Auto thefts per 100,000 population (5 year average)
Crime - Arson per 100,000 population (5 year average)
Crime - City-data.com crime index (5 year average)
Crime - Violent crime index (5 year average)
Crime - Property crime index (5 year average)
1996 Presidential Elections Results (%) - Democratic Party (Clinton)
1996 Presidential Elections Results (%) - Republican Party (Dole)
1996 Presidential Elections Results (%) - Other
2000 Presidential Elections Results (%) - Democratic Party (Gore)
2000 Presidential Elections Results (%) - Republican Party (Bush)
2000 Presidential Elections Results (%) - Other
2004 Presidential Elections Results (%) - Democratic Party (Kerry)
2004 Presidential Elections Results (%) - Republican Party (Bush)
2004 Presidential Elections Results (%) - Other
2008 Presidential Elections Results (%) - Democratic Party (Obama)
2008 Presidential Elections Results (%) - Republican Party (McCain)
2008 Presidential Elections Results (%) - Other
2012 Presidential Elections Results (%) - Democratic Party (Obama)
2012 Presidential Elections Results (%) - Republican Party (Romney)
2012 Presidential Elections Results (%) - Other
2016 Presidential Elections Results (%) - Democratic Party (Clinton)
2016 Presidential Elections Results (%) - Republican Party (Trump)
2016 Presidential Elections Results (%) - Other
2020 Presidential Elections Results (%) - Democratic Party (Biden)
2020 Presidential Elections Results (%) - Republican Party (Trump)
2020 Presidential Elections Results (%) - Other
Ancestries Reported - Arab (%)
Ancestries Reported - Czech (%)
Ancestries Reported - Danish (%)
Ancestries Reported - Dutch (%)
Ancestries Reported - English (%)
Ancestries Reported - French (%)
Ancestries Reported - French Canadian (%)
Ancestries Reported - German (%)
Ancestries Reported - Greek (%)
Ancestries Reported - Hungarian (%)
Ancestries Reported - Irish (%)
Ancestries Reported - Italian (%)
Ancestries Reported - Lithuanian (%)
Ancestries Reported - Norwegian (%)
Ancestries Reported - Polish (%)
Ancestries Reported - Portuguese (%)
Ancestries Reported - Russian (%)
Ancestries Reported - Scotch-Irish (%)
Ancestries Reported - Scottish (%)
Ancestries Reported - Slovak (%)
Ancestries Reported - Subsaharan African (%)
Ancestries Reported - Swedish (%)
Ancestries Reported - Swiss (%)
Ancestries Reported - Ukrainian (%)
Ancestries Reported - United States (%)
Ancestries Reported - Welsh (%)
Ancestries Reported - West Indian (%)
Ancestries Reported - Other (%)
Educational Attainment - No schooling completed (%)
Educational Attainment - Less than high school (%)
Educational Attainment - High school or equivalent (%)
Educational Attainment - Less than 1 year of college (%)
Educational Attainment - 1 or more years of college (%)
Educational Attainment - Associate degree (%)
Educational Attainment - Bachelor's degree (%)
Educational Attainment - Master's degree (%)
Educational Attainment - Professional school degree (%)
Educational Attainment - Doctorate degree (%)
School Enrollment - Nursery, preschool (%)
School Enrollment - Kindergarten (%)
School Enrollment - Grade 1 to 4 (%)
School Enrollment - Grade 5 to 8 (%)
School Enrollment - Grade 9 to 12 (%)
School Enrollment - College undergrad (%)
School Enrollment - Graduate or professional (%)
School Enrollment - Not enrolled in school (%)
School enrollment - Public schools (%)
School enrollment - Private schools (%)
School enrollment - Not enrolled (%)
Median number of rooms in houses and condos
Median number of rooms in apartments
Housing units lacking complete plumbing facilities (%)
Housing units lacking complete kitchen facilities (%)
Density of houses
Urban houses (%)
Rural houses (%)
Households with people 60 years and over (%)
Households with people 65 years and over (%)
Households with people 75 years and over (%)
Households with one or more nonrelatives (%)
Households with no nonrelatives (%)
Population in households (%)
Family households (%)
Nonfamily households (%)
Population in families (%)
Family households with own children (%)
Median number of bedrooms in owner occupied houses
Mean number of bedrooms in owner occupied houses
Median number of bedrooms in renter occupied houses
Mean number of bedrooms in renter occupied houses
Median number of vehichles in owner occupied houses
Mean number of vehichles in owner occupied houses
Median number of vehichles in renter occupied houses
Mean number of vehichles in renter occupied houses
Mortgage status - with mortgage (%)
Mortgage status - with second mortgage (%)
Mortgage status - with home equity loan (%)
Mortgage status - with both second mortgage and home equity loan (%)
Mortgage status - without a mortgage (%)
Average family size
Average family size - White
Average family size - Black or African American
Average family size - Asian
Average family size - Hispanic or Latino
Average family size - American Indian and Alaska Native
Average family size - Multirace
Average family size - Other Race
Geographical mobility - Same house 1 year ago (%)
Geographical mobility - Moved within same county (%)
Geographical mobility - Moved from different county within same state (%)
Geographical mobility - Moved from different state (%)
Geographical mobility - Moved from abroad (%)
Place of birth - Born in state of residence (%)
Place of birth - Born in other state (%)
Place of birth - Native, outside of US (%)
Place of birth - Foreign born (%)
Housing units in structures - 1, detached (%)
Housing units in structures - 1, attached (%)
Housing units in structures - 2 (%)
Housing units in structures - 3 or 4 (%)
Housing units in structures - 5 to 9 (%)
Housing units in structures - 10 to 19 (%)
Housing units in structures - 20 to 49 (%)
Housing units in structures - 50 or more (%)
Housing units in structures - Mobile home (%)
Housing units in structures - Boat, RV, van, etc. (%)
House/condo owner moved in on average (years ago)
Renter moved in on average (years ago)
Year householder moved into unit - Moved in 1999 to March 2000 (%)
Year householder moved into unit - Moved in 1995 to 1998 (%)
Year householder moved into unit - Moved in 1990 to 1994 (%)
Year householder moved into unit - Moved in 1980 to 1989 (%)
Year householder moved into unit - Moved in 1970 to 1979 (%)
Year householder moved into unit - Moved in 1969 or earlier (%)
Means of transportation to work - Drove car alone (%)
Means of transportation to work - Carpooled (%)
Means of transportation to work - Public transportation (%)
Means of transportation to work - Bus or trolley bus (%)
Means of transportation to work - Streetcar or trolley car (%)
Means of transportation to work - Subway or elevated (%)
Means of transportation to work - Railroad (%)
Means of transportation to work - Ferryboat (%)
Means of transportation to work - Taxicab (%)
Means of transportation to work - Motorcycle (%)
Means of transportation to work - Bicycle (%)
Means of transportation to work - Walked (%)
Means of transportation to work - Other means (%)
Working at home (%)
Industry diversity
Most Common Industries - Agriculture, forestry, fishing and hunting, and mining (%)
Most Common Industries - Agriculture, forestry, fishing and hunting (%)
Most Common Industries - Mining, quarrying, and oil and gas extraction (%)
Most Common Industries - Construction (%)
Most Common Industries - Manufacturing (%)
Most Common Industries - Wholesale trade (%)
Most Common Industries - Retail trade (%)
Most Common Industries - Transportation and warehousing, and utilities (%)
Most Common Industries - Transportation and warehousing (%)
Most Common Industries - Utilities (%)
Most Common Industries - Information (%)
Most Common Industries - Finance and insurance, and real estate and rental and leasing (%)
Most Common Industries - Finance and insurance (%)
Most Common Industries - Real estate and rental and leasing (%)
Most Common Industries - Professional, scientific, and management, and administrative and waste management services (%)
Most Common Industries - Professional, scientific, and technical services (%)
Most Common Industries - Management of companies and enterprises (%)
Most Common Industries - Administrative and support and waste management services (%)
Most Common Industries - Educational services, and health care and social assistance (%)
Most Common Industries - Educational services (%)
Most Common Industries - Health care and social assistance (%)
Most Common Industries - Arts, entertainment, and recreation, and accommodation and food services (%)
Most Common Industries - Arts, entertainment, and recreation (%)
Most Common Industries - Accommodation and food services (%)
Most Common Industries - Other services, except public administration (%)
Most Common Industries - Public administration (%)
Occupation diversity
Most Common Occupations - Management, business, science, and arts occupations (%)
Most Common Occupations - Management, business, and financial occupations (%)
Most Common Occupations - Management occupations (%)
Most Common Occupations - Business and financial operations occupations (%)
Most Common Occupations - Computer, engineering, and science occupations (%)
Most Common Occupations - Computer and mathematical occupations (%)
Most Common Occupations - Architecture and engineering occupations (%)
Most Common Occupations - Life, physical, and social science occupations (%)
Most Common Occupations - Education, legal, community service, arts, and media occupations (%)
Most Common Occupations - Community and social service occupations (%)
Most Common Occupations - Legal occupations (%)
Most Common Occupations - Education, training, and library occupations (%)
Most Common Occupations - Arts, design, entertainment, sports, and media occupations (%)
Most Common Occupations - Healthcare practitioners and technical occupations (%)
Most Common Occupations - Health diagnosing and treating practitioners and other technical occupations (%)
Most Common Occupations - Health technologists and technicians (%)
Most Common Occupations - Service occupations (%)
Most Common Occupations - Healthcare support occupations (%)
Most Common Occupations - Protective service occupations (%)
Most Common Occupations - Fire fighting and prevention, and other protective service workers including supervisors (%)
Most Common Occupations - Law enforcement workers including supervisors (%)
Most Common Occupations - Food preparation and serving related occupations (%)
Most Common Occupations - Building and grounds cleaning and maintenance occupations (%)
Most Common Occupations - Personal care and service occupations (%)
Most Common Occupations - Sales and office occupations (%)
Most Common Occupations - Sales and related occupations (%)
Most Common Occupations - Office and administrative support occupations (%)
Most Common Occupations - Natural resources, construction, and maintenance occupations (%)
Most Common Occupations - Farming, fishing, and forestry occupations (%)
Most Common Occupations - Construction and extraction occupations (%)
Most Common Occupations - Installation, maintenance, and repair occupations (%)
Most Common Occupations - Production, transportation, and material moving occupations (%)
Most Common Occupations - Production occupations (%)
Most Common Occupations - Transportation occupations (%)
Most Common Occupations - Material moving occupations (%)
People in Group quarters - Institutionalized population (%)
People in Group quarters - Correctional institutions (%)
People in Group quarters - Federal prisons and detention centers (%)
People in Group quarters - Halfway houses (%)
People in Group quarters - Local jails and other confinement facilities (including police lockups) (%)
People in Group quarters - Military disciplinary barracks (%)
People in Group quarters - State prisons (%)
People in Group quarters - Other types of correctional institutions (%)
People in Group quarters - Nursing homes (%)
People in Group quarters - Hospitals/wards, hospices, and schools for the handicapped (%)
People in Group quarters - Hospitals/wards and hospices for chronically ill (%)
People in Group quarters - Hospices or homes for chronically ill (%)
People in Group quarters - Military hospitals or wards for chronically ill (%)
People in Group quarters - Other hospitals or wards for chronically ill (%)
People in Group quarters - Hospitals or wards for drug/alcohol abuse (%)
People in Group quarters - Mental (Psychiatric) hospitals or wards (%)
People in Group quarters - Schools, hospitals, or wards for the mentally retarded (%)
People in Group quarters - Schools, hospitals, or wards for the physically handicapped (%)
People in Group quarters - Institutions for the deaf (%)
People in Group quarters - Institutions for the blind (%)
People in Group quarters - Orthopedic wards and institutions for the physically handicapped (%)
People in Group quarters - Wards in general hospitals for patients who have no usual home elsewhere (%)
People in Group quarters - Wards in military hospitals for patients who have no usual home elsewhere (%)
People in Group quarters - Juvenile institutions (%)
People in Group quarters - Long-term care (%)
People in Group quarters - Homes for abused, dependent, and neglected children (%)
People in Group quarters - Residential treatment centers for emotionally disturbed children (%)
People in Group quarters - Training schools for juvenile delinquents (%)
People in Group quarters - Short-term care, detention or diagnostic centers for delinquent children (%)
People in Group quarters - Type of juvenile institution unknown (%)
People in Group quarters - Noninstitutionalized population (%)
People in Group quarters - College dormitories (includes college quarters off campus) (%)
People in Group quarters - Military quarters (%)
People in Group quarters - On base (%)
People in Group quarters - Barracks, unaccompanied personnel housing (UPH), (Enlisted/Officer), ;and similar group living quarters for military personnel (%)
People in Group quarters - Transient quarters for temporary residents (%)
People in Group quarters - Military ships (%)
People in Group quarters - Group homes (%)
People in Group quarters - Homes or halfway houses for drug/alcohol abuse (%)
People in Group quarters - Homes for the mentally ill (%)
People in Group quarters - Homes for the mentally retarded (%)
People in Group quarters - Homes for the physically handicapped (%)
People in Group quarters - Other group homes (%)
People in Group quarters - Religious group quarters (%)
People in Group quarters - Dormitories (%)
People in Group quarters - Agriculture workers' dormitories on farms (%)
People in Group quarters - Job Corps and vocational training facilities (%)
People in Group quarters - Other workers' dormitories (%)
People in Group quarters - Crews of maritime vessels (%)
People in Group quarters - Other nonhousehold living situations (%)
People in Group quarters - Other noninstitutional group quarters (%)
Residents speaking English at home (%)
Residents speaking English at home - Born in the United States (%)
Residents speaking English at home - Native, born elsewhere (%)
Residents speaking English at home - Foreign born (%)
Residents speaking Spanish at home (%)
Residents speaking Spanish at home - Born in the United States (%)
Residents speaking Spanish at home - Native, born elsewhere (%)
Residents speaking Spanish at home - Foreign born (%)
Residents speaking other language at home (%)
Residents speaking other language at home - Born in the United States (%)
Residents speaking other language at home - Native, born elsewhere (%)
Residents speaking other language at home - Foreign born (%)
Class of Workers - Employee of private company (%)
Class of Workers - Self-employed in own incorporated business (%)
Class of Workers - Private not-for-profit wage and salary workers (%)
Class of Workers - Local government workers (%)
Class of Workers - State government workers (%)
Class of Workers - Federal government workers (%)
Class of Workers - Self-employed workers in own not incorporated business and Unpaid family workers (%)
House heating fuel used in houses and condos - Utility gas (%)
House heating fuel used in houses and condos - Bottled, tank, or LP gas (%)
House heating fuel used in houses and condos - Electricity (%)
House heating fuel used in houses and condos - Fuel oil, kerosene, etc. (%)
House heating fuel used in houses and condos - Coal or coke (%)
House heating fuel used in houses and condos - Wood (%)
House heating fuel used in houses and condos - Solar energy (%)
House heating fuel used in houses and condos - Other fuel (%)
House heating fuel used in houses and condos - No fuel used (%)
House heating fuel used in apartments - Utility gas (%)
House heating fuel used in apartments - Bottled, tank, or LP gas (%)
House heating fuel used in apartments - Electricity (%)
House heating fuel used in apartments - Fuel oil, kerosene, etc. (%)
House heating fuel used in apartments - Coal or coke (%)
House heating fuel used in apartments - Wood (%)
House heating fuel used in apartments - Solar energy (%)
House heating fuel used in apartments - Other fuel (%)
House heating fuel used in apartments - No fuel used (%)
Armed forces status - In Armed Forces (%)
Armed forces status - Civilian (%)
Armed forces status - Civilian - Veteran (%)
Armed forces status - Civilian - Nonveteran (%)
Fatal accidents locations in years 2005-2021
Fatal accidents locations in 2005
Fatal accidents locations in 2006
Fatal accidents locations in 2007
Fatal accidents locations in 2008
Fatal accidents locations in 2009
Fatal accidents locations in 2010
Fatal accidents locations in 2011
Fatal accidents locations in 2012
Fatal accidents locations in 2013
Fatal accidents locations in 2014
Fatal accidents locations in 2015
Fatal accidents locations in 2016
Fatal accidents locations in 2017
Fatal accidents locations in 2018
Fatal accidents locations in 2019
Fatal accidents locations in 2020
Fatal accidents locations in 2021
Alcohol use - People drinking some alcohol every month (%)
Alcohol use - People not drinking at all (%)
Alcohol use - Average days/month drinking alcohol
Alcohol use - Average drinks/week
Alcohol use - Average days/year people drink much
Audiometry - Average condition of hearing (%)
Audiometry - People that can hear a whisper from across a quiet room (%)
Audiometry - People that can hear normal voice from across a quiet room (%)
Audiometry - Ears ringing, roaring, buzzing (%)
Audiometry - Had a job exposure to loud noise (%)
Audiometry - Had off-work exposure to loud noise (%)
Blood Pressure & Cholesterol - Has high blood pressure (%)
Blood Pressure & Cholesterol - Checking blood pressure at home (%)
Blood Pressure & Cholesterol - Frequently checking blood cholesterol (%)
Blood Pressure & Cholesterol - Has high cholesterol level (%)
Consumer Behavior - Money monthly spent on food at supermarket/grocery store
Consumer Behavior - Money monthly spent on food at other stores
Consumer Behavior - Money monthly spent on eating out
Consumer Behavior - Money monthly spent on carryout/delivered foods
Consumer Behavior - Income spent on food at supermarket/grocery store (%)
Consumer Behavior - Income spent on food at other stores (%)
Consumer Behavior - Income spent on eating out (%)
Consumer Behavior - Income spent on carryout/delivered foods (%)
Current Health Status - General health condition (%)
Current Health Status - Blood donors (%)
Current Health Status - Has blood ever tested for HIV virus (%)
Current Health Status - Left-handed people (%)
Dermatology - People using sunscreen (%)
Diabetes - Diabetics (%)
Diabetes - Had a blood test for high blood sugar (%)
Diabetes - People taking insulin (%)
Diet Behavior & Nutrition - Diet health (%)
Diet Behavior & Nutrition - Milk product consumption (# of products/month)
Diet Behavior & Nutrition - Meals not home prepared (#/week)
Diet Behavior & Nutrition - Meals from fast food or pizza place (#/week)
Diet Behavior & Nutrition - Ready-to-eat foods (#/month)
Diet Behavior & Nutrition - Frozen meals/pizza (#/month)
Drug Use - People that ever used marijuana or hashish (%)
Drug Use - Ever used hard drugs (%)
Drug Use - Ever used any form of cocaine (%)
Drug Use - Ever used heroin (%)
Drug Use - Ever used methamphetamine (%)
Health Insurance - People covered by health insurance (%)
Kidney Conditions-Urology - Avg. # of times urinating at night
Medical Conditions - People with asthma (%)
Medical Conditions - People with anemia (%)
Medical Conditions - People with psoriasis (%)
Medical Conditions - People with overweight (%)
Medical Conditions - Elderly people having difficulties in thinking or remembering (%)
Medical Conditions - People who ever received blood transfusion (%)
Medical Conditions - People having trouble seeing even with glass/contacts (%)
Medical Conditions - People with arthritis (%)
Medical Conditions - People with gout (%)
Medical Conditions - People with congestive heart failure (%)
Medical Conditions - People with coronary heart disease (%)
Medical Conditions - People with angina pectoris (%)
Medical Conditions - People who ever had heart attack (%)
Medical Conditions - People who ever had stroke (%)
Medical Conditions - People with emphysema (%)
Medical Conditions - People with thyroid problem (%)
Medical Conditions - People with chronic bronchitis (%)
Medical Conditions - People with any liver condition (%)
Medical Conditions - People who ever had cancer or malignancy (%)
Mental Health - People who have little interest in doing things (%)
Mental Health - People feeling down, depressed, or hopeless (%)
Mental Health - People who have trouble sleeping or sleeping too much (%)
Mental Health - People feeling tired or having little energy (%)
Mental Health - People with poor appetite or overeating (%)
Mental Health - People feeling bad about themself (%)
Mental Health - People who have trouble concentrating on things (%)
Mental Health - People moving or speaking slowly or too fast (%)
Mental Health - People having thoughts they would be better off dead (%)
Oral Health - Average years since last visit a dentist
Oral Health - People embarrassed because of mouth (%)
Oral Health - People with gum disease (%)
Oral Health - General health of teeth and gums (%)
Oral Health - Average days a week using dental floss/device
Oral Health - Average days a week using mouthwash for dental problem
Oral Health - Average number of teeth
Pesticide Use - Households using pesticides to control insects (%)
Pesticide Use - Households using pesticides to kill weeds (%)
Physical Activity - People doing vigorous-intensity work activities (%)
Physical Activity - People doing moderate-intensity work activities (%)
Physical Activity - People walking or bicycling (%)
Physical Activity - People doing vigorous-intensity recreational activities (%)
Physical Activity - People doing moderate-intensity recreational activities (%)
Physical Activity - Average hours a day doing sedentary activities
Physical Activity - Average hours a day watching TV or videos
Physical Activity - Average hours a day using computer
Physical Functioning - People having limitations keeping them from working (%)
Physical Functioning - People limited in amount of work they can do (%)
Physical Functioning - People that need special equipment to walk (%)
Physical Functioning - People experiencing confusion/memory problems (%)
Physical Functioning - People requiring special healthcare equipment (%)
Prescription Medications - Average number of prescription medicines taking
Preventive Aspirin Use - Adults 40+ taking low-dose aspirin (%)
Reproductive Health - Vaginal deliveries (%)
Reproductive Health - Cesarean deliveries (%)
Reproductive Health - Deliveries resulted in a live birth (%)
Reproductive Health - Pregnancies resulted in a delivery (%)
Reproductive Health - Women breastfeeding newborns (%)
Reproductive Health - Women that had a hysterectomy (%)
Reproductive Health - Women that had both ovaries removed (%)
Reproductive Health - Women that have ever taken birth control pills (%)
Reproductive Health - Women taking birth control pills (%)
Reproductive Health - Women that have ever used Depo-Provera or injectables (%)
Reproductive Health - Women that have ever used female hormones (%)
Sexual Behavior - People 18+ that ever had sex (vaginal, anal, or oral) (%)
Sexual Behavior - Males 18+ that ever had vaginal sex with a woman (%)
Sexual Behavior - Males 18+ that ever performed oral sex on a woman (%)
Sexual Behavior - Males 18+ that ever had anal sex with a woman (%)
Sexual Behavior - Males 18+ that ever had any sex with a man (%)
Sexual Behavior - Females 18+ that ever had vaginal sex with a man (%)
Sexual Behavior - Females 18+ that ever performed oral sex on a man (%)
Sexual Behavior - Females 18+ that ever had anal sex with a man (%)
Sexual Behavior - Females 18+ that ever had any kind of sex with a woman (%)
Sexual Behavior - Average age people first had sex
Sexual Behavior - Average number of female sex partners in lifetime (males 18+)
Sexual Behavior - Average number of female vaginal sex partners in lifetime (males 18+)
Sexual Behavior - Average age people first performed oral sex on a woman (18+)
Sexual Behavior - Average number of woman performed oral sex on in lifetime (18+)
Sexual Behavior - Average number of male sex partners in lifetime (males 18+)
Sexual Behavior - Average number of male anal sex partners in lifetime (males 18+)
Sexual Behavior - Average age people first performed oral sex on a man (18+)
Sexual Behavior - Average number of male oral sex partners in lifetime (18+)
Sexual Behavior - People using protection when performing oral sex (%)
Sexual Behavior - Average number of times people have vaginal or anal sex a year
Sexual Behavior - People having sex without condom (%)
Sexual Behavior - Average number of male sex partners in lifetime (females 18+)
Sexual Behavior - Average number of male vaginal sex partners in lifetime (females 18+)
Sexual Behavior - Average number of female sex partners in lifetime (females 18+)
Sexual Behavior - Circumcised males 18+ (%)
Sleep Disorders - Average hours sleeping at night
Sleep Disorders - People that has trouble sleeping (%)
Smoking-Cigarette Use - People smoking cigarettes (%)
Taste & Smell - People 40+ having problems with smell (%)
Taste & Smell - People 40+ having problems with taste (%)
Taste & Smell - People 40+ that ever had wisdom teeth removed (%)
Taste & Smell - People 40+ that ever had tonsils teeth removed (%)
Taste & Smell - People 40+ that ever had a loss of consciousness because of a head injury (%)
Taste & Smell - People 40+ that ever had a broken nose or other serious injury to face or skull (%)
Taste & Smell - People 40+ that ever had two or more sinus infections (%)
Weight - Average height (inches)
Weight - Average weight (pounds)
Weight - Average BMI
Weight - People that are obese (%)
Weight - People that ever were obese (%)
Weight - People trying to lose weight (%)
Urban population: 37,229
Rural population: 3,174
Estimated median house/condo value in 2022: $431,151
79707:
$431,151Texas:
$275,400
According to our research of Texas and other state lists, there were 43 registered sex offenders living in 79707 zip code as of May 17, 2024 . The ratio of all residents to sex offenders in zip code 79707 is 887 to 1.The ratio of registered sex offenders to all residents in this zip code is lower than the state average.
Median resident age: This zip code:
32.3 yearsTexas median age:
35.6 years
Average household size: This zip code:
2.4 peopleTexas:
2.6 people
Averages for the 2020 tax year for zip code 79707, filed in 2021:
Average Adjusted Gross Income (AGI) in 2020: $132,476 (Individual Income Tax Returns) Here:
$132,476State:
$77,054
Salary/wage: $104,753 (reported on 85.7% of returns )Here:
$104,753State:
$62,766
(% of AGI for various income ranges: 1236.3% for AGIs below $25k , 3665.8% for AGIs $25k-50k , 6512.6% for AGIs $50k-75k , 9982.9% for AGIs $75k-100k , 18961.0% for AGIs $100k-200k , 76858.2% for AGIs over 200k ) Taxable interest for individuals: $2,926 (reported on 33.7% of returns )This zip code:
$2,926Texas:
$2,665
(% of AGI for various income ranges: 12.8% for AGIs below $25k , 16.3% for AGIs $25k-50k , 39.2% for AGIs $50k-75k , 57.2% for AGIs $75k-100k , 110.7% for AGIs $100k-200k , 1244.1% for AGIs over 200k ) Ordinary dividends: $12,687 (reported on 26.5% of returns )Here:
$12,687State:
$10,044
(% of AGI for various income ranges: 33.5% for AGIs below $25k , 43.3% for AGIs $25k-50k , 95.0% for AGIs $50k-75k , 254.9% for AGIs $75k-100k , 393.9% for AGIs $100k-200k , 4275.4% for AGIs over 200k ) Net capital gain/loss in AGI: +$27,719 (reported on 25.3% of returns )Here:
+$27,719State:
+$39,590
(% of AGI for various income ranges: 10.8% for AGIs below $25k , 21.2% for AGIs $25k-50k , 112.0% for AGIs $50k-75k , 142.1% for AGIs $75k-100k , 475.6% for AGIs $100k-200k , 10592.0% for AGIs over 200k ) Profit/loss from business: +$17,654 (reported on 21.1% of returns )Here:
+$17,654State:
+$10,888
(% of AGI for various income ranges: 59.2% for AGIs below $25k , 98.9% for AGIs $25k-50k , 160.2% for AGIs $50k-75k , 387.9% for AGIs $75k-100k , 716.7% for AGIs $100k-200k , 3678.0% for AGIs over 200k ) Taxable individual retirement arrangement distribution: $34,517 (reported on 8.4% of returns )79707:
$34,517Texas:
$24,740
(% of AGI for various income ranges: 51.3% for AGIs below $25k , 95.8% for AGIs $25k-50k , 207.7% for AGIs $50k-75k , 415.7% for AGIs $75k-100k , 633.6% for AGIs $100k-200k , 2379.7% for AGIs over 200k ) Self-employed (Keogh) retirement plans: $24,482 (reported on 0.7% of returns )79707:
$24,482Texas:
$29,298
(% of AGI for various income ranges: 22.6% for AGIs $100k-200k , 241.4% for AGIs over 200k ) Total itemized deductions: $43,143 (reported on 14.6% of returns )Here:
$43,143State:
$40,428
(% of AGI for various income ranges: 61.8% for AGIs below $25k , 155.7% for AGIs $25k-50k , 322.5% for AGIs $50k-75k , 657.2% for AGIs $75k-100k , 1065.9% for AGIs $100k-200k , 6647.6% for AGIs over 200k ) Charity contributions: $21,331 (reported on 11.8% of returns )Here:
$21,331State:
$18,201
(% of AGI for various income ranges: 6.8% for AGIs below $25k , 25.6% for AGIs $25k-50k , 64.9% for AGIs $50k-75k , 150.7% for AGIs $75k-100k , 335.8% for AGIs $100k-200k , 3209.2% for AGIs over 200k ) Taxes paid: $8,141 (reported on 14.3% of returns )(% of AGI for various income ranges: 8.2% for AGIs below $25k , 29.7% for AGIs $25k-50k , 60.3% for AGIs $50k-75k , 129.0% for AGIs $75k-100k , 237.9% for AGIs $100k-200k , 1131.0% for AGIs over 200k ) Earned income credit: $2,178 (reported on 10.3% of returns )(% of AGI for various income ranges: 81.8% for AGIs below $25k , 63.5% for AGIs $25k-50k , 1.0% for AGIs $50k-75k ) Percentage of individuals using paid preparers for their 2020 taxes: 93.1%(% for various income ranges: 91.9% for AGIs below $25k , 94.1% for AGIs $25k-50k , 93.2% for AGIs $50k-75k , 92.5% for AGIs $75k-100k , 93.6% for AGIs $100k-200k , 93.3% for AGIs over 200k )
Averages for the 2012 tax year for zip code 79707, filed in 2013:
Average Adjusted Gross Income (AGI) in 2012: $137,115 (Individual Income Tax Returns) Here:
$137,115State:
$65,384
Salary/wage: $88,142 (reported on 87.3% of returns )Here:
$88,142State:
$52,524
(% of AGI for various income ranges: 82.5% for AGIs below $25k , 84.9% for AGIs $25k-50k , 80.1% for AGIs $50k-75k , 81.6% for AGIs $75k-100k , 82.1% for AGIs $100k-200k , 39.3% for AGIs over 200k ) Taxable interest for individuals: $2,708 (reported on 35.6% of returns )This zip code:
$2,708Texas:
$2,372
(% of AGI for various income ranges: 1.0% for AGIs below $25k , 0.5% for AGIs $25k-50k , 0.6% for AGIs $50k-75k , 0.5% for AGIs $75k-100k , 0.5% for AGIs $100k-200k , 0.8% for AGIs over 200k ) Ordinary dividends: $10,787 (reported on 23.1% of returns )(% of AGI for various income ranges: 2.0% for AGIs below $25k , 1.1% for AGIs $25k-50k , 1.2% for AGIs $50k-75k , 1.1% for AGIs $75k-100k , 1.1% for AGIs $100k-200k , 2.2% for AGIs over 200k ) Net capital gain/loss in AGI: +$91,373 (reported on 20.3% of returns )Here:
+$91,373State:
+$35,319
(% of AGI for various income ranges: 0.1% for AGIs below $25k , 0.2% for AGIs $25k-50k , 0.4% for AGIs $50k-75k , 0.7% for AGIs $75k-100k , 1.1% for AGIs $100k-200k , 21.9% for AGIs over 200k ) Profit/loss from business: +$32,282 (reported on 19.7% of returns )Here:
+$32,282State:
+$13,732
(% of AGI for various income ranges: 5.8% for AGIs below $25k , 3.1% for AGIs $25k-50k , 3.5% for AGIs $50k-75k , 2.9% for AGIs $75k-100k , 4.4% for AGIs $100k-200k , 5.1% for AGIs over 200k ) Taxable individual retirement arrangement distribution: $22,431 (reported on 9.4% of returns )79707:
$22,431Texas:
$19,511
(% of AGI for various income ranges: 3.2% for AGIs below $25k , 2.2% for AGIs $25k-50k , 3.0% for AGIs $50k-75k , 2.6% for AGIs $75k-100k , 2.4% for AGIs $100k-200k , 0.9% for AGIs over 200k ) Self-employment retirement plans: $29,042 (reported on 1.2% of returns )79707:
$29,042Texas:
$23,938
(% of AGI for various income ranges: 0.1% for AGIs $50k-75k , 0.2% for AGIs $100k-200k , 0.3% for AGIs over 200k ) Total itemized deductions: $32,548 (12% of AGI, reported on 35.6% of returns )Here:
$32,548State:
$24,724
Here:
11.6% of AGIState:
15.9% of AGI
(% of AGI for various income ranges: 8.5% for AGIs below $25k , 7.5% for AGIs $25k-50k , 9.3% for AGIs $50k-75k , 8.9% for AGIs $75k-100k , 10.6% for AGIs $100k-200k , 7.7% for AGIs over 200k ) Charity contributions: $14,138 (reported on 28.0% of returns )(% of AGI for various income ranges: 0.7% for AGIs below $25k , 1.0% for AGIs $25k-50k , 1.6% for AGIs $50k-75k , 1.8% for AGIs $75k-100k , 2.4% for AGIs $100k-200k , 3.5% for AGIs over 200k ) Taxes paid: $7,395 (reported on 35.0% of returns )(% of AGI for various income ranges: 1.2% for AGIs below $25k , 1.4% for AGIs $25k-50k , 2.0% for AGIs $50k-75k , 2.3% for AGIs $75k-100k , 3.1% for AGIs $100k-200k , 1.5% for AGIs over 200k ) Earned income credit: $2,198 (reported on 10.3% of returns )(% of AGI for various income ranges: 5.3% for AGIs below $25k , 0.9% for AGIs $25k-50k ) Percentage of individuals using paid preparers for their 2012 taxes: 54.2%(% for various income ranges: 47.6% for AGIs below $25k , 50.0% for AGIs $25k-50k , 50.7% for AGIs $50k-75k , 54.1% for AGIs $75k-100k , 57.5% for AGIs $100k-200k , 73.7% for AGIs over 200k )
Averages for the 2004 tax year for zip code 79707, filed in 2005:
Average Adjusted Gross Income (AGI) in 2004: $68,792 (Individual Income Tax Returns) Here:
$68,792State:
$47,881
Salary/wage: $53,530 (reported on 85.0% of returns )Here:
$53,530State:
$41,947
(% of AGI for various income ranges: 202.8% for AGIs below $10k , 81.2% for AGIs $10k-25k , 79.4% for AGIs $25k-50k , 78.4% for AGIs $50k-75k , 78.7% for AGIs $75k-100k , 55.9% for AGIs over 100k ) Taxable interest for individuals: $2,441 (reported on 43.8% of returns )This zip code:
$2,441Texas:
$2,255
(% of AGI for various income ranges: 12.7% for AGIs below $10k , 2.5% for AGIs $10k-25k , 1.9% for AGIs $25k-50k , 1.6% for AGIs $50k-75k , 1.6% for AGIs $75k-100k , 1.3% for AGIs over 100k ) Taxable dividends: $5,541 (reported on 28.4% of returns )(% of AGI for various income ranges: 7.7% for AGIs below $10k , 1.3% for AGIs $10k-25k , 1.5% for AGIs $25k-50k , 1.3% for AGIs $50k-75k , 1.3% for AGIs $75k-100k , 2.9% for AGIs over 100k ) Net capital gain/loss: +$17,014 (reported on 24.8% of returns )Here:
+$17,014State:
+$16,110
(% of AGI for various income ranges: 0.5% for AGIs below $10k , -0.1% for AGIs $10k-25k , 0.4% for AGIs $25k-50k , 0.5% for AGIs $50k-75k , 0.9% for AGIs $75k-100k , 9.9% for AGIs over 100k ) Profit/loss from business: +$20,232 (reported on 19.7% of returns )Here:
+$20,232State:
+$11,013
(% of AGI for various income ranges: 0.2% for AGIs below $10k , 3.8% for AGIs $10k-25k , 4.0% for AGIs $25k-50k , 4.2% for AGIs $50k-75k , 4.4% for AGIs $75k-100k , 6.9% for AGIs over 100k ) IRA payment deduction: $3,610 (reported on 3.0% of returns )(% of AGI for various income ranges: 0.7% for AGIs below $10k , 0.1% for AGIs $10k-25k , 0.3% for AGIs $25k-50k , 0.2% for AGIs $50k-75k , 0.2% for AGIs $75k-100k , 0.1% for AGIs over 100k ) Self-employed pension: $21,087 (reported on 1.5% of returns )Here:
$21,087Texas:
$16,401
(% of AGI for various income ranges: 0.1% for AGIs $10k-25k , 0.2% for AGIs $50k-75k , 0.3% for AGIs $75k-100k , 0.6% for AGIs over 100k ) Total itemized deductions: $19,703 (16% of AGI, reported on 32.1% of returns )Here:
$19,703State:
$19,631
Here:
16.2% of AGIState:
18.9% of AGI
(% of AGI for various income ranges: 17.5% for AGIs below $10k , 7.8% for AGIs $10k-25k , 8.8% for AGIs $25k-50k , 11.1% for AGIs $50k-75k , 12.0% for AGIs $75k-100k , 8.3% for AGIs over 100k ) Charity contributions deductions: $6,484 (5% of AGI, reported on 28.0% of returns )Here:
5.0% of AGIState:
4.2% of AGI
(% of AGI for various income ranges: 1.2% for AGIs below $10k , 1.1% for AGIs $10k-25k , 1.6% for AGIs $25k-50k , 2.2% for AGIs $50k-75k , 2.8% for AGIs $75k-100k , 3.0% for AGIs over 100k ) Total tax: $14,056 (reported on 76.9% of returns )79707:
$14,056State:
$9,058
(% of AGI for various income ranges: 7.2% for AGIs below $10k , 4.0% for AGIs $10k-25k , 7.2% for AGIs $25k-50k , 9.3% for AGIs $50k-75k , 11.1% for AGIs $75k-100k , 20.5% for AGIs over 100k ) Earned income credit: $1,861 (reported on 13.0% of returns )Percentage of individuals using paid preparers for their 2004 taxes: 55.6%(% for various income ranges: 50.5% for AGIs below $10k , 58.8% for AGIs $10k-25k , 54.0% for AGIs $25k-50k , 52.3% for AGIs $50k-75k , 54.3% for AGIs $75k-100k , 63.1% for AGIs over 100k )
Estimated median household income in 2022: This zip code:
$98,706Texas:
$72,284
Nearest zip codes: 79703 ,
79701 ,
79705 ,
79758 ,
79765 ,
79762 .
Odessa Zip Code Map
Percentage of family households: This zip code:
52.4%Texas:
50.5%
Percentage of households with unmarried partners: This zip code:
4.1%Texas:
48.7%
Likely homosexual households (counted as self-reported same-sex unmarried-partner households)
Lesbian couples: 0.1% of all households Gay men: 0.0% of all households
Household received Food Stamps/SNAP in the past 12 months: 592Household did not receive Food Stamps/SNAP in the past 12 months: 15,674
Women who had a birth in the past 12 months: 617 (597 now married , 29 unmarried) Women who did not have a birth in the past 12 months: 9,028 (5,305 now married , 3,680 unmarried)
Housing units in zip code 79707 with a mortgage: 5,779 (224
second mortgage , 162
both second mortgage and home equity loan )
Median monthly owner costs for units with a mortgage: $2,518
Median monthly owner costs for units without a mortgage: $898
Residents with income below the poverty level in 2022:
This zip code:
7.4%Whole state:
14.0%
Residents with income below 50% of the poverty level in 2022:
This zip code:
4.1%Whole state:
7.4%
Median number of rooms in houses and condos: Median number of rooms in apartments: Notable locations in this zip code not listed on our city pages
Click to draw/clear zip code borders Notable locations in zip code 79707: (A) , High Sky Girls Ranch (B) , New Windmill (C) , Nobles East Windmill (D) , North Cooksey Windmill (E) , South Camp Windmill (F) , South Cooksey Windmill (G) , South Whittenburg Windmill (H) , South Windmill (I) , Tower Windmill (J) , West Windmill (K) , Windmill Number Twentyfour (L) , Midland Fire Department Station 8 (M) , Midland Fire Department Station 9 (N) . Display/hide their locations on the map
Shopping Center: (1) . Display/hide its location on the map
Churches in zip code 79707 include: (A) , Fellowship Community Church (B) , Country Chapel Church (C) . Display/hide their locations on the map
Parks in zip code 79707 include: (1) , Sage Park (2) , Pioneer Park (3) , Trinity Park (4) , Rusk Park (5) , Coombes Field - Trinity School (6) , Essax Park (7) , C J Kelly Park (8) . Display/hide their locations on the map
Year house built (houses)
109 2020 or later2,722 2010 to 20192,482 2000 to 20092,591 1990 to 19994,840 1980 to 19891,631 1970 to 19791,002 1960 to 1969641 1950 to 195933 1940 to 19490 1939 or earlier
Zip code 79707 household income distribution in 2022 937 Less than $10,000337 $10,000 to $14,999390 $15,000 to $19,999209 $20,000 to $24,999388 $25,000 to $29,999342 $30,000 to $34,999320 $35,000 to $39,999204 $40,000 to $44,999488 $45,000 to $49,9991,412 $50,000 to $59,9991,563 $60,000 to $74,9991,696 $75,000 to $99,9991,147 $100,000 to $124,9991,100 $125,000 to $149,9992,172 $150,000 to $199,9993,636 $200,000 or moreEstimate of home value of owner-occupied houses/condos in 2022 in zip code 79707 42 Less than $10,00013 $15,000 to $19,99912 $20,000 to $24,99918 $25,000 to $29,99959 $40,000 to $49,99939 $50,000 to $59,99973 $80,000 to $89,99920 $100,000 to $124,99973 $125,000 to $149,999234 $150,000 to $174,999183 $175,000 to $199,999683 $200,000 to $249,9991,694 $250,000 to $299,9992,493 $300,000 to $399,9991,864 $400,000 to $499,9992,404 $500,000 to $749,999963 $750,000 to $999,999264 $1,000,000 to $1,499,99917 $2,000,000 or moreRent paid by renters in 2022 in zip code 79707 45 $500 to $54959 $550 to $59932 $600 to $649194 $650 to $699269 $700 to $74957 $750 to $799570 $800 to $899299 $900 to $9992,033 $1,000 to $1,2491,118 $1,250 to $1,4991,001 $1,500 to $1,999531 $2,000 to $2,499358 $2,500 to $2,9996 $3,500 or more76 No cash rent
Median gross rent in 2022: $1,411.
Median price asked for vacant for-sale houses and condos in 2022: $1,247,329.
Estimated median house (or condo) value in 2022 for: White Non-Hispanic householders: $438,060Black or African American householders: $341,788American Indian or Alaska Native householders: $345,473Asian householders: $719,967Some other race householders: $375,414Two or more races householders: $374,033Hispanic or Latino householders: $398,907Estimated median house or condo value in 2022: $431,151
79707:
$431,151Texas:
$275,400
Lower value quartile - upper value quartile: $319,730 - $602,929
Mean price in 2022: Detached houses: $491,732Here:
$491,732State:
$369,058
Townhouses or other attached units: $227,446Here:
$227,446State:
$327,631
In 2-unit structures: $361,369Here:
$361,369State:
$374,947
In 5-or-more-unit structures: $137,966Here:
$137,966State:
$413,944
Mobile homes: $280,053Here:
$280,053State:
$124,413
Housing units in structures:
One, detached: 9,649One, attached: 457Two: 3573 or 4: 7915 to 9: 2,17110 to 19: 92120 to 49: 41250 or more: 1,581Mobile homes: 319Unemployment : 2.8%
Means of transportation to work in zip code 79707 75.3% 16,437 Drove a car alone12.6% 2,753 Carpooled0.1% 11 Bus or trolley bus0.3% 71 Bicycle0.5% 109 Walked1.8% 399 Other means7.7% 1,687 Worked at homeTravel time to work (commute) in zip code 79707 547 Less than 5 minutes2,635 5 to 9 minutes4,097 10 to 14 minutes4,425 15 to 19 minutes3,591 20 to 24 minutes584 25 to 29 minutes1,554 30 to 34 minutes325 35 to 39 minutes193 40 to 44 minutes683 45 to 59 minutes556 60 to 89 minutes538 90 or more minutes
Neighborhoods in zip code 79707: Percentage of zip code residents living and working in this county: 87.0%
Household type by relationship:
Households: 40,404
Male householders: 8,451 (2,706 living alone ), Female householders: 7,878 (2,098 living alone )9,359 spouses (9,336 opposite-sex spouses ), 1,028 unmarried partners , (1,028 opposite-sex unmarried partners ), 12,132 children (10,871 natural , 378 adopted , 886 stepchildren ), 260 grandchildren , 157 brothers or sisters , 210 parents , 0 foster children , 315 other relatives , 427 non-relatives In group quarters: 413 (-1 institutionalized population )
Size of family households: 4,306 2-persons , 2,399 3-persons , 2,412 4-persons , 942 5-persons , 440 6-persons , 116 7-or-more-persons
Size of nonfamily households: 4,805 1-person , 891 2-persons , 26 3-persons , 7 4-persons
8,573 married couples with children. single-parent households (402 men , 1,052 women ).
78.7% of residents of 79707 zip code speak English at home. of residents speak Spanish at home (80% very well, 9% well, 7% not well, 5% not at all ).of residents speak other Indo-European language at home (78% very well, 14% well, 8% not well ).of residents speak Asian or Pacific Island language at home (59% very well, 14% well, 13% not well, 14% not at all ).of residents speak other language at home (100% very well ).
Foreign born population: 4,253 (10.5%)
(47.3%
of them are naturalized citizens )
This zip code:
10.5%Whole state:
17.2%
26% Honduras 13% Burma (Myanmar) 8% Bhutan 5% Tanzania 3% Malaysia 3% Nigeria 3% Uruguay 11% English 8% German 7% American 5% Irish 2% European 1% Italian 1% Scottish
Year of entry for the foreign-born population
2,012 2010 or later 1,258 2000 to 2009 600 1990 to 1999 966 Before 1990
There are
79 Medical Specialists in Zip Code 79707 .
Facilities with environmental interests located in this zip code:
BARNEY GREATHOUSE SCH (5107 GREATHOUSE AVE in MIDLAND, TX)
(Geographic Names Information System) (National Center for Education Statistics) - STATE ID-165901128 Organizations: MIDLAND ISD (SCHOOL DISTRICT)
Housing units lacking complete plumbing facilities: 0.4%
Housing units lacking complete kitchen facilities: 1.5%
55.0% Electricity 43.5% Utility gas 1.0% Bottled, tank, or LP gas
Population in 1990: 22,810. Population change in the 1990s: +3,494 (+15.3%).
Place of birth for U.S.-born residents:
This state: 25,135Northeast: 536Midwest: 2,488South: 3,063West: 4,487
42% of the 79707 zip code residents lived in the same house 5 years ago.
Out of people who lived in different houses, 46% lived in this county.
Out of people who lived in different counties, 50% lived in Texas.
80% of the 79707 zip code residents lived in the same house 1 year ago.
Out of people who lived in different houses, 47% moved from this county.
Out of people who lived in different houses, 35% moved from different county within same state.
Out of people who lived in different houses, 13% moved from different state.
Out of people who lived in different houses, 3% moved from abroad.
Private vs. public school enrollment:
Students in private schools in grades 1 to 8 (elementary and middle school): 1,233
Students in private schools in grades 9 to 12 (high school): 508
Students in private undergraduate colleges: 309
Occupation by median earnings in the past 12 months ($)
121,350 Legal occupations 114,150 Architecture and engineering occupations 112,051 Management occupations 110,885 Life, physical, and social science occupations 100,395 Business and financial operations occupations 98,813 Computer and mathematical occupations
Companies with federal contracts located in this zip code:
VAUGHN DONALDSON (5306 GREEN TREE BLVD in MIDLAND, TX; small business) in 7 contracts from 2002 to 2006
Contracts for Other Education and Training Services, Lectures For Training, Education Services, Other Management Support Services by Army, U.S. Army Corps of Engineers - civil program financing only, Air ForceSigned by year: 2000: $0; 2001: $0; 2002: $3,805; 2003: $0; 2004: $20,596; 2005: $5,500; 2006: $2,925.
Biggest contracts: with Army for Other Education and Training Services. Taking place in KS. Signed on 2004-02-11. Completion date: 2004-02-24.
with U.S. Army Corps of Engineers - civil program financing only for Other Education and Training Services. Taking place in KS. Signed on 2004-02-11. Completion date: 2004-02-24.
with Army for Other Education and Training Services. Signed on 2004-09-22. Completion date: 2004-11-04.
with Army for Lectures For Training. Taking place in GA. Signed on 2002-10-31. Completion date: 2002-11-06.
Top industries in this zip code by the number of employees in 2005:
Accommodation and Food Services: Limited-Service Restaurants (50-99 employees: 3 establishments, 20-49 employees: 5 establishments, 10-19 employees: 3 establishments, 5-9 employees: 2 establishments, 1-4 employees: 1 establishment)Accommodation and Food Services: Full-Service Restaurants (50-99: 4, 10-19: 1, 5-9: 1, 1-4: 4)Health Care and Social Assistance: Continuing Care Retirement Communities (100-249: 1, 5-9: 1)Health Care and Social Assistance: Specialty (except Psychiatric and Substance Abuse) Hospitals (100-249: 1)Educational Services: Elementary and Secondary Schools (100-249: 1)Finance and Insurance: Commercial Banking (20-49: 3, 10-19: 1, 5-9: 3, 1-4: 1)
People in group quarters in 2010:
274 people in group homes intended for adults
86 people in nursing facilities/skilled-nursing facilities
23 people in mental (psychiatric) hospitals and psychiatric units in other hospitals
People in group quarters in 2000:
372 people in nursing homes
20 people in homes for the mentally retarded
13 people in other noninstitutional group quarters
Fatal accident statistics in 2014:
Fatal accident count: 5Vehicles involved in fatal accidents: 11Fatal accidents caused by drunken drivers: 2Fatalities: 5Persons involved in fatal accidents: 13Pedestrians involved in fatal accidents: 2
Fatal accident statistics in 2013:
Fatal accident count: 4Vehicles involved in fatal accidents: 7Fatal accidents caused by drunken drivers: 2Fatalities: 4Persons involved in fatal accidents: 10Pedestrians involved in fatal accidents: 1
Home Mortgage Disclosure Act Aggregated Statistics For Year 2009(Based on 6 full and 8 partial tracts) A) FHA, FSA/RHS & VA B) Conventional C) Refinancings D) Home Improvement Loans E) Loans on Dwellings For 5+ Families F) Non-occupant Loans on G) Loans On Manufactured Number Average Value Number Average Value Number Average Value Number Average Value Number Average Value Number Average Value Number Average Value
LOANS ORIGINATED 496 $176,750 593 $183,862 935 $175,807 92 $61,384 1 $415,500 70 $138,676 27 $69,709 APPLICATIONS APPROVED, NOT ACCEPTED 14 $151,511 30 $176,957 81 $174,311 5 $77,130 0 $0 8 $77,982 12 $79,110 APPLICATIONS DENIED 19 $184,122 39 $217,688 232 $168,604 69 $36,927 0 $0 13 $83,853 24 $72,398 APPLICATIONS WITHDRAWN 15 $175,641 21 $224,744 165 $188,183 24 $85,820 0 $0 6 $91,565 1 $70,750 FILES CLOSED FOR INCOMPLETENESS 3 $198,080 2 $71,650 38 $181,316 2 $68,170 0 $0 3 $60,287 4 $59,770
Aggregated Statistics For Year 2008(Based on 6 full and 8 partial tracts) A) FHA, FSA/RHS & VA B) Conventional C) Refinancings D) Home Improvement Loans E) Loans on Dwellings For 5+ Families F) Non-occupant Loans on G) Loans On Manufactured Number Average Value Number Average Value Number Average Value Number Average Value Number Average Value Number Average Value Number Average Value
LOANS ORIGINATED 322 $171,266 943 $192,881 428 $157,148 122 $45,207 3 $7,663,047 96 $163,336 40 $50,405 APPLICATIONS APPROVED, NOT ACCEPTED 21 $152,524 62 $170,508 59 $142,470 33 $47,936 0 $0 7 $90,414 25 $65,533 APPLICATIONS DENIED 29 $167,996 124 $127,037 221 $129,031 113 $54,832 0 $0 21 $116,078 41 $52,340 APPLICATIONS WITHDRAWN 8 $145,752 60 $165,245 166 $134,430 23 $85,849 0 $0 15 $182,069 0 $0 FILES CLOSED FOR INCOMPLETENESS 2 $49,510 19 $100,997 30 $125,900 9 $73,109 0 $0 10 $60,713 1 $34,690
Aggregated Statistics For Year 2007(Based on 6 full and 8 partial tracts) A) FHA, FSA/RHS & VA B) Conventional C) Refinancings D) Home Improvement Loans E) Loans on Dwellings For 5+ Families F) Non-occupant Loans on G) Loans On Manufactured Number Average Value Number Average Value Number Average Value Number Average Value Number Average Value Number Average Value Number Average Value
LOANS ORIGINATED 100 $160,733 1,425 $160,509 463 $151,866 150 $51,839 4 $5,728,800 114 $110,770 44 $47,281 APPLICATIONS APPROVED, NOT ACCEPTED 7 $114,453 101 $115,358 66 $134,658 28 $57,017 0 $0 6 $181,460 31 $48,825 APPLICATIONS DENIED 6 $133,338 175 $132,471 240 $145,176 152 $49,779 17 $4,525,088 23 $80,301 46 $45,430 APPLICATIONS WITHDRAWN 5 $151,548 68 $152,278 199 $116,283 32 $62,909 0 $0 5 $99,630 1 $67,270 FILES CLOSED FOR INCOMPLETENESS 2 $115,000 23 $171,698 67 $137,783 9 $57,741 0 $0 0 $0 0 $0
Aggregated Statistics For Year 2006(Based on 6 full and 8 partial tracts) A) FHA, FSA/RHS & VA B) Conventional C) Refinancings D) Home Improvement Loans E) Loans on Dwellings For 5+ Families F) Non-occupant Loans on G) Loans On Manufactured Number Average Value Number Average Value Number Average Value Number Average Value Number Average Value Number Average Value Number Average Value
LOANS ORIGINATED 128 $134,459 1,614 $133,362 376 $122,617 115 $34,962 10 $2,480,183 172 $92,190 25 $39,572 APPLICATIONS APPROVED, NOT ACCEPTED 2 $137,200 159 $103,558 50 $103,899 25 $34,749 0 $0 5 $102,538 22 $36,887 APPLICATIONS DENIED 6 $107,643 189 $100,595 258 $109,281 124 $34,173 0 $0 17 $69,166 43 $39,970 APPLICATIONS WITHDRAWN 1 $30,170 113 $111,640 191 $120,388 33 $58,595 1 $16,071,000 9 $83,547 4 $30,248 FILES CLOSED FOR INCOMPLETENESS 0 $0 14 $207,446 107 $121,695 5 $59,642 0 $0 4 $116,632 0 $0
Aggregated Statistics For Year 2005(Based on 6 full and 8 partial tracts) A) FHA, FSA/RHS & VA B) Conventional C) Refinancings D) Home Improvement Loans E) Loans on Dwellings For 5+ Families F) Non-occupant Loans on G) Loans On Manufactured Number Average Value Number Average Value Number Average Value Number Average Value Number Average Value Number Average Value Number Average Value
LOANS ORIGINATED 141 $112,470 1,365 $114,719 419 $108,469 73 $82,900 4 $2,081,500 76 $93,268 19 $39,858 APPLICATIONS APPROVED, NOT ACCEPTED 5 $95,258 125 $92,168 78 $118,578 18 $47,274 0 $0 5 $389,092 20 $35,345 APPLICATIONS DENIED 6 $85,743 143 $79,649 311 $97,988 95 $30,705 0 $0 15 $50,647 44 $37,629 APPLICATIONS WITHDRAWN 7 $93,193 108 $124,666 213 $120,611 60 $208,047 0 $0 22 $109,493 4 $34,360 FILES CLOSED FOR INCOMPLETENESS 0 $0 27 $135,631 112 $112,398 5 $650,756 0 $0 4 $81,020 1 $48,710
Aggregated Statistics For Year 2004(Based on 6 full and 8 partial tracts) A) FHA, FSA/RHS & VA B) Conventional C) Refinancings D) Home Improvement Loans E) Loans on Dwellings For 5+ Families F) Non-occupant Loans on G) Loans On Manufactured Number Average Value Number Average Value Number Average Value Number Average Value Number Average Value Number Average Value Number Average Value
LOANS ORIGINATED 185 $92,891 1,036 $111,644 603 $97,349 81 $49,224 2 $1,110,000 95 $87,709 26 $43,156 APPLICATIONS APPROVED, NOT ACCEPTED 8 $102,954 95 $92,729 100 $82,214 18 $33,187 0 $0 9 $47,202 25 $43,510 APPLICATIONS DENIED 6 $81,998 124 $80,315 394 $94,129 108 $38,968 2 $32,125 38 $66,589 52 $35,960 APPLICATIONS WITHDRAWN 17 $91,244 84 $101,228 227 $102,264 17 $26,965 3 $1,433,960 15 $58,938 2 $52,040 FILES CLOSED FOR INCOMPLETENESS 3 $89,267 15 $99,435 89 $100,711 3 $35,260 0 $0 1 $84,000 0 $0
Aggregated Statistics For Year 2003(Based on 6 full and 8 partial tracts) A) FHA, FSA/RHS & VA B) Conventional C) Refinancings D) Home Improvement Loans E) Loans on Dwellings For 5+ Families F) Non-occupant Loans on Number Average Value Number Average Value Number Average Value Number Average Value Number Average Value Number Average Value
LOANS ORIGINATED 214 $89,024 839 $110,446 1,624 $96,204 67 $37,097 1 $86,730 91 $102,677 APPLICATIONS APPROVED, NOT ACCEPTED 14 $91,579 81 $94,718 153 $99,548 13 $18,599 0 $0 9 $103,317 APPLICATIONS DENIED 25 $69,230 117 $63,699 461 $83,004 61 $26,215 0 $0 17 $75,838 APPLICATIONS WITHDRAWN 6 $86,018 45 $108,345 313 $91,000 5 $16,464 0 $0 2 $37,745 FILES CLOSED FOR INCOMPLETENESS 3 $82,987 17 $76,692 48 $100,661 4 $53,462 0 $0 0 $0
Aggregated Statistics For Year 2002(Based on 6 full and 6 partial tracts) A) FHA, FSA/RHS & VA B) Conventional C) Refinancings D) Home Improvement Loans E) Loans on Dwellings For 5+ Families F) Non-occupant Loans on Number Average Value Number Average Value Number Average Value Number Average Value Number Average Value Number Average Value
LOANS ORIGINATED 239 $86,827 566 $93,267 832 $93,452 49 $20,749 5 $3,185,600 82 $68,839 APPLICATIONS APPROVED, NOT ACCEPTED 8 $77,945 53 $65,251 117 $69,907 11 $18,768 0 $0 4 $68,308 APPLICATIONS DENIED 12 $103,624 100 $81,961 217 $78,976 39 $26,024 3 $856,640 4 $61,215 APPLICATIONS WITHDRAWN 20 $84,734 45 $86,568 103 $94,043 2 $11,760 0 $0 2 $101,000 FILES CLOSED FOR INCOMPLETENESS 4 $107,510 15 $99,147 28 $70,716 0 $0 0 $0 1 $36,000
Aggregated Statistics For Year 2001(Based on 6 full and 6 partial tracts) A) FHA, FSA/RHS & VA B) Conventional C) Refinancings D) Home Improvement Loans E) Loans on Dwellings For 5+ Families F) Non-occupant Loans on Number Average Value Number Average Value Number Average Value Number Average Value Number Average Value Number Average Value
LOANS ORIGINATED 250 $82,992 450 $93,953 406 $93,557 38 $22,681 0 $0 50 $63,079 APPLICATIONS APPROVED, NOT ACCEPTED 10 $80,179 50 $62,547 66 $60,756 15 $14,256 0 $0 7 $43,283 APPLICATIONS DENIED 15 $82,157 103 $56,852 118 $59,320 30 $12,325 1 $22,000,000 19 $63,950 APPLICATIONS WITHDRAWN 4 $93,420 29 $84,018 89 $75,753 6 $8,082 0 $0 5 $98,844 FILES CLOSED FOR INCOMPLETENESS 1 $111,290 5 $99,786 24 $81,437 2 $8,835 0 $0 2 $52,200
Aggregated Statistics For Year 2000(Based on 6 full and 6 partial tracts) A) FHA, FSA/RHS & VA B) Conventional C) Refinancings D) Home Improvement Loans E) Loans on Dwellings For 5+ Families F) Non-occupant Loans on Number Average Value Number Average Value Number Average Value Number Average Value Number Average Value Number Average Value
LOANS ORIGINATED 210 $82,143 461 $91,352 98 $63,878 45 $12,336 3 $7,505,000 19 $88,179 APPLICATIONS APPROVED, NOT ACCEPTED 3 $54,320 43 $58,231 20 $81,755 10 $18,155 0 $0 7 $33,351 APPLICATIONS DENIED 12 $64,352 103 $54,556 69 $60,365 24 $10,071 0 $0 7 $26,859 APPLICATIONS WITHDRAWN 9 $68,772 43 $75,408 34 $67,912 4 $26,232 0 $0 2 $46,600 FILES CLOSED FOR INCOMPLETENESS 2 $120,380 4 $71,085 16 $83,156 1 $30,000 0 $0 0 $0
Aggregated Statistics For Year 1999(Based on 3 full and 4 partial tracts) A) FHA, FSA/RHS & VA B) Conventional C) Refinancings D) Home Improvement Loans E) Loans on Dwellings For 5+ Families F) Non-occupant Loans on Number Average Value Number Average Value Number Average Value Number Average Value Number Average Value Number Average Value
LOANS ORIGINATED 137 $80,746 201 $90,706 174 $76,196 27 $21,179 2 $2,603,750 15 $44,165 APPLICATIONS APPROVED, NOT ACCEPTED 1 $116,070 50 $61,992 40 $59,344 7 $24,010 0 $0 7 $66,249 APPLICATIONS DENIED 8 $78,775 146 $42,574 54 $62,734 21 $19,052 1 $1,174,500 8 $48,639 APPLICATIONS WITHDRAWN 1 $101,180 20 $98,639 48 $71,112 2 $17,000 0 $0 5 $43,876 FILES CLOSED FOR INCOMPLETENESS 0 $0 1 $19,000 15 $65,150 2 $15,735 0 $0 2 $18,790
Private Mortgage Insurance Companies Aggregated Statistics For Year 2009(Based on 6 full and 8 partial tracts) A) Conventional B) Refinancings C) Non-occupant Loans on Number Average Value Number Average Value Number Average Value
LOANS ORIGINATED 92 $229,162 34 $220,594 0 $0 APPLICATIONS APPROVED, NOT ACCEPTED 27 $233,498 11 $218,795 0 $0 APPLICATIONS DENIED 6 $281,940 6 $223,722 0 $0 APPLICATIONS WITHDRAWN 4 $281,518 1 $353,670 1 $266,000 FILES CLOSED FOR INCOMPLETENESS 0 $0 0 $0 0 $0
Aggregated Statistics For Year 2008(Based on 6 full and 8 partial tracts) A) Conventional B) Refinancings C) Non-occupant Loans on Number Average Value Number Average Value Number Average Value
LOANS ORIGINATED 298 $206,462 22 $165,154 15 $163,671 APPLICATIONS APPROVED, NOT ACCEPTED 63 $207,441 5 $111,760 1 $280,000 APPLICATIONS DENIED 13 $213,223 0 $0 3 $210,507 APPLICATIONS WITHDRAWN 6 $237,443 0 $0 1 $309,000 FILES CLOSED FOR INCOMPLETENESS 4 $136,220 1 $163,230 0 $0
Aggregated Statistics For Year 2007(Based on 6 full and 8 partial tracts) A) Conventional B) Refinancings C) Non-occupant Loans on D) Loans On Manufactured Number Average Value Number Average Value Number Average Value Number Average Value
LOANS ORIGINATED 404 $181,022 14 $249,879 26 $135,221 1 $81,190 APPLICATIONS APPROVED, NOT ACCEPTED 49 $186,444 3 $446,667 3 $92,167 0 $0 APPLICATIONS DENIED 1 $55,670 0 $0 0 $0 0 $0 APPLICATIONS WITHDRAWN 9 $167,479 0 $0 0 $0 0 $0 FILES CLOSED FOR INCOMPLETENESS 1 $170,450 1 $124,000 0 $0 0 $0
Aggregated Statistics For Year 2006(Based on 6 full and 8 partial tracts) A) Conventional B) Refinancings C) Non-occupant Loans on D) Loans On Manufactured Number Average Value Number Average Value Number Average Value Number Average Value
LOANS ORIGINATED 315 $153,360 10 $194,787 18 $109,494 1 $28,660 APPLICATIONS APPROVED, NOT ACCEPTED 71 $145,646 9 $147,432 2 $86,240 0 $0 APPLICATIONS DENIED 2 $219,780 0 $0 0 $0 0 $0 APPLICATIONS WITHDRAWN 9 $128,224 0 $0 2 $59,780 0 $0 FILES CLOSED FOR INCOMPLETENESS 0 $0 0 $0 0 $0 0 $0
Aggregated Statistics For Year 2005(Based on 6 full and 8 partial tracts) A) Conventional B) Refinancings C) Non-occupant Loans on Number Average Value Number Average Value Number Average Value
LOANS ORIGINATED 317 $131,239 43 $116,874 22 $84,195 APPLICATIONS APPROVED, NOT ACCEPTED 31 $139,107 8 $114,258 7 $59,869 APPLICATIONS DENIED 0 $0 0 $0 0 $0 APPLICATIONS WITHDRAWN 2 $111,270 2 $60,235 0 $0 FILES CLOSED FOR INCOMPLETENESS 2 $131,850 0 $0 0 $0
Aggregated Statistics For Year 2004(Based on 6 full and 8 partial tracts) A) Conventional B) Refinancings C) Non-occupant Loans on Number Average Value Number Average Value Number Average Value
LOANS ORIGINATED 244 $124,458 52 $108,455 7 $68,677 APPLICATIONS APPROVED, NOT ACCEPTED 28 $135,164 8 $96,799 3 $84,713 APPLICATIONS DENIED 0 $0 2 $84,000 0 $0 APPLICATIONS WITHDRAWN 3 $102,650 3 $88,187 0 $0 FILES CLOSED FOR INCOMPLETENESS 9 $121,401 4 $62,452 0 $0
Aggregated Statistics For Year 2003(Based on 6 full and 8 partial tracts) A) Conventional B) Refinancings C) Non-occupant Loans on Number Average Value Number Average Value Number Average Value
LOANS ORIGINATED 258 $121,862 189 $115,178 7 $76,890 APPLICATIONS APPROVED, NOT ACCEPTED 32 $126,674 46 $108,230 0 $0 APPLICATIONS DENIED 1 $169,410 0 $0 0 $0 APPLICATIONS WITHDRAWN 15 $131,791 2 $165,000 0 $0 FILES CLOSED FOR INCOMPLETENESS 0 $0 0 $0 0 $0
Aggregated Statistics For Year 2002(Based on 6 full and 6 partial tracts) A) Conventional B) Refinancings C) Non-occupant Loans on Number Average Value Number Average Value Number Average Value
LOANS ORIGINATED 193 $101,871 86 $92,050 0 $0 APPLICATIONS APPROVED, NOT ACCEPTED 16 $112,144 7 $105,964 0 $0 APPLICATIONS DENIED 0 $0 0 $0 0 $0 APPLICATIONS WITHDRAWN 10 $74,833 5 $91,858 1 $220,000 FILES CLOSED FOR INCOMPLETENESS 1 $71,000 0 $0 0 $0
Aggregated Statistics For Year 2001(Based on 6 full and 6 partial tracts) A) Conventional B) Refinancings C) Non-occupant Loans on Number Average Value Number Average Value Number Average Value
LOANS ORIGINATED 156 $109,238 44 $95,188 9 $76,492 APPLICATIONS APPROVED, NOT ACCEPTED 18 $94,364 9 $119,281 2 $40,180 APPLICATIONS DENIED 3 $140,333 0 $0 0 $0 APPLICATIONS WITHDRAWN 1 $167,000 0 $0 0 $0 FILES CLOSED FOR INCOMPLETENESS 0 $0 1 $141,000 0 $0
Aggregated Statistics For Year 2000(Based on 6 full and 6 partial tracts) A) Conventional B) Refinancings C) Non-occupant Loans on Number Average Value Number Average Value Number Average Value
LOANS ORIGINATED 140 $95,854 4 $83,952 3 $70,390 APPLICATIONS APPROVED, NOT ACCEPTED 6 $106,133 5 $110,730 2 $27,305 APPLICATIONS DENIED 2 $134,495 4 $119,408 0 $0 APPLICATIONS WITHDRAWN 3 $130,517 2 $27,305 2 $27,305 FILES CLOSED FOR INCOMPLETENESS 1 $144,000 0 $0 0 $0
Aggregated Statistics For Year 1999(Based on 3 full and 4 partial tracts) A) Conventional B) Refinancings C) Non-occupant Loans on Number Average Value Number Average Value Number Average Value
LOANS ORIGINATED 105 $98,242 33 $85,172 3 $58,893 APPLICATIONS APPROVED, NOT ACCEPTED 6 $117,190 3 $128,670 0 $0 APPLICATIONS DENIED 5 $53,598 0 $0 2 $10,510 APPLICATIONS WITHDRAWN 1 $92,000 2 $124,965 0 $0 FILES CLOSED FOR INCOMPLETENESS 0 $0 0 $0 0 $0
2004 - 2018 National Fire Incident Reporting System (NFIRS) incidents See full 2006 National Fire Incident Reporting System statistics for zip code 79707, Texas
Most common first names in zip code 79707 among deceased individuals Name Count Lived (average)
Mary 53 82.0 years James 51 73.8 years Robert 39 71.6 years William 39 76.0 years John 36 77.8 years Dorothy 27 76.7 years Charles 26 72.1 years Betty 24 73.4 years Ruth 22 78.7 years Margaret 20 85.2 years
Most common last names in zip code 79707 among deceased individuals Last name Count Lived (average)
Smith 30 80.4 years Jones 23 76.4 years Moore 17 74.5 years Williams 16 79.7 years Taylor 14 73.1 years Johnson 14 75.9 years Brown 13 77.9 years Davis 12 73.2 years Anderson 12 76.2 years Martin 11 79.7 years
Businesses in zip code 79707
Name Count Name Count
7-Eleven 4 Maurices 1 AMF Bowling 1 Mazda 1 AT&T 2 McDonald's 1 Academy Sports + Outdoors 1 Nissan 1 Arby's 1 On The Border 1 Ashley Furniture 1 Papa John's Pizza 1 Chick-Fil-A 1 Payless 1 Chuck E. Cheese's 1 PetSmart 1 Cinnabon 1 Pizza Hut 1 Cracker Barrel 1 SONIC Drive-In 1 FedEx 4 Sprint Nextel 1 GameStop 1 Staples 1 Hilton 1 Subway 1 Holiday Inn 1 T-Mobile 1 Home Depot 1 Taco Bell 1 Jack In The Box 1 Target 1 KFC 1 UPS 3 Kohl's 1 Verizon Wireless 1 La Quinta 1 Walgreens 1 Lane Bryant 1 Walmart 1 Lowe's 1 Wendy's 1 Marriott 1

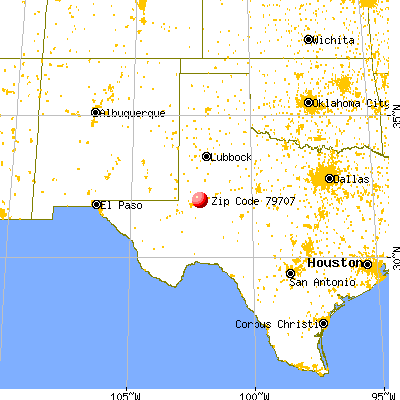


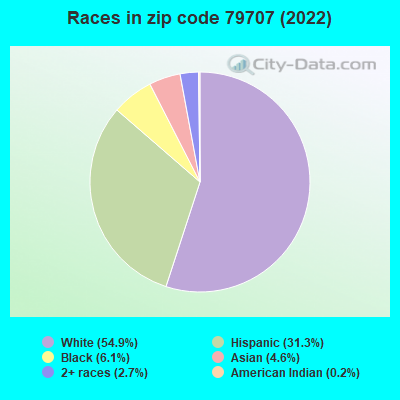


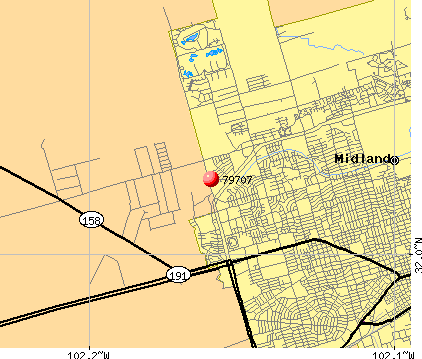 Nearest zip codes: 79703, 79701, 79705, 79758, 79765, 79762.
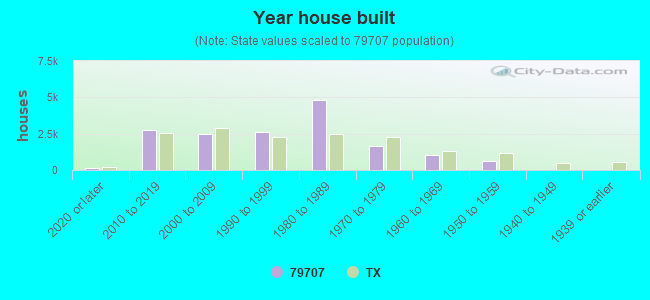

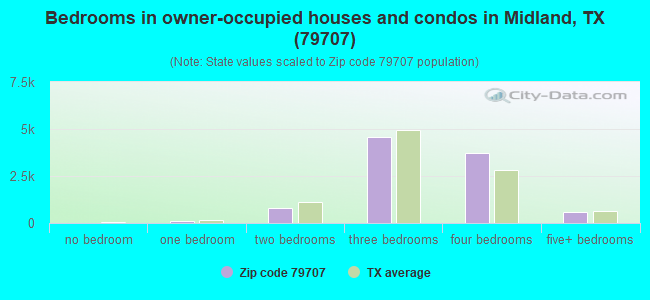
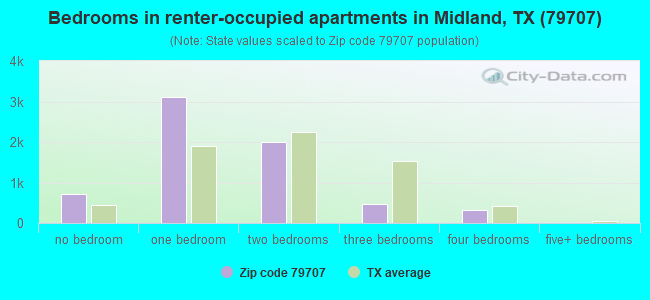
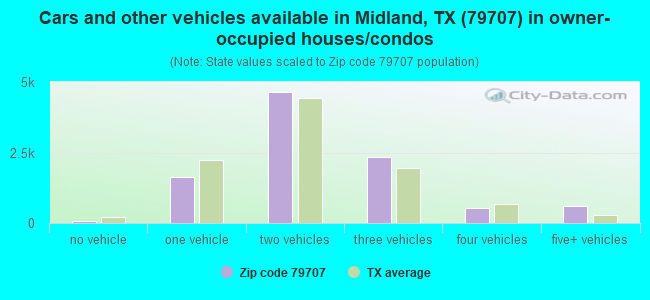
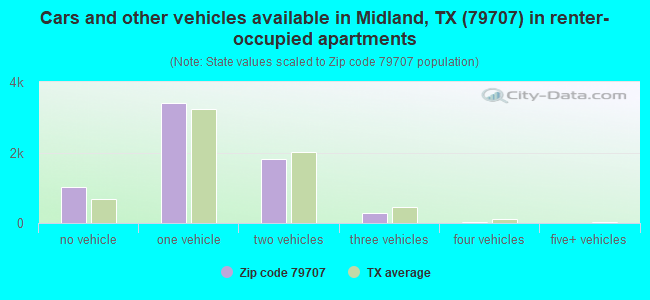


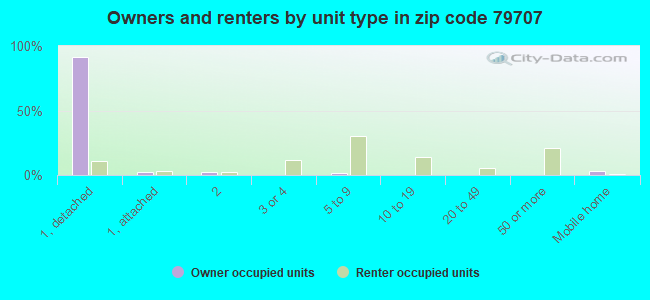
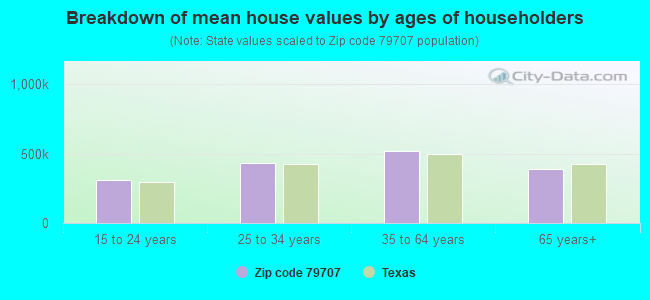


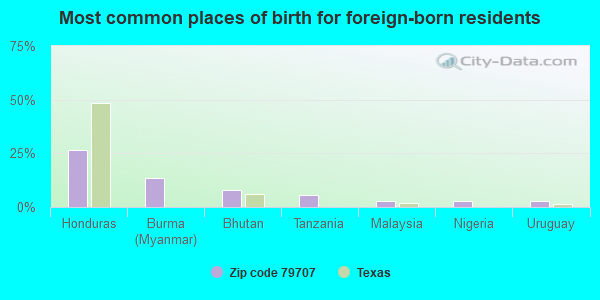
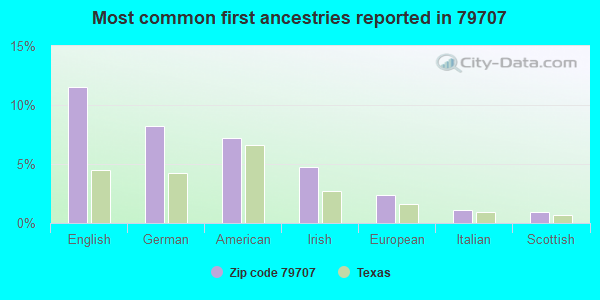
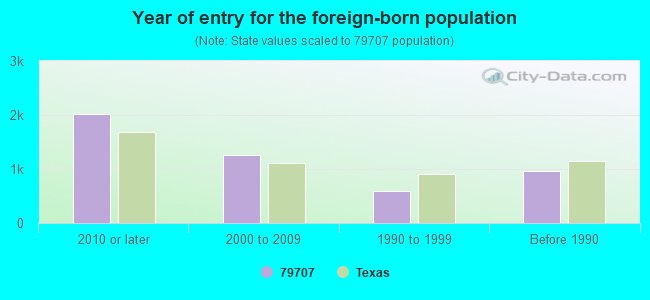


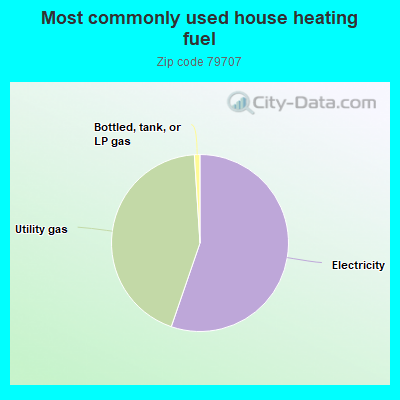
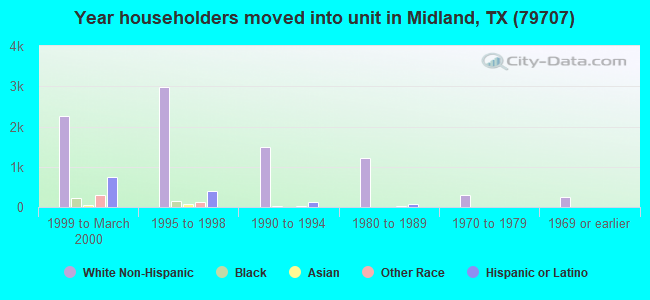
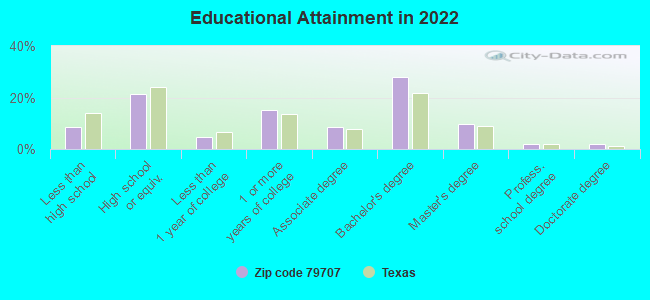
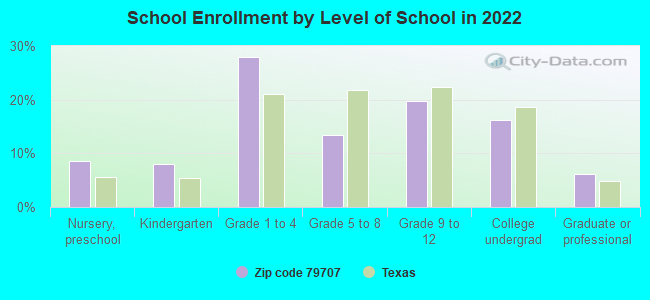
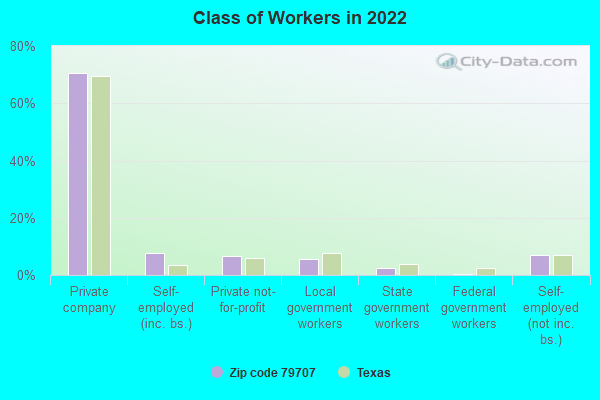
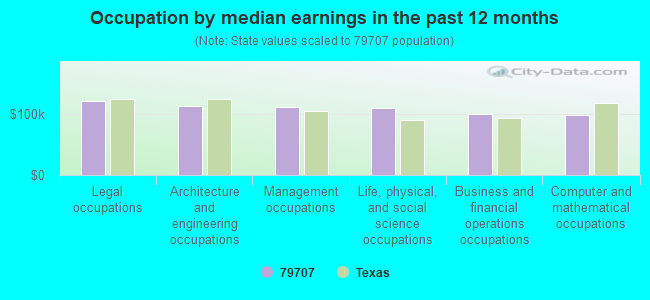
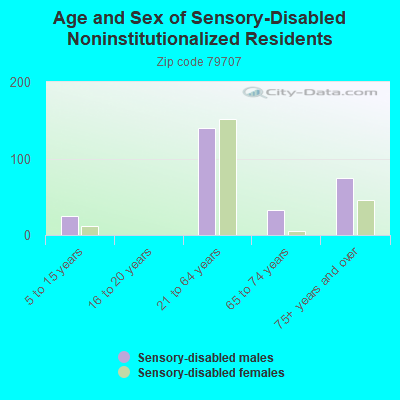
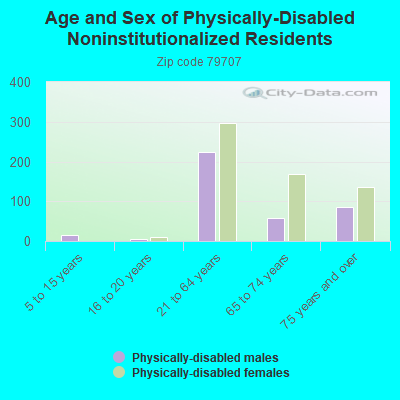
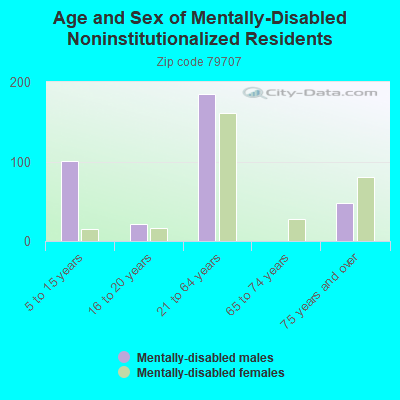
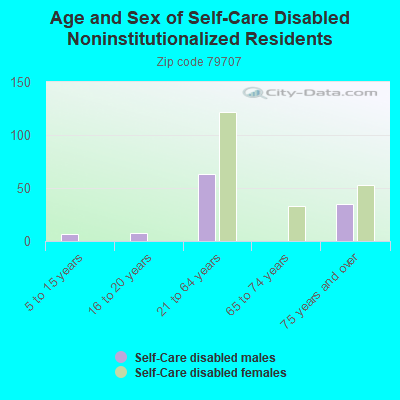
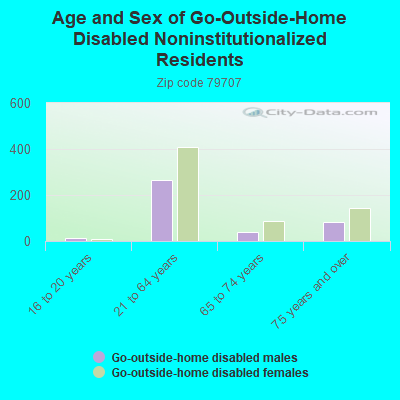
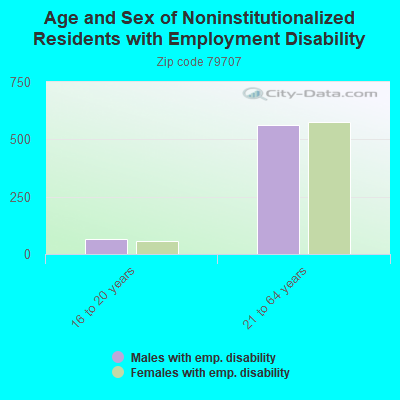
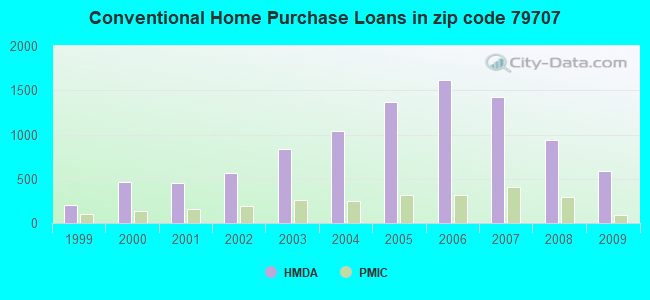
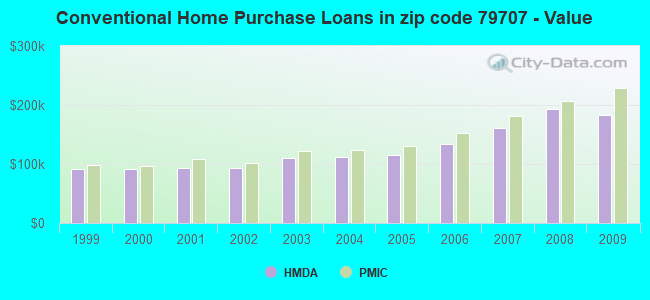
 According to the data from the years 2004 - 2018 the average number of fires per year is 52. The highest number of fires - 120 took place in 2011, and the least - 0 in 2009. The data has a decreasing trend.
 When looking into fire subcategories, the most reports belonged to: Outside Fires (52.1%), and Structure Fires (30.2%).