Races in Mount Pleasant, Michigan (MI) Detailed Stats
Data:
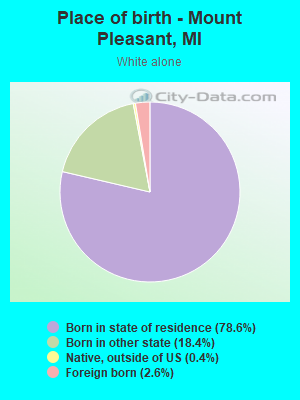
Races - White alone (%)
Races - White alone (% change since 2000)
Races - Black alone (%)
Races - Black alone (% change since 2000)
Races - American Indian alone (%)
Races - American Indian alone (% change since 2000)
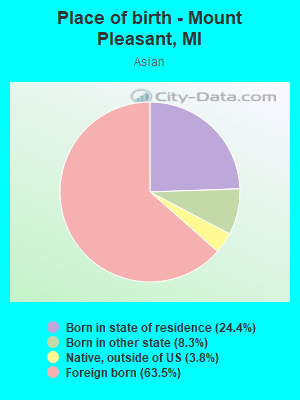
Races - Asian alone (%)
Races - Asian alone (% change since 2000)
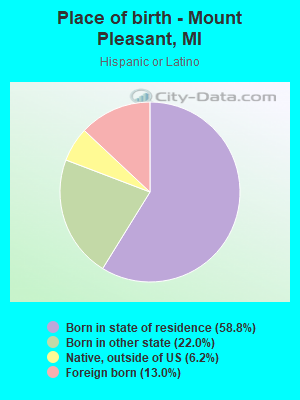
Races - Hispanic (%)
Races - Hispanic (% change since 2000)
Races - Native Hawaiian and Other Pacific Islander alone (%)
Races - Native Hawaiian and Other Pacific Islander alone (% change since 2000)
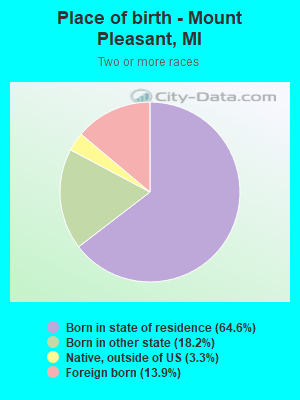
Races - Two or more races(%)
Races - Two or more races(% change since 2000)
Races - Other race alone (%)
Races - Other race alone (% change since 2000)
Racial diversity
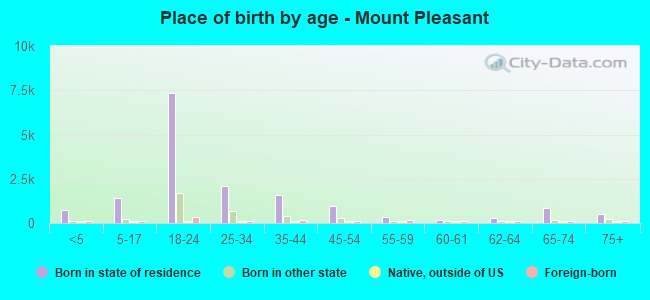
Place of birth - Born in state of residence (%)
Place of birth - Born in state of residence (%) - White
Place of birth - Born in state of residence (%) - Black or African American
Place of birth - Born in state of residence (%) - Asian
Place of birth - Born in state of residence (%) - Hispanic or Latino
Place of birth - Born in state of residence (%) - American Indian and Alaska Native
Place of birth - Born in state of residence (%) - Multirace
Place of birth - Born in state of residence (%) - Other Race
Place of birth - Born in other state (%)
Place of birth - Born in other state (%) - White
Place of birth - Born in other state (%) - Black or African American
Place of birth - Born in other state (%) - Asian
Place of birth - Born in other state (%) - Hispanic or Latino
Place of birth - Born in other state (%) - American Indian and Alaska Native
Place of birth - Born in other state (%) - Multirace
Place of birth - Born in other state (%) - Other Race
Place of birth - Native, outside of US (%)
Place of birth - Native, outside of US (%) - White
Place of birth - Native, outside of US (%) - Black or African American
Place of birth - Native, outside of US (%) - Asian
Place of birth - Native, outside of US (%) - Hispanic or Latino
Place of birth - Native, outside of US (%) - American Indian and Alaska Native
Place of birth - Native, outside of US (%) - Multirace
Place of birth - Native, outside of US (%) - Other Race
Place of birth - Foreign born (%)
Place of birth - Foreign born (%) - White
Place of birth - Foreign born (%) - Black or African American
Place of birth - Foreign born (%) - Asian
Place of birth - Foreign born (%) - Hispanic or Latino
Place of birth - Foreign born (%) - American Indian and Alaska Native
Place of birth - Foreign born (%) - Multirace
Place of birth - Foreign born (%) - Other Race
Residents speaking English at home (%)
Residents speaking English at home - Born in the United States (%)
Residents speaking English at home - Native, born elsewhere (%)
Residents speaking English at home - Foreign born (%)
Residents speaking Spanish at home (%)
Residents speaking Spanish at home - Born in the United States (%)
Residents speaking Spanish at home - Native, born elsewhere (%)
Residents speaking Spanish at home - Foreign born (%)
Residents speaking other language at home (%)
Residents speaking other language at home - Born in the United States (%)
Residents speaking other language at home - Native, born elsewhere (%)
Residents speaking other language at home - Foreign born (%)
Marital status - Never married (%)
Marital status - Now married (%)
Marital status - Separated (%)
Marital status - Widowed (%)
Marital status - Divorced (%)
Ancestries Reported - Arab (%)
Ancestries Reported - Czech (%)
Ancestries Reported - Danish (%)
Ancestries Reported - Dutch (%)
Ancestries Reported - English (%)
Ancestries Reported - French (%)
Ancestries Reported - French Canadian (%)
Ancestries Reported - German (%)
Ancestries Reported - Greek (%)
Ancestries Reported - Hungarian (%)
Ancestries Reported - Irish (%)
Ancestries Reported - Italian (%)
Ancestries Reported - Lithuanian (%)
Ancestries Reported - Norwegian (%)
Ancestries Reported - Polish (%)
Ancestries Reported - Portuguese (%)
Ancestries Reported - Russian (%)
Ancestries Reported - Scotch-Irish (%)
Ancestries Reported - Scottish (%)
Ancestries Reported - Slovak (%)
Ancestries Reported - Subsaharan African (%)
Ancestries Reported - Swedish (%)
Ancestries Reported - Swiss (%)
Ancestries Reported - Ukrainian (%)
Ancestries Reported - United States (%)
Ancestries Reported - Welsh (%)
Ancestries Reported - West Indian (%)
Ancestries Reported - Other (%)
Geographical mobility - Same house 1 year ago (%)
Geographical mobility - Same house 1 year ago (%) - White
Geographical mobility - Same house 1 year ago (%) - Black or African American
Geographical mobility - Same house 1 year ago (%) - Asian
Geographical mobility - Same house 1 year ago (%) - Hispanic or Latino
Geographical mobility - Same house 1 year ago (%) - American Indian and Alaska Native
Geographical mobility - Same house 1 year ago (%) - Multirace
Geographical mobility - Same house 1 year ago (%) - Other Race
Geographical mobility - Moved within same county (%)
Geographical mobility - Moved within same county (%) - White
Geographical mobility - Moved within same county (%) - Black or African American
Geographical mobility - Moved within same county (%) - Asian
Geographical mobility - Moved within same county (%) - Hispanic or Latino
Geographical mobility - Moved within same county (%) - American Indian and Alaska Native
Geographical mobility - Moved within same county (%) - Multirace
Geographical mobility - Moved within same county (%) - Other Race
Geographical mobility - Moved from different county within same state (%)
Geographical mobility - Moved from different county within same state (%) - White
Geographical mobility - Moved from different county within same state (%) - Black or African American
Geographical mobility - Moved from different county within same state (%) - Asian
Geographical mobility - Moved from different county within same state (%) - Hispanic or Latino
Geographical mobility - Moved from different county within same state (%) - American Indian and Alaska Native
Geographical mobility - Moved from different county within same state (%) - Multirace
Geographical mobility - Moved from different county within same state (%) - Other Race
Geographical mobility - Moved from different state (%)
Geographical mobility - Moved from different state (%) - White
Geographical mobility - Moved from different state (%) - Black or African American
Geographical mobility - Moved from different state (%) - Asian
Geographical mobility - Moved from different state (%) - Hispanic or Latino
Geographical mobility - Moved from different state (%) - American Indian and Alaska Native
Geographical mobility - Moved from different state (%) - Multirace
Geographical mobility - Moved from different state (%) - Other Race
Geographical mobility - Moved from abroad (%)
Geographical mobility - Moved from abroad (%) - White
Geographical mobility - Moved from abroad (%) - Black or African American
Geographical mobility - Moved from abroad (%) - Asian
Geographical mobility - Moved from abroad (%) - Hispanic or Latino
Geographical mobility - Moved from abroad (%) - American Indian and Alaska Native
Geographical mobility - Moved from abroad (%) - Multirace
Geographical mobility - Moved from abroad (%) - Other Race
Place of birth for the foreign-born population - Ireland (%)
Place of birth for the foreign-born population - Denmark (%)
Place of birth for the foreign-born population - Norway (%)
Place of birth for the foreign-born population - Sweden (%)
Place of birth for the foreign-born population - United Kingdom (%)
Place of birth for the foreign-born population - England (%)
Place of birth for the foreign-born population - Scotland (%)
Place of birth for the foreign-born population - Other Northern Europe (%)
Place of birth for the foreign-born population - Austria (%)
Place of birth for the foreign-born population - Belgium (%)
Place of birth for the foreign-born population - France (%)
Place of birth for the foreign-born population - Germany (%)
Place of birth for the foreign-born population - Netherlands (%)
Place of birth for the foreign-born population - Switzerland (%)
Place of birth for the foreign-born population - Other Western Europe (%)
Place of birth for the foreign-born population - Greece (%)
Place of birth for the foreign-born population - Italy (%)
Place of birth for the foreign-born population - Portugal (%)
Place of birth for the foreign-born population - Spain (%)
Place of birth for the foreign-born population - Other Southern Europe (%)
Place of birth for the foreign-born population - Albania (%)
Place of birth for the foreign-born population - Belarus (%)
Place of birth for the foreign-born population - Bosnia and Herzegovina (%)
Place of birth for the foreign-born population - Bulgaria (%)
Place of birth for the foreign-born population - Croatia (%)
Place of birth for the foreign-born population - Czechoslovakia (%)
Place of birth for the foreign-born population - Hungary (%)
Place of birth for the foreign-born population - Latvia (%)
Place of birth for the foreign-born population - Lithuania (%)
Place of birth for the foreign-born population - North Macedonia (Macedonia) (%)
Place of birth for the foreign-born population - Moldova (%)
Place of birth for the foreign-born population - Poland (%)
Place of birth for the foreign-born population - Romania (%)
Place of birth for the foreign-born population - Russia (%)
Place of birth for the foreign-born population - Serbia (%)
Place of birth for the foreign-born population - Ukraine (%)
Place of birth for the foreign-born population - Other Eastern Europe (%)
Place of birth for the foreign-born population - China (%)
Place of birth for the foreign-born population - Hong Kong (%)
Place of birth for the foreign-born population - Taiwan (%)
Place of birth for the foreign-born population - Japan (%)
Place of birth for the foreign-born population - Korea (%)
Place of birth for the foreign-born population - Other Eastern Asia (%)
Place of birth for the foreign-born population - Afghanistan (%)
Place of birth for the foreign-born population - Bangladesh (%)
Place of birth for the foreign-born population - India (%)
Place of birth for the foreign-born population - Iran (%)
Place of birth for the foreign-born population - Kazakhstan (%)
Place of birth for the foreign-born population - Nepal (%)
Place of birth for the foreign-born population - Pakistan (%)
Place of birth for the foreign-born population - Sri Lanka (%)
Place of birth for the foreign-born population - Uzbekistan (%)
Place of birth for the foreign-born population - Other South Central Asia (%)
Place of birth for the foreign-born population - Burma (%)
Place of birth for the foreign-born population - Cambodia (%)
Place of birth for the foreign-born population - Indonesia (%)
Place of birth for the foreign-born population - Laos (%)
Place of birth for the foreign-born population - Malaysia (%)
Place of birth for the foreign-born population - Philippines (%)
Place of birth for the foreign-born population - Singapore (%)
Place of birth for the foreign-born population - Thailand (%)
Place of birth for the foreign-born population - Vietnam (%)
Place of birth for the foreign-born population - Other South Eastern Asia (%)
Place of birth for the foreign-born population - Armenia (%)
Place of birth for the foreign-born population - Iraq (%)
Place of birth for the foreign-born population - Israel (%)
Place of birth for the foreign-born population - Jordan (%)
Place of birth for the foreign-born population - Kuwait (%)
Place of birth for the foreign-born population - Lebanon (%)
Place of birth for the foreign-born population - Saudi Arabia (%)
Place of birth for the foreign-born population - Syria (%)
Place of birth for the foreign-born population - Turkey (%)
Place of birth for the foreign-born population - Yemen (%)
Place of birth for the foreign-born population - Other Western Asia (%)
Place of birth for the foreign-born population - Eritrea (%)
Place of birth for the foreign-born population - Ethiopia (%)
Place of birth for the foreign-born population - Kenya (%)
Place of birth for the foreign-born population - Somalia (%)
Place of birth for the foreign-born population - Uganda (%)
Place of birth for the foreign-born population - Zimbabwe (%)
Place of birth for the foreign-born population - Other Eastern Africa (%)
Place of birth for the foreign-born population - Cameroon (%)
Place of birth for the foreign-born population - Congo (%)
Place of birth for the foreign-born population - Democratic Republic of Congo (Zaire) (%)
Place of birth for the foreign-born population - Other Middle Africa (%)
Place of birth for the foreign-born population - Egypt (%)
Place of birth for the foreign-born population - Morocco (%)
Place of birth for the foreign-born population - Sudan (%)
Place of birth for the foreign-born population - Other Northern Africa (%)
Place of birth for the foreign-born population - South Africa (%)
Place of birth for the foreign-born population - Other Southern Africa (%)
Place of birth for the foreign-born population - Cabo Verde (%)
Place of birth for the foreign-born population - Ghana (%)
Place of birth for the foreign-born population - Liberia (%)
Place of birth for the foreign-born population - Nigeria (%)
Place of birth for the foreign-born population - Senegal (%)
Place of birth for the foreign-born population - Sierra Leone (%)
Place of birth for the foreign-born population - Other Western Africa (%)
Place of birth for the foreign-born population - Australia (%)
Place of birth for the foreign-born population - New Zealand (%)
Place of birth for the foreign-born population - Fiji (%)
Place of birth for the foreign-born population - Micronesia (%)
Place of birth for the foreign-born population - Bahamas (%)
Place of birth for the foreign-born population - Barbados (%)
Place of birth for the foreign-born population - Cuba (%)
Place of birth for the foreign-born population - Dominica (%)
Place of birth for the foreign-born population - Dominican Republic (%)
Place of birth for the foreign-born population - Grenada (%)
Place of birth for the foreign-born population - Haiti (%)
Place of birth for the foreign-born population - Jamaica (%)
Place of birth for the foreign-born population - St. Vincent and the Grenadines (%)
Place of birth for the foreign-born population - Trinidad and Tobago (%)
Place of birth for the foreign-born population - West Indies (%)
Place of birth for the foreign-born population - Other Caribbean (%)
Place of birth for the foreign-born population - Belize (%)
Place of birth for the foreign-born population - Costa Rica (%)
Place of birth for the foreign-born population - El Salvador (%)
Place of birth for the foreign-born population - Guatemala (%)
Place of birth for the foreign-born population - Honduras (%)
Place of birth for the foreign-born population - Mexico (%)
Place of birth for the foreign-born population - Nicaragua (%)
Place of birth for the foreign-born population - Panama (%)
Place of birth for the foreign-born population - Other Central America (%)
Place of birth for the foreign-born population - Argentina (%)
Place of birth for the foreign-born population - Bolivia (%)
Place of birth for the foreign-born population - Brazil (%)
Place of birth for the foreign-born population - Chile (%)
Place of birth for the foreign-born population - Colombia (%)
Place of birth for the foreign-born population - Ecuador (%)
Place of birth for the foreign-born population - Guyana (%)
Place of birth for the foreign-born population - Peru (%)
Place of birth for the foreign-born population - Uruguay (%)
Place of birth for the foreign-born population - Venezuela (%)
Place of birth for the foreign-born population - Other South America (%)
Place of birth for the foreign-born population - Canada (%)
Place of birth for the foreign-born population - Other Northern America (%)
Place of birth for the foreign-born population - Other (%)
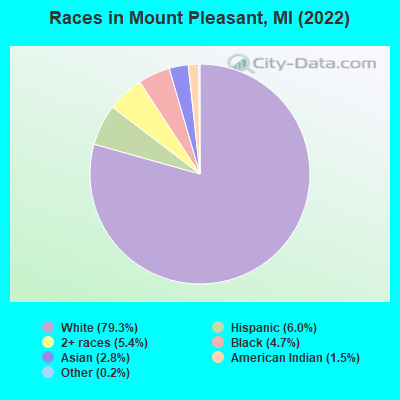
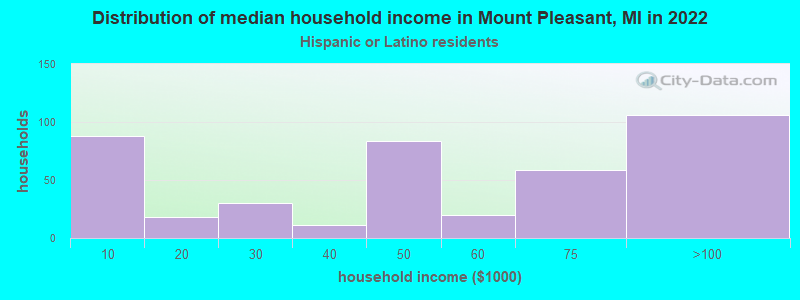
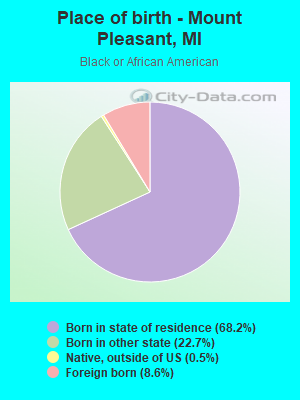
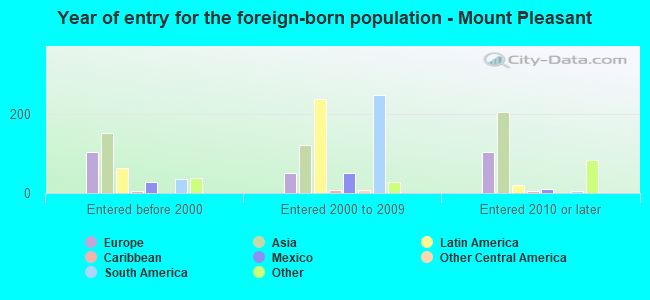
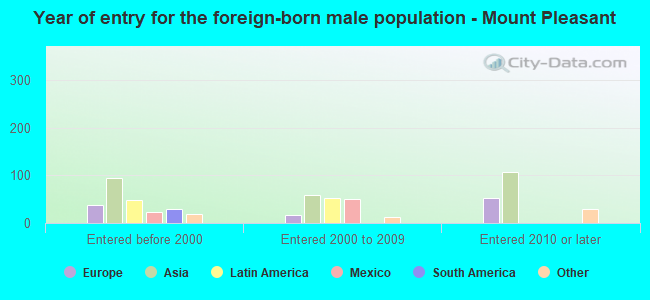
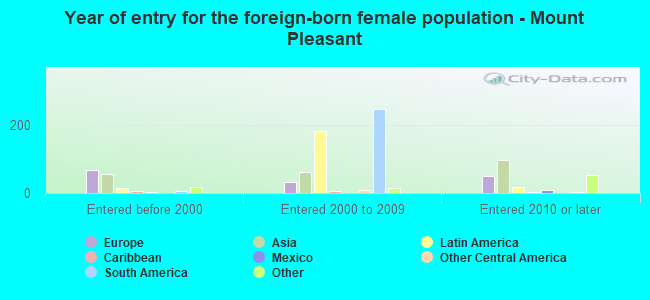
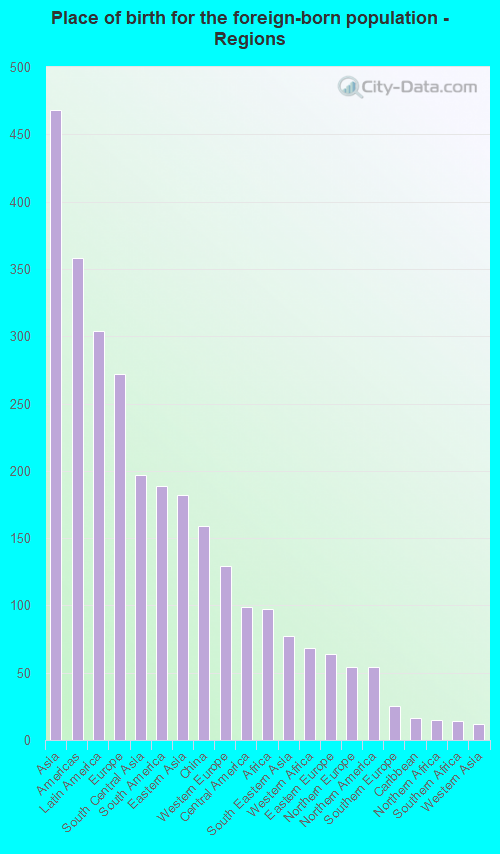
According to 2022 data, the most numerous races in Mount Pleasant, MI are White alone (17,270 residents), Black alone (1,023 residents), and Hispanic (1,309 residents). 92.1% of Mount Pleasant residents speak English at home. 5.5% of Mount Pleasant, MI residents are foreign-born (2.1% born in Asia, 1.4% born in Latin America, 1.2% born in Europe), which is 9.3% less than the foreign-born rate of 6.0% across the entire state of Michigan.
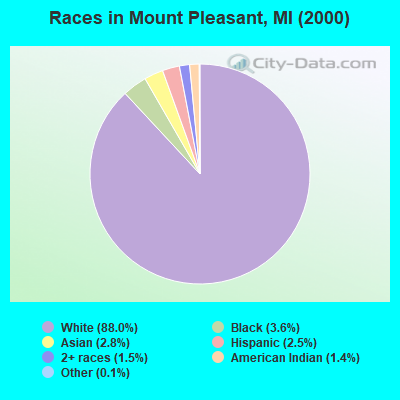
Race distribution in Mount Pleasant
2000 2022
7,806,691 78.6% White alone 1,402,047 14.1% Black alone 323,877 3.3% Hispanic 175,311 1.8% Asian alone 163,487 1.6% Two or more races 53,421 0.5% American Indian alone 11,465 0.1% Other race alone 2,145 0.02% Native Hawaiian and Other
7,289,051 72.6% White alone 1,310,464 13.1% Black alone 572,405 5.7% Hispanic 450,031 4.5% Two or more races 335,732 3.3% Asian alone 45,217 0.5% Other race alone 29,011 0.3% American Indian alone 2,207 0.02% Native Hawaiian and Other
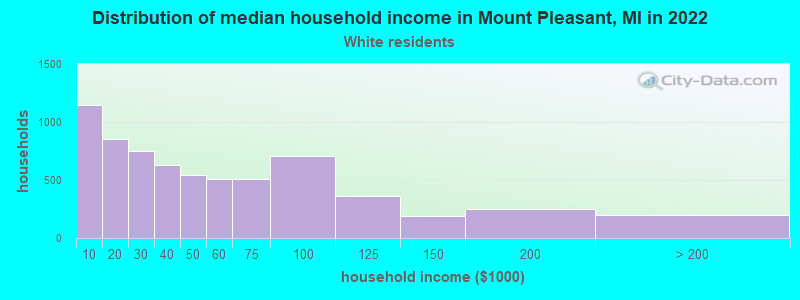
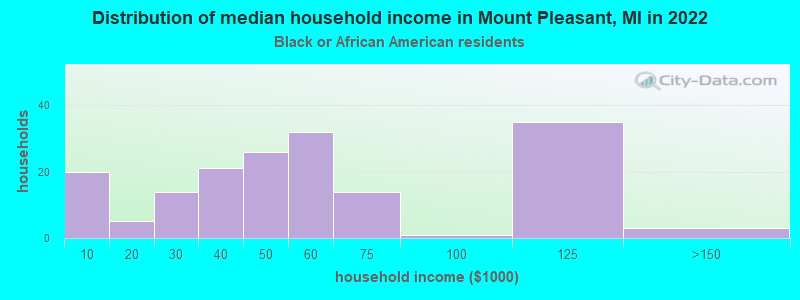
Income and house value in Mount Pleasant Median household income in 2022 $37,839 White non-Hispanic householders$49,076 Black householders$46,797 American Indian and Alaska Native householders$65,288 Asian householders$46,876 Two or more races householders$49,425 Hispanic or Latino race householdersMedian 2022 house value $180,959 White Non-Hispanic householders$199,778 Black or African American householders$154,538 American Indian or Alaska Native householders $300,902 Asian householders$195,976 Some other race householders$171,075 Two or more races householders$167,844 Hispanic or Latino householders
Median age by race in Mount Pleasant
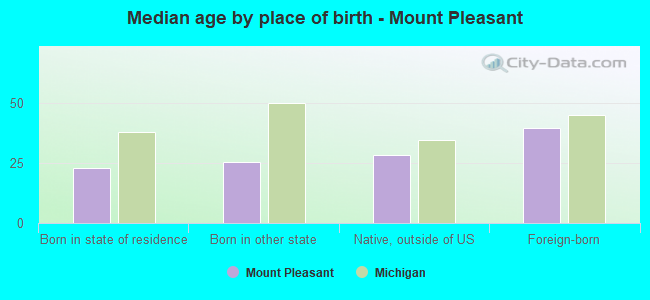
23.1 Median age for White residents24.0 22.4 20.3 Median age for Black or African American residents20.9 20.1 36.2 Median age for American Indian / Alaska Native residents33.8 38.0 28.6 Median age for Asian residents26.5 30.3 -670,531,400.3 Median age for Native Hawaiian / Pacific Islander residents-674,772,035.8 -699,588,476.7 23.6 Median age for Other race residents27.2 22.9 27.1 Median age for Two or more races residents30.8 23.5 23.1 Median age for White alone residents23.7 22.3 22.3 Median age for Hispanic or Latino residents31.3 20.5
Owner/renter occupied households by race in Mount Pleasant
House owners and renters - White residents 2,371 36.9% Owner occupied4,047 63.1% Renter occupiedHouse owners and renters - Black or African American residents 7 4.3% Owner occupied161 95.7% Renter occupiedHouse owners and renters - American Indian / Alaska Native residents 71 35.9% Owner occupied127 64.1% Renter occupiedHouse owners and renters - Asian residents 121 49.0% Owner occupied126 51.0% Renter occupiedHouse owners and renters - Other race residents 49 38.8% Owner occupied77 61.2% Renter occupiedHouse owners and renters - Two or more races residents 269 42.1% Owner occupied370 57.9% Renter occupiedHouse owners and renters - White alone residents 2,356 37.4% Owner occupied3,941 62.6% Renter occupiedHouse owners and renters - Hispanic or Latino residents 100 24.5% Owner occupied306 75.5% Renter occupied
Language usage in Mount Pleasant
English speakers - Total 92.1% of residents of Mount Pleasant speak English at home.
2.6% of residents speak Spanish at home 385 70.8% Speak English very well159 29.2% Speak English less than very well5.2% of residents speak other language at home 839 76.8% Speak English very well254 23.2% Speak English less than very well
English speakers - Born in the United States 94.2% of residents of Mount Pleasant speak English at home.
3.4% of residents speak Spanish at home 108 80.6% Speak English very well26 19.4% Speak English less than very well2.3% of residents speak other language at home 91 100.0% Speak English very well
English speakers - Native, born elsewhere 68.9% of residents of Mount Pleasant speak English at home.
15.3% of residents speak Spanish at home 29 100.0% Speak English very well17.4% of residents speak other language at home 33 100.0% Speak English very well
English speakers - Foreign-born 21.2% of residents of Mount Pleasant speak English at home.
16.9% of residents speak Spanish at home 95 47.0% Speak English very well107 53.0% Speak English less than very well61.2% of residents speak other language at home 493 67.3% Speak English very well239 32.7% Speak English less than very well
White (Caucasian) - Speak only English Native:
98.7% (16,333)Foreign-born:
28.4% (143)
White (Caucasian) - Speak another language Native:
1.4% (231)Foreign-born:
71.6% (361)
Black or African American - Speak only English Native:
99.5% (879)Foreign-born:
31.0% (28)
Black or African American - Speak another language Native:
0.6% (5)Foreign-born:
69.0% (63)
Asian - Speak only English Native:
43.4% (97)Foreign-born:
18.4% (72)
Asian - Speak another language Native:
57.0% (127)Foreign-born:
81.3% (320)
Other race - Speak another language Native:
34.2% (167)Foreign-born:
100.0% (5)
Two or more races - Speak only English Native:
85.5% (1,145)Foreign-born:
4.1% (9)
Two or more races - Speak another language Native:
14.7% (196)Foreign-born:
97.8% (221)
White alone - Speak only English Native:
98.6% (16,054)Foreign-born:
30.9% (138)
White alone - Speak another language Native:
1.3% (219)Foreign-born:
68.6% (307)
Hispanic or Latino - Speak only English Native:
74.2% (788)Foreign-born:
8.7% (15)
Hispanic or Latino - Speak another language Native:
25.7% (273)Foreign-born:
91.4% (156)
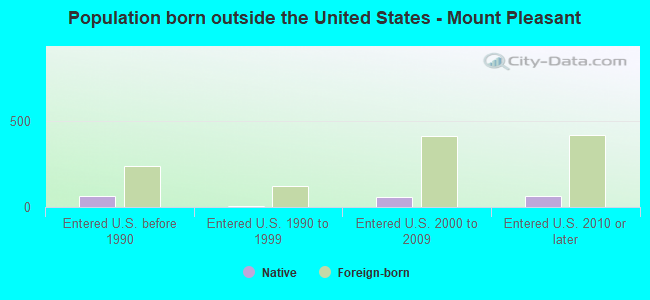
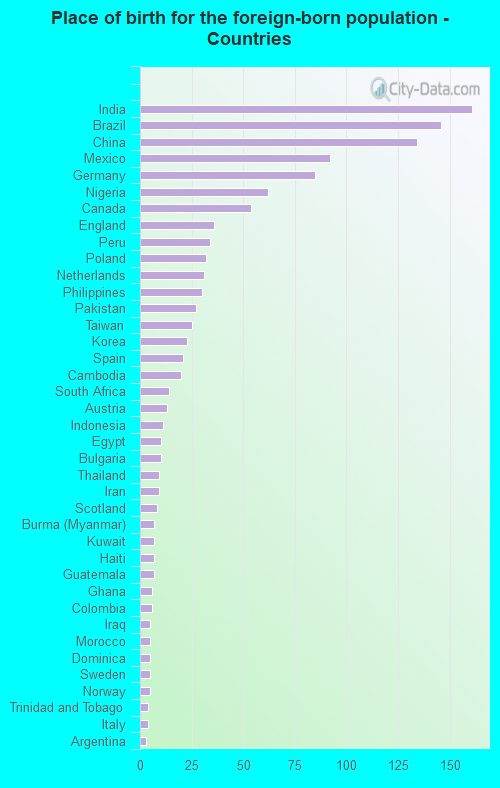
Foreign-born residents in Mount Pleasant 1,195 residents are foreign born (2.1% Asia , 1.4% Latin America , 1.2% Europe ).
This city:
5.5%Michigan:
6.9%
Marital status for residents in Mount Pleasant Marital status - White (Caucasian) population 15 years and over
Males 68.5% Never married22.9% Now married0.4% Separated1.3% Widowed6.9% DivorcedFemales 64.5% Never married19.9% Now married0.8% Separated4.2% Widowed10.7% DivorcedWomen who gave birth in the past 12 months Now married:
60.7% (117)Unmarried:
39.3% (76)
Women who did not give birth in the past 12 months Now married:
16.4% (1,073)Unmarried:
83.6% (5,460)
Marital status - Black or African American population 15 years and over
Males 75.0% Never married20.8% Now married1.0% Separated0.2% Widowed3.0% DivorcedFemales 74.3% Never married20.0% Now married1.0% Separated4.0% Widowed0.7% DivorcedWomen who did not give birth in the past 12 months Now married:
16.2% (55)Unmarried:
83.8% (285)
Marital status - American Indian / Alaska Native population 15 years and over
Males 56.8% Never married21.8% Now married0.0% Separated1.9% Widowed19.4% DivorcedFemales 32.3% Never married12.3% Now married0.0% Separated3.9% Widowed51.6% DivorcedWomen who gave birth in the past 12 months Now married:
100.0% (8)Unmarried:
0.0% (0)
Women who did not give birth in the past 12 months Now married:
7.2% (5)Unmarried:
92.8% (66)
Marital status - Asian population 15 years and over
Males 57.4% Never married37.5% Now married0.0% Separated0.0% Widowed5.1% DivorcedFemales 48.8% Never married33.4% Now married0.0% Separated6.5% Widowed11.3% DivorcedWomen who did not give birth in the past 12 months Now married:
33.8% (75)Unmarried:
66.2% (148)
Marital status - Other race population 15 years and over
Males 56.1% Never married16.8% Now married0.0% Separated0.0% Widowed27.1% DivorcedFemales 57.6% Never married39.0% Now married0.0% Separated3.4% Widowed0.0% DivorcedWomen who did not give birth in the past 12 months Now married:
40.4% (96)Unmarried:
59.6% (141)
Marital status - Two or more races population 15 years and over
Males 58.3% Never married24.0% Now married0.0% Separated3.0% Widowed14.7% DivorcedFemales 73.0% Never married12.8% Now married0.0% Separated2.6% Widowed11.7% DivorcedWomen who did not give birth in the past 12 months Now married:
11.5% (74)Unmarried:
88.5% (567)
Marital status - White alone, not Hispanic / Latino population 15 years and over
Males 69.4% Never married21.9% Now married0.3% Separated1.3% Widowed7.0% DivorcedFemales 64.0% Never married19.9% Now married0.8% Separated4.3% Widowed11.0% DivorcedWomen who gave birth in the past 12 months Now married:
60.7% (119)Unmarried:
39.3% (77)
Women who did not give birth in the past 12 months Now married:
16.4% (1,047)Unmarried:
83.6% (5,348)
Marital status - Hispanic or Latino population 15 years and over
Males 47.1% Never married38.1% Now married0.7% Separated2.8% Widowed11.4% DivorcedFemales 72.6% Never married23.2% Now married0.0% Separated2.0% Widowed2.2% DivorcedWomen who did not give birth in the past 12 months Now married:
23.0% (127)Unmarried:
77.0% (427)
Ancestries in Mount Pleasant
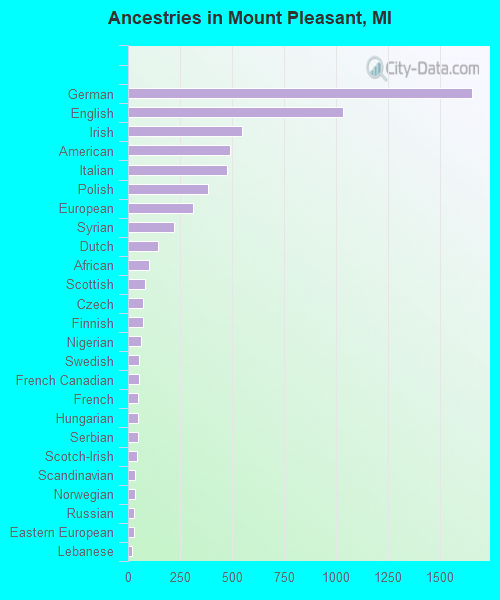
1,653 18.6% German1,035 11.6% English546 6.1% Irish490 5.5% American477 5.4% Italian387 4.4% Polish311 3.5% European221 2.5% Syrian145 1.6% Dutch101 1.1% African81 0.9% Scottish74 0.8% Czech73 0.8% Finnish63 0.7% Nigerian53 0.6% Swedish51 0.6% French Canadian50 0.6% French49 0.6% Hungarian48 0.5% Serbian42 0.5% Scotch-Irish36 0.4% Scandinavian32 0.4% Norwegian31 0.3% Russian31 0.3% Eastern European21 0.2% Lebanese21 0.2% Romanian19 0.2% Canadian18 0.2% Yugoslavian18 0.2% Slovak18 0.2% Lithuanian16 0.2% Slavic15 0.2% Northern European14 0.2% Assyrian13 0.1% Greek12 0.1% Danish12 0.1% Austrian10 0.1% Australian10 0.1% Celtic10 0.1% Bulgarian9 0.1% Czechoslovakian9 0.1% Ukrainian9 0.1% Pennsylvania German8 0.09% Arab8 0.09% British8 0.09% Swiss8 0.09% Haitian6 0.07% Moroccan6 0.07% Portuguese5 0.06% Ghanaian2 0.02% West Indian
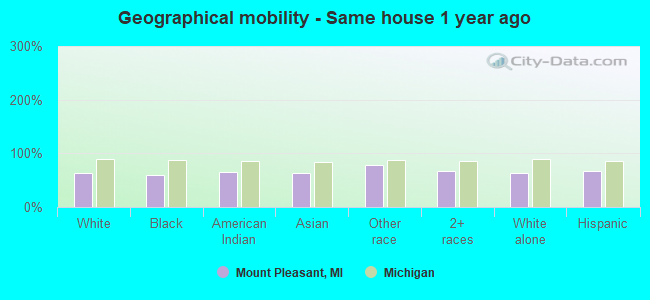
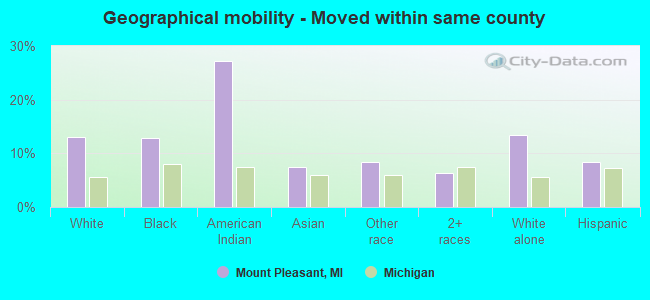
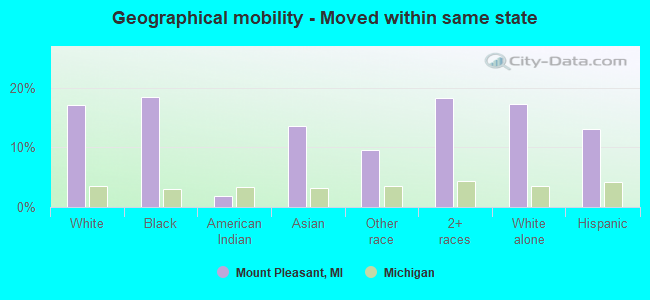
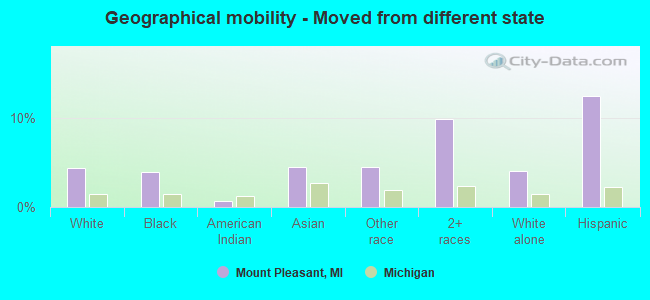
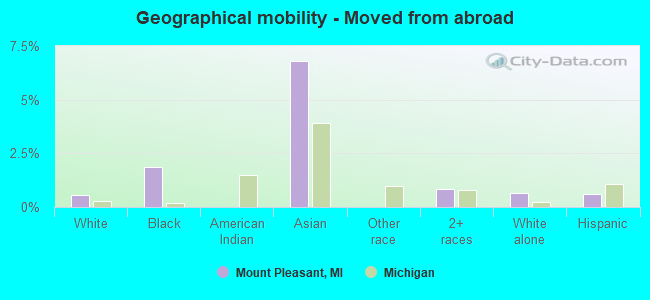
Geographical mobility in Mount Pleasant Same house 1 year ago 11,211 64.0% White (Caucasian)625 59.3% Black or African American270 65.3% American Indian / Alaska Native394 64.1% Asian362 77.9% Other race1,087 66.8% Two or more races10,963 64.0% White alone, not Hispanic / Latino878 67.0% Hispanic or LatinoMoved within same county 2,281 13.0% White / Caucasian135 12.8% Black or African American113 27.2% American Indian / Alaska Native46 7.5% Asian39 8.3% Other race103 6.3% Two or more races2,291 13.4% White alone, not Hispanic / Latino110 8.4% Hispanic or LatinoMoved within same state 3,005 17.2% White / Caucasian194 18.4% Black or African American8 1.9% American Indian / Alaska Native84 13.6% Asian44 9.5% Other race297 18.2% Two or more races2,946 17.2% White alone, not Hispanic / Latino171 13.1% Hispanic or LatinoMoved from different state 769 4.4% White / Caucasian41 3.9% Black or African American3 0.7% American Indian / Alaska Native27 4.4% Asian21 4.4% Other race160 9.8% Two or more races698 4.1% White alone, not Hispanic / Latino162 12.4% Hispanic or LatinoMoved from abroad 100 0.6% White20 1.9% Black or African American42 6.8% Asian13 0.8% Two or more races109 0.6% White alone, not Hispanic / Latino8 0.6% Hispanic or Latino
Children Nativity (place of birth) in Mount Pleasant
Children under 6 years - Living with two parents Both parents native 505 100.0% NativeBoth parents foreign-born 39 100.0% NativeOne native, one foreign-born parent 52 100.0% NativeChildren under 6 years - Living with one parent Native parent 392 100.0% NativeForeign-born parent 7 100.0% NativeChildren 6 to 17 years - Living with two parents Both parents native 720 100.0% NativeBoth parents foreign-born 56 79.2% Native15 20.8% Foreign-bornOne native, one foreign-born parent 46 91.2% Native4 8.8% Foreign-bornChildren 6 to 17 years - Living with one parent Native parent 454 98.3% Native8 1.7% Foreign-bornForeign-born parent 9 100.0% Native
Grandparents responsible for own grandchildren in Mount Pleasant
Grandparents (30 to 59 years) White / Caucasian 22 100.0% Not responsible for grandchildrenTwo or more races 14 100.0% Not responsible for grandchildrenWhite alone, not Hispanic / Latino 22 100.0% Not responsible for grandchildren
Grandparents (60 years and over) White / Caucasian 39 100.0% Not responsible for grandchildrenWhite alone, not Hispanic / Latino 40 100.0% Not responsible for grandchildren