Races in New Iberia, Louisiana (LA) Detailed Stats
Data:
Races - White alone (%)
Races - White alone (% change since 2000)
Races - Black alone (%)
Races - Black alone (% change since 2000)
Races - American Indian alone (%)
Races - American Indian alone (% change since 2000)
Races - Asian alone (%)
Races - Asian alone (% change since 2000)
Races - Hispanic (%)
Races - Hispanic (% change since 2000)
Races - Native Hawaiian and Other Pacific Islander alone (%)
Races - Native Hawaiian and Other Pacific Islander alone (% change since 2000)
Races - Two or more races(%)
Races - Two or more races(% change since 2000)
Races - Other race alone (%)
Races - Other race alone (% change since 2000)
Racial diversity
Place of birth - Born in state of residence (%)
Place of birth - Born in state of residence (%) - White
Place of birth - Born in state of residence (%) - Black or African American
Place of birth - Born in state of residence (%) - Asian
Place of birth - Born in state of residence (%) - Hispanic or Latino
Place of birth - Born in state of residence (%) - American Indian and Alaska Native
Place of birth - Born in state of residence (%) - Multirace
Place of birth - Born in state of residence (%) - Other Race
Place of birth - Born in other state (%)
Place of birth - Born in other state (%) - White
Place of birth - Born in other state (%) - Black or African American
Place of birth - Born in other state (%) - Asian
Place of birth - Born in other state (%) - Hispanic or Latino
Place of birth - Born in other state (%) - American Indian and Alaska Native
Place of birth - Born in other state (%) - Multirace
Place of birth - Born in other state (%) - Other Race
Place of birth - Native, outside of US (%)
Place of birth - Native, outside of US (%) - White
Place of birth - Native, outside of US (%) - Black or African American
Place of birth - Native, outside of US (%) - Asian
Place of birth - Native, outside of US (%) - Hispanic or Latino
Place of birth - Native, outside of US (%) - American Indian and Alaska Native
Place of birth - Native, outside of US (%) - Multirace
Place of birth - Native, outside of US (%) - Other Race
Place of birth - Foreign born (%)
Place of birth - Foreign born (%) - White
Place of birth - Foreign born (%) - Black or African American
Place of birth - Foreign born (%) - Asian
Place of birth - Foreign born (%) - Hispanic or Latino
Place of birth - Foreign born (%) - American Indian and Alaska Native
Place of birth - Foreign born (%) - Multirace
Place of birth - Foreign born (%) - Other Race
Residents speaking English at home (%)
Residents speaking English at home - Born in the United States (%)
Residents speaking English at home - Native, born elsewhere (%)
Residents speaking English at home - Foreign born (%)
Residents speaking Spanish at home (%)
Residents speaking Spanish at home - Born in the United States (%)
Residents speaking Spanish at home - Native, born elsewhere (%)
Residents speaking Spanish at home - Foreign born (%)
Residents speaking other language at home (%)
Residents speaking other language at home - Born in the United States (%)
Residents speaking other language at home - Native, born elsewhere (%)
Residents speaking other language at home - Foreign born (%)
Marital status - Never married (%)
Marital status - Now married (%)
Marital status - Separated (%)
Marital status - Widowed (%)
Marital status - Divorced (%)
Ancestries Reported - Arab (%)
Ancestries Reported - Czech (%)
Ancestries Reported - Danish (%)
Ancestries Reported - Dutch (%)
Ancestries Reported - English (%)
Ancestries Reported - French (%)
Ancestries Reported - French Canadian (%)
Ancestries Reported - German (%)
Ancestries Reported - Greek (%)
Ancestries Reported - Hungarian (%)
Ancestries Reported - Irish (%)
Ancestries Reported - Italian (%)
Ancestries Reported - Lithuanian (%)
Ancestries Reported - Norwegian (%)
Ancestries Reported - Polish (%)
Ancestries Reported - Portuguese (%)
Ancestries Reported - Russian (%)
Ancestries Reported - Scotch-Irish (%)
Ancestries Reported - Scottish (%)
Ancestries Reported - Slovak (%)
Ancestries Reported - Subsaharan African (%)
Ancestries Reported - Swedish (%)
Ancestries Reported - Swiss (%)
Ancestries Reported - Ukrainian (%)
Ancestries Reported - United States (%)
Ancestries Reported - Welsh (%)
Ancestries Reported - West Indian (%)
Ancestries Reported - Other (%)
Geographical mobility - Same house 1 year ago (%)
Geographical mobility - Same house 1 year ago (%) - White
Geographical mobility - Same house 1 year ago (%) - Black or African American
Geographical mobility - Same house 1 year ago (%) - Asian
Geographical mobility - Same house 1 year ago (%) - Hispanic or Latino
Geographical mobility - Same house 1 year ago (%) - American Indian and Alaska Native
Geographical mobility - Same house 1 year ago (%) - Multirace
Geographical mobility - Same house 1 year ago (%) - Other Race
Geographical mobility - Moved within same county (%)
Geographical mobility - Moved within same county (%) - White
Geographical mobility - Moved within same county (%) - Black or African American
Geographical mobility - Moved within same county (%) - Asian
Geographical mobility - Moved within same county (%) - Hispanic or Latino
Geographical mobility - Moved within same county (%) - American Indian and Alaska Native
Geographical mobility - Moved within same county (%) - Multirace
Geographical mobility - Moved within same county (%) - Other Race
Geographical mobility - Moved from different county within same state (%)
Geographical mobility - Moved from different county within same state (%) - White
Geographical mobility - Moved from different county within same state (%) - Black or African American
Geographical mobility - Moved from different county within same state (%) - Asian
Geographical mobility - Moved from different county within same state (%) - Hispanic or Latino
Geographical mobility - Moved from different county within same state (%) - American Indian and Alaska Native
Geographical mobility - Moved from different county within same state (%) - Multirace
Geographical mobility - Moved from different county within same state (%) - Other Race
Geographical mobility - Moved from different state (%)
Geographical mobility - Moved from different state (%) - White
Geographical mobility - Moved from different state (%) - Black or African American
Geographical mobility - Moved from different state (%) - Asian
Geographical mobility - Moved from different state (%) - Hispanic or Latino
Geographical mobility - Moved from different state (%) - American Indian and Alaska Native
Geographical mobility - Moved from different state (%) - Multirace
Geographical mobility - Moved from different state (%) - Other Race
Geographical mobility - Moved from abroad (%)
Geographical mobility - Moved from abroad (%) - White
Geographical mobility - Moved from abroad (%) - Black or African American
Geographical mobility - Moved from abroad (%) - Asian
Geographical mobility - Moved from abroad (%) - Hispanic or Latino
Geographical mobility - Moved from abroad (%) - American Indian and Alaska Native
Geographical mobility - Moved from abroad (%) - Multirace
Geographical mobility - Moved from abroad (%) - Other Race
Place of birth for the foreign-born population - Ireland (%)
Place of birth for the foreign-born population - Denmark (%)
Place of birth for the foreign-born population - Norway (%)
Place of birth for the foreign-born population - Sweden (%)
Place of birth for the foreign-born population - United Kingdom (%)
Place of birth for the foreign-born population - England (%)
Place of birth for the foreign-born population - Scotland (%)
Place of birth for the foreign-born population - Other Northern Europe (%)
Place of birth for the foreign-born population - Austria (%)
Place of birth for the foreign-born population - Belgium (%)
Place of birth for the foreign-born population - France (%)
Place of birth for the foreign-born population - Germany (%)
Place of birth for the foreign-born population - Netherlands (%)
Place of birth for the foreign-born population - Switzerland (%)
Place of birth for the foreign-born population - Other Western Europe (%)
Place of birth for the foreign-born population - Greece (%)
Place of birth for the foreign-born population - Italy (%)
Place of birth for the foreign-born population - Portugal (%)
Place of birth for the foreign-born population - Spain (%)
Place of birth for the foreign-born population - Other Southern Europe (%)
Place of birth for the foreign-born population - Albania (%)
Place of birth for the foreign-born population - Belarus (%)
Place of birth for the foreign-born population - Bosnia and Herzegovina (%)
Place of birth for the foreign-born population - Bulgaria (%)
Place of birth for the foreign-born population - Croatia (%)
Place of birth for the foreign-born population - Czechoslovakia (%)
Place of birth for the foreign-born population - Hungary (%)
Place of birth for the foreign-born population - Latvia (%)
Place of birth for the foreign-born population - Lithuania (%)
Place of birth for the foreign-born population - North Macedonia (Macedonia) (%)
Place of birth for the foreign-born population - Moldova (%)
Place of birth for the foreign-born population - Poland (%)
Place of birth for the foreign-born population - Romania (%)
Place of birth for the foreign-born population - Russia (%)
Place of birth for the foreign-born population - Serbia (%)
Place of birth for the foreign-born population - Ukraine (%)
Place of birth for the foreign-born population - Other Eastern Europe (%)
Place of birth for the foreign-born population - China (%)
Place of birth for the foreign-born population - Hong Kong (%)
Place of birth for the foreign-born population - Taiwan (%)
Place of birth for the foreign-born population - Japan (%)
Place of birth for the foreign-born population - Korea (%)
Place of birth for the foreign-born population - Other Eastern Asia (%)
Place of birth for the foreign-born population - Afghanistan (%)
Place of birth for the foreign-born population - Bangladesh (%)
Place of birth for the foreign-born population - India (%)
Place of birth for the foreign-born population - Iran (%)
Place of birth for the foreign-born population - Kazakhstan (%)
Place of birth for the foreign-born population - Nepal (%)
Place of birth for the foreign-born population - Pakistan (%)
Place of birth for the foreign-born population - Sri Lanka (%)
Place of birth for the foreign-born population - Uzbekistan (%)
Place of birth for the foreign-born population - Other South Central Asia (%)
Place of birth for the foreign-born population - Burma (%)
Place of birth for the foreign-born population - Cambodia (%)
Place of birth for the foreign-born population - Indonesia (%)
Place of birth for the foreign-born population - Laos (%)
Place of birth for the foreign-born population - Malaysia (%)
Place of birth for the foreign-born population - Philippines (%)
Place of birth for the foreign-born population - Singapore (%)
Place of birth for the foreign-born population - Thailand (%)
Place of birth for the foreign-born population - Vietnam (%)
Place of birth for the foreign-born population - Other South Eastern Asia (%)
Place of birth for the foreign-born population - Armenia (%)
Place of birth for the foreign-born population - Iraq (%)
Place of birth for the foreign-born population - Israel (%)
Place of birth for the foreign-born population - Jordan (%)
Place of birth for the foreign-born population - Kuwait (%)
Place of birth for the foreign-born population - Lebanon (%)
Place of birth for the foreign-born population - Saudi Arabia (%)
Place of birth for the foreign-born population - Syria (%)
Place of birth for the foreign-born population - Turkey (%)
Place of birth for the foreign-born population - Yemen (%)
Place of birth for the foreign-born population - Other Western Asia (%)
Place of birth for the foreign-born population - Eritrea (%)
Place of birth for the foreign-born population - Ethiopia (%)
Place of birth for the foreign-born population - Kenya (%)
Place of birth for the foreign-born population - Somalia (%)
Place of birth for the foreign-born population - Uganda (%)
Place of birth for the foreign-born population - Zimbabwe (%)
Place of birth for the foreign-born population - Other Eastern Africa (%)
Place of birth for the foreign-born population - Cameroon (%)
Place of birth for the foreign-born population - Congo (%)
Place of birth for the foreign-born population - Democratic Republic of Congo (Zaire) (%)
Place of birth for the foreign-born population - Other Middle Africa (%)
Place of birth for the foreign-born population - Egypt (%)
Place of birth for the foreign-born population - Morocco (%)
Place of birth for the foreign-born population - Sudan (%)
Place of birth for the foreign-born population - Other Northern Africa (%)
Place of birth for the foreign-born population - South Africa (%)
Place of birth for the foreign-born population - Other Southern Africa (%)
Place of birth for the foreign-born population - Cabo Verde (%)
Place of birth for the foreign-born population - Ghana (%)
Place of birth for the foreign-born population - Liberia (%)
Place of birth for the foreign-born population - Nigeria (%)
Place of birth for the foreign-born population - Senegal (%)
Place of birth for the foreign-born population - Sierra Leone (%)
Place of birth for the foreign-born population - Other Western Africa (%)
Place of birth for the foreign-born population - Australia (%)
Place of birth for the foreign-born population - New Zealand (%)
Place of birth for the foreign-born population - Fiji (%)
Place of birth for the foreign-born population - Micronesia (%)
Place of birth for the foreign-born population - Bahamas (%)
Place of birth for the foreign-born population - Barbados (%)
Place of birth for the foreign-born population - Cuba (%)
Place of birth for the foreign-born population - Dominica (%)
Place of birth for the foreign-born population - Dominican Republic (%)
Place of birth for the foreign-born population - Grenada (%)
Place of birth for the foreign-born population - Haiti (%)
Place of birth for the foreign-born population - Jamaica (%)
Place of birth for the foreign-born population - St. Vincent and the Grenadines (%)
Place of birth for the foreign-born population - Trinidad and Tobago (%)
Place of birth for the foreign-born population - West Indies (%)
Place of birth for the foreign-born population - Other Caribbean (%)
Place of birth for the foreign-born population - Belize (%)
Place of birth for the foreign-born population - Costa Rica (%)
Place of birth for the foreign-born population - El Salvador (%)
Place of birth for the foreign-born population - Guatemala (%)
Place of birth for the foreign-born population - Honduras (%)
Place of birth for the foreign-born population - Mexico (%)
Place of birth for the foreign-born population - Nicaragua (%)
Place of birth for the foreign-born population - Panama (%)
Place of birth for the foreign-born population - Other Central America (%)
Place of birth for the foreign-born population - Argentina (%)
Place of birth for the foreign-born population - Bolivia (%)
Place of birth for the foreign-born population - Brazil (%)
Place of birth for the foreign-born population - Chile (%)
Place of birth for the foreign-born population - Colombia (%)
Place of birth for the foreign-born population - Ecuador (%)
Place of birth for the foreign-born population - Guyana (%)
Place of birth for the foreign-born population - Peru (%)
Place of birth for the foreign-born population - Uruguay (%)
Place of birth for the foreign-born population - Venezuela (%)
Place of birth for the foreign-born population - Other South America (%)
Place of birth for the foreign-born population - Canada (%)
Place of birth for the foreign-born population - Other Northern America (%)
Place of birth for the foreign-born population - Other (%)
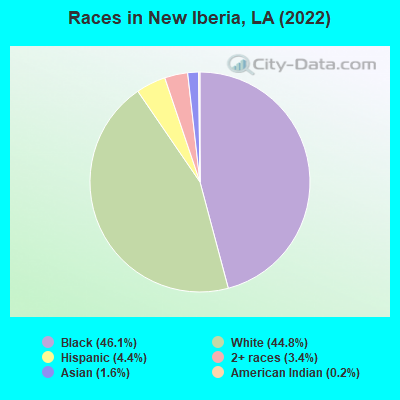
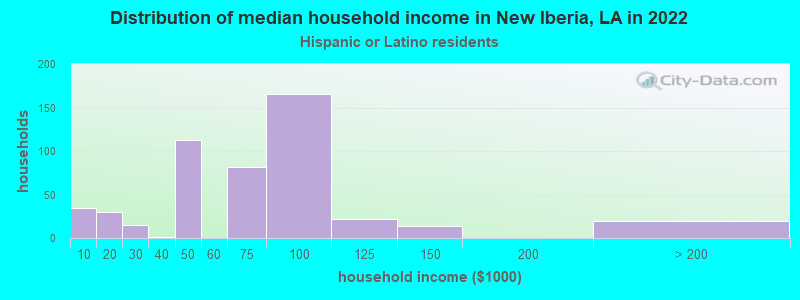
According to 2022 data, the most numerous races in New Iberia, LA are White alone (12,418 residents), Black alone (12,759 residents), and Hispanic (1,216 residents). 92.6% of New Iberia residents speak English at home. 2.5% of New Iberia, LA residents are foreign-born (1.2% born in Asia, 0.8% born in Latin America, 0.3% born in Africa), which is 59.0% less than the foreign-born rate of 4.0% across the entire state of Louisiana.
Race distribution in New Iberia
2000 2022
2,794,391 62.5% White alone 1,443,390 32.3% Black alone 107,738 2.4% Hispanic 54,256 1.2% Asian alone 39,260 0.9% Two or more races 24,129 0.5% American Indian alone 4,736 0.1% Other race alone 1,076 0.02% Native Hawaiian and Other
2,603,221 56.7% White alone 1,420,055 30.9% Black alone 262,213 5.7% Hispanic 183,270 4.0% Two or more races 81,169 1.8% Asian alone 19,991 0.4% American Indian alone 18,043 0.4% Other race alone 2,279 0.05% Native Hawaiian and Other
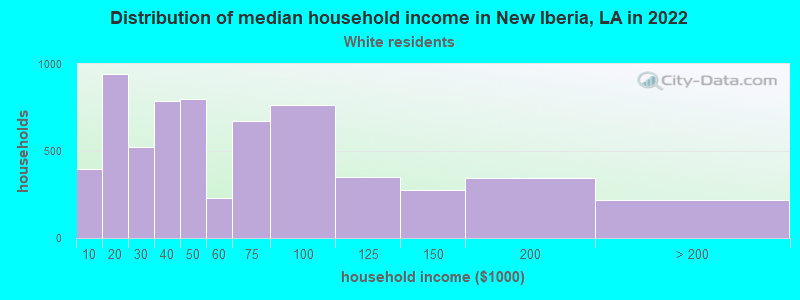
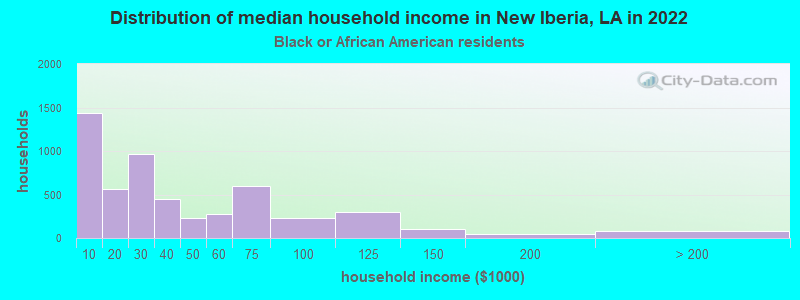
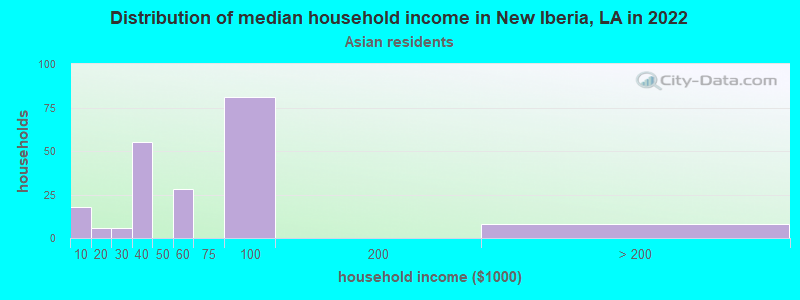
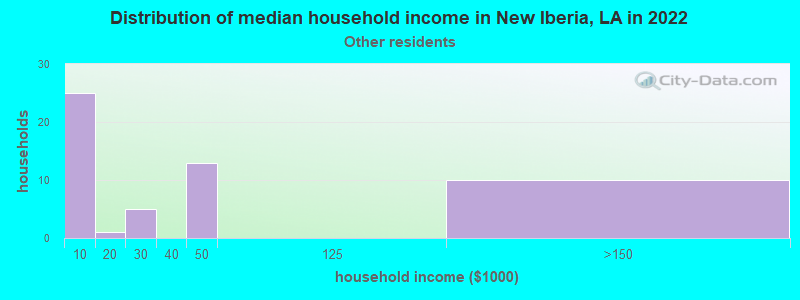
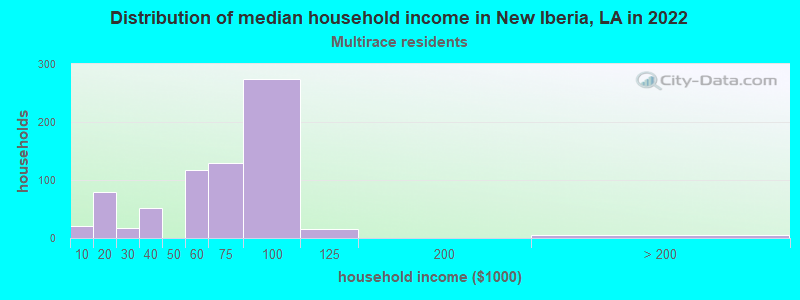
Income and house value in New Iberia Median household income in 2022 $48,511 White non-Hispanic householders$25,339 Black householders$90,051 Asian householders$50,816 Two or more races householders$37,679 Hispanic or Latino race householdersMedian 2022 house value $170,707 White Non-Hispanic householders$126,719 Black or African American householders$66,322 American Indian or Alaska Native householders $192,131 Asian householders$216,517 Native Hawaiian and other Pacific Islander householders$153,841 Some other race householders$193,726 Two or more races householders$188,940 Hispanic or Latino householders
Median age by race in New Iberia
48.7 Median age for White residents45.9 50.4 28.8 Median age for Black or African American residents27.6 28.3 30.5 Median age for American Indian / Alaska Native residents16.3 -781,341,107.1 57.4 Median age for Asian residents57.2 61.1 -666,666,666.0 Median age for Native Hawaiian / Pacific Islander residents-666,666,666.0 -666,666,666.0 20.3 Median age for Other race residents31.1 21.6 20.5 Median age for Two or more races residents21.0 16.5 48.6 Median age for White alone residents46.4 49.6 46.4 Median age for Hispanic or Latino residents35.7 49.5
Owner/renter occupied households by race in New Iberia
House owners and renters - White residents 3,884 64.6% Owner occupied2,131 35.4% Renter occupiedHouse owners and renters - Black or African American residents 1,264 23.7% Owner occupied4,066 76.3% Renter occupiedHouse owners and renters - American Indian / Alaska Native residents 9 100.0% Renter occupiedHouse owners and renters - Asian residents 123 75.9% Owner occupied39 24.1% Renter occupiedHouse owners and renters - Native Hawaiian / Pacific Islander residents 1 100.0% Renter occupiedHouse owners and renters - Other race residents 11 20.5% Owner occupied41 79.5% Renter occupiedHouse owners and renters - Two or more races residents 330 79.9% Owner occupied83 20.1% Renter occupiedHouse owners and renters - White alone residents 3,867 64.8% Owner occupied2,099 35.2% Renter occupiedHouse owners and renters - Hispanic or Latino residents 285 63.0% Owner occupied167 37.0% Renter occupied
Language usage in New Iberia
English speakers - Total 92.6% of residents of New Iberia speak English at home.
2.4% of residents speak Spanish at home 358 59.0% Speak English very well249 41.0% Speak English less than very well5.0% of residents speak other language at home 735 59.2% Speak English very well506 40.8% Speak English less than very well
English speakers - Born in the United States 95.8% of residents of New Iberia speak English at home.
0.7% of residents speak Spanish at home 16 100.0% Speak English very well2.9% of residents speak other language at home 40 58.0% Speak English very well29 42.0% Speak English less than very well
All residents speak only English at home
English speakers - Foreign-born 9.5% of residents of New Iberia speak English at home.
32.9% of residents speak Spanish at home 74 31.4% Speak English very well162 68.6% Speak English less than very well63.0% of residents speak other language at home 90 19.9% Speak English very well362 80.1% Speak English less than very well
White (Caucasian) - Speak another language Native:
5.9% (695)Foreign-born:
89.2% (157)
Black or African American - Speak only English Native:
97.9% (10,717)Foreign-born:
17.2% (3)
Black or African American - Speak another language Native:
2.2% (242)Foreign-born:
83.8% (15)
American Indian / Alaska Native - Speak only English Native:
66.1% (27)Foreign-born:
48.5% (15)
American Indian / Alaska Native - Speak another language Native:
38.3% (16)Foreign-born:
42.0% (13)
Asian - Speak only English Native:
42.6% (48)Foreign-born:
15.8% (54)
Asian - Speak another language Native:
58.2% (66)Foreign-born:
83.5% (284)
Other race - Speak another language Native:
51.4% (66)Foreign-born:
100.0% (26)
White alone - Speak another language Native:
5.9% (689)Foreign-born:
99.7% (98)
Hispanic or Latino - Speak only English Native:
75.8% (592)Foreign-born:
10.0% (20)
Hispanic or Latino - Speak another language Native:
23.3% (182)Foreign-born:
93.2% (186)
Foreign-born residents in New Iberia 697 residents are foreign born (1.2% Asia , 0.8% Latin America , 0.3% Africa ).
This city:
2.5%Louisiana:
4.2%
Marital status for residents in New Iberia Marital status - White (Caucasian) population 15 years and over
Males 28.4% Never married50.1% Now married1.9% Separated4.7% Widowed14.8% DivorcedFemales 23.9% Never married50.7% Now married1.3% Separated11.9% Widowed12.1% DivorcedWomen who gave birth in the past 12 months Now married:
55.1% (84)Unmarried:
44.9% (69)
Women who did not give birth in the past 12 months Now married:
49.2% (1,108)Unmarried:
50.8% (1,142)
Marital status - Black or African American population 15 years and over
Males 53.4% Never married22.8% Now married7.8% Separated3.3% Widowed12.6% DivorcedFemales 59.1% Never married19.6% Now married4.3% Separated7.1% Widowed9.9% DivorcedWomen who gave birth in the past 12 months Now married:
24.4% (80)Unmarried:
75.6% (248)
Women who did not give birth in the past 12 months Now married:
16.3% (468)Unmarried:
83.7% (2,394)
Marital status - American Indian / Alaska Native population 15 years and over
Males 0.0% Never married100.0% Now married0.0% Separated0.0% Widowed0.0% DivorcedFemales 0.0% Never married100.0% Now married0.0% Separated0.0% Widowed0.0% DivorcedWomen who did not give birth in the past 12 months Now married:
100.0% (10)Unmarried:
0.0% (0)
Marital status - Asian population 15 years and over
Males 15.2% Never married77.6% Now married0.0% Separated0.0% Widowed7.3% DivorcedFemales 21.9% Never married56.6% Now married6.8% Separated11.9% Widowed2.7% DivorcedWomen who did not give birth in the past 12 months Now married:
66.4% (84)Unmarried:
33.6% (43)
Marital status - Other race population 15 years and over
Males 2.7% Never married97.3% Now married0.0% Separated0.0% Widowed0.0% DivorcedFemales 71.2% Never married21.2% Now married0.0% Separated7.7% Widowed0.0% DivorcedWomen who gave birth in the past 12 months Now married:
100.0% (21)Unmarried:
0.0% (0)
Women who did not give birth in the past 12 months Now married:
0.0% (0)Unmarried:
100.0% (76)
Marital status - Two or more races population 15 years and over
Males 31.3% Never married48.5% Now married0.0% Separated4.1% Widowed16.1% DivorcedFemales 36.7% Never married53.3% Now married0.0% Separated0.3% Widowed9.7% DivorcedWomen who did not give birth in the past 12 months Now married:
51.3% (192)Unmarried:
48.7% (183)
Marital status - White alone, not Hispanic / Latino population 15 years and over
Males 27.7% Never married50.3% Now married2.0% Separated4.8% Widowed15.2% DivorcedFemales 23.6% Never married50.8% Now married1.3% Separated11.9% Widowed12.4% DivorcedWomen who gave birth in the past 12 months Now married:
55.1% (86)Unmarried:
44.9% (70)
Women who did not give birth in the past 12 months Now married:
49.4% (1,095)Unmarried:
50.6% (1,120)
Marital status - Hispanic or Latino population 15 years and over
Males 20.5% Never married48.6% Now married13.2% Separated0.0% Widowed17.7% DivorcedFemales 53.0% Never married34.1% Now married0.0% Separated4.2% Widowed8.7% DivorcedWomen who gave birth in the past 12 months Now married:
100.0% (20)Unmarried:
0.0% (0)
Women who did not give birth in the past 12 months Now married:
23.8% (56)Unmarried:
76.2% (179)
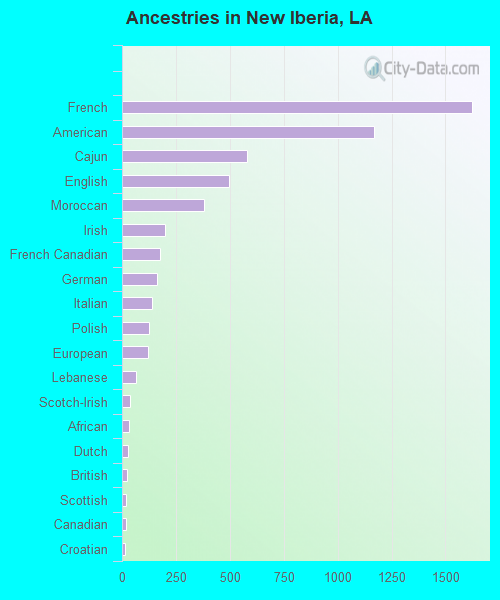
Ancestries in New Iberia
1,621 9.4% French1,171 6.8% American578 3.4% Cajun496 2.9% English382 2.2% Moroccan198 1.1% Irish176 1.0% French Canadian162 0.9% German138 0.8% Italian125 0.7% Polish119 0.7% European67 0.4% Lebanese36 0.2% Scotch-Irish32 0.2% African26 0.2% Dutch25 0.1% British19 0.1% Scottish17 0.10% Canadian15 0.09% Croatian14 0.08% Czech9 0.05% Scandinavian6 0.03% Portuguese
Geographical mobility in New Iberia Same house 1 year ago 11,067 88.1% White (Caucasian)10,636 83.6% Black or African American88 99.4% American Indian / Alaska Native312 69.3% Asian1 100.0% Native Hawaiian / Pacific Islander95 55.3% Other race2,123 87.2% Two or more races10,924 88.0% White alone, not Hispanic / Latino1,114 88.1% Hispanic or LatinoMoved within same county 956 7.6% White / Caucasian1,959 15.4% Black or African American152 33.8% Asian71 41.3% Other race294 12.1% Two or more races947 7.6% White alone, not Hispanic / Latino147 11.7% Hispanic or LatinoMoved within same state 248 2.0% White / Caucasian163 1.3% Black or African American9 0.4% Two or more races248 2.0% White alone, not Hispanic / LatinoMoved from different state 141 1.1% White / Caucasian36 0.3% Black or African American141 1.1% White alone, not Hispanic / LatinoMoved from abroad 43 0.3% White43 0.3% White alone, not Hispanic / Latino
Children Nativity (place of birth) in New Iberia
Children under 6 years - Living with two parents Both parents native 827 100.0% NativeBoth parents foreign-born 5 100.0% NativeOne native, one foreign-born parent 84 100.0% NativeChildren under 6 years - Living with one parent Native parent 2,002 100.0% NativeChildren 6 to 17 years - Living with two parents Both parents native 1,603 99.3% Native11 0.7% Foreign-bornBoth parents foreign-born 53 91.4% Native5 8.6% Foreign-bornOne native, one foreign-born parent 57 60.5% Native37 39.5% Foreign-bornChildren 6 to 17 years - Living with one parent Native parent 2,444 100.0% NativeForeign-born parent 28 50.6% Native27 49.4% Foreign-born
Grandparents responsible for own grandchildren in New Iberia
Grandparents (30 to 59 years) White / Caucasian 66 63.3% Responsible for grandchildren38 36.7% Not responsible for grandchildrenBlack or African American 208 80.8% Responsible for grandchildren50 19.2% Not responsible for grandchildrenWhite alone, not Hispanic / Latino 49 54.9% Responsible for grandchildren41 45.1% Not responsible for grandchildrenHispanic or Latino 20 100.0% Responsible for grandchildrenGrandparents (60 years and over) White / Caucasian 258 86.6% Responsible for grandchildren40 13.4% Not responsible for grandchildrenBlack or African American 38 41.3% Responsible for grandchildren54 58.7% Not responsible for grandchildrenWhite alone, not Hispanic / Latino 263 86.6% Responsible for grandchildren41 13.4% Not responsible for grandchildren