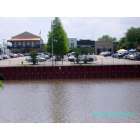
New Iberia, Louisiana Submit your own pictures of this city and show them to the world
OSM Map
General Map
Google Map
MSN Map
OSM Map
General Map
Google Map
MSN Map
OSM Map
General Map
Google Map
MSN Map
OSM Map
General Map
Google Map
MSN Map
Please wait while loading the map...
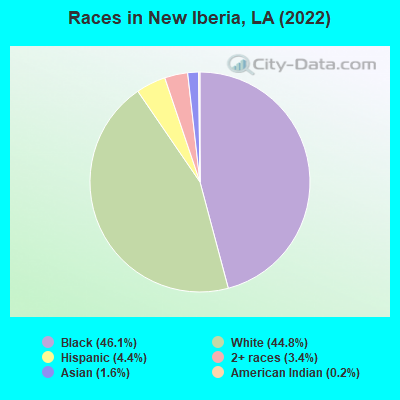
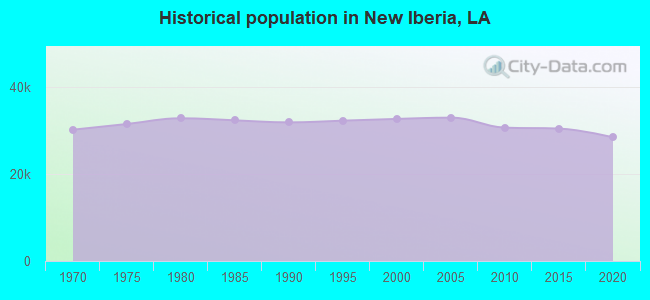
Population in 2022: 27,473 (99% urban, 1% rural). Population change since 2000: -15.8%Males: 13,084 Females: 14,389
March 2022 cost of living index in New Iberia: 79.5 (low, U.S. average is 100) Percentage of residents living in poverty in 2022: 30.4%for White Non-Hispanic residents , 44.4% for Black residents , 19.8% for Hispanic or Latino residents , 61.1% for other race residents , 19.7% for two or more races residents )
Profiles of local businesses
Business Search - 14 Million verified businesses
Data:
Median household income ($)
Median household income (% change since 2000)
Household income diversity
Ratio of average income to average house value (%)
Ratio of average income to average rent
Median household income ($) - White
Median household income ($) - Black or African American
Median household income ($) - Asian
Median household income ($) - Hispanic or Latino
Median household income ($) - American Indian and Alaska Native
Median household income ($) - Multirace
Median household income ($) - Other Race
Median household income for houses/condos with a mortgage ($)
Median household income for apartments without a mortgage ($)
Races - White alone (%)
Races - White alone (% change since 2000)
Races - Black alone (%)
Races - Black alone (% change since 2000)
Races - American Indian alone (%)
Races - American Indian alone (% change since 2000)
Races - Asian alone (%)
Races - Asian alone (% change since 2000)
Races - Hispanic (%)
Races - Hispanic (% change since 2000)
Races - Native Hawaiian and Other Pacific Islander alone (%)
Races - Native Hawaiian and Other Pacific Islander alone (% change since 2000)
Races - Two or more races (%)
Races - Two or more races (% change since 2000)
Races - Other race alone (%)
Races - Other race alone (% change since 2000)
Racial diversity
Unemployment (%)
Unemployment (% change since 2000)
Unemployment (%) - White
Unemployment (%) - Black or African American
Unemployment (%) - Asian
Unemployment (%) - Hispanic or Latino
Unemployment (%) - American Indian and Alaska Native
Unemployment (%) - Multirace
Unemployment (%) - Other Race
Population density (people per square mile)
Population - Males (%)
Population - Females (%)
Population - Males (%) - White
Population - Males (%) - Black or African American
Population - Males (%) - Asian
Population - Males (%) - Hispanic or Latino
Population - Males (%) - American Indian and Alaska Native
Population - Males (%) - Multirace
Population - Males (%) - Other Race
Population - Females (%) - White
Population - Females (%) - Black or African American
Population - Females (%) - Asian
Population - Females (%) - Hispanic or Latino
Population - Females (%) - American Indian and Alaska Native
Population - Females (%) - Multirace
Population - Females (%) - Other Race
Coronavirus confirmed cases (May 04, 2024)
Deaths caused by coronavirus (May 04, 2024)
Coronavirus confirmed cases (per 100k population) (May 04, 2024)
Deaths caused by coronavirus (per 100k population) (May 04, 2024)
Daily increase in number of cases (May 04, 2024)
Weekly increase in number of cases (May 04, 2024)
Cases doubled (in days) (May 04, 2024)
Hospitalized patients (Apr 18, 2022)
Negative test results (Apr 18, 2022)
Total test results (Apr 18, 2022)
COVID Vaccine doses distributed (per 100k population) (Sep 19, 2023)
COVID Vaccine doses administered (per 100k population) (Sep 19, 2023)
COVID Vaccine doses distributed (Sep 19, 2023)
COVID Vaccine doses administered (Sep 19, 2023)
Likely homosexual households (%)
Likely homosexual households (% change since 2000)
Likely homosexual households - Lesbian couples (%)
Likely homosexual households - Lesbian couples (% change since 2000)
Likely homosexual households - Gay men (%)
Likely homosexual households - Gay men (% change since 2000)
Cost of living index
Median gross rent ($)
Median contract rent ($)
Median monthly housing costs ($)
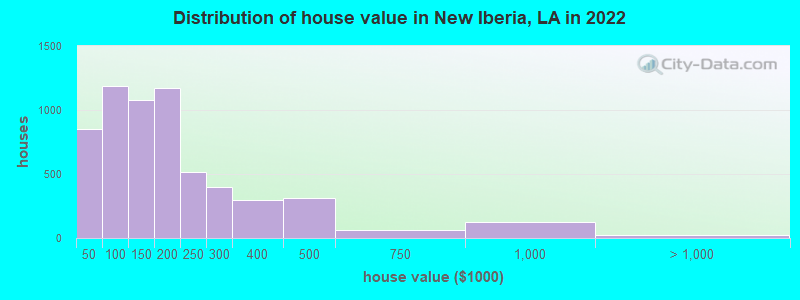
Median house or condo value ($)
Median house or condo value ($ change since 2000)
Mean house or condo value by units in structure - 1, detached ($)
Mean house or condo value by units in structure - 1, attached ($)
Mean house or condo value by units in structure - 2 ($)
Mean house or condo value by units in structure by units in structure - 3 or 4 ($)
Mean house or condo value by units in structure - 5 or more ($)
Mean house or condo value by units in structure - Boat, RV, van, etc. ($)
Mean house or condo value by units in structure - Mobile home ($)
Median house or condo value ($) - White
Median house or condo value ($) - Black or African American
Median house or condo value ($) - Asian
Median house or condo value ($) - Hispanic or Latino
Median house or condo value ($) - American Indian and Alaska Native
Median house or condo value ($) - Multirace
Median house or condo value ($) - Other Race
Median resident age
Resident age diversity
Median resident age - Males
Median resident age - Females
Median resident age - White
Median resident age - Black or African American
Median resident age - Asian
Median resident age - Hispanic or Latino
Median resident age - American Indian and Alaska Native
Median resident age - Multirace
Median resident age - Other Race
Median resident age - Males - White
Median resident age - Males - Black or African American
Median resident age - Males - Asian
Median resident age - Males - Hispanic or Latino
Median resident age - Males - American Indian and Alaska Native
Median resident age - Males - Multirace
Median resident age - Males - Other Race
Median resident age - Females - White
Median resident age - Females - Black or African American
Median resident age - Females - Asian
Median resident age - Females - Hispanic or Latino
Median resident age - Females - American Indian and Alaska Native
Median resident age - Females - Multirace
Median resident age - Females - Other Race
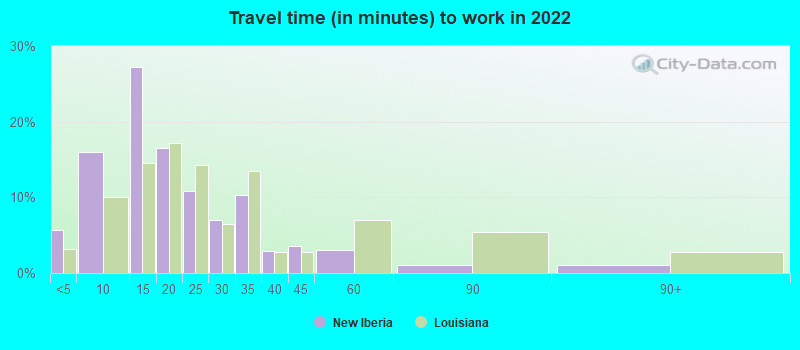
Commute - mean travel time to work (minutes)
Travel time to work - Less than 5 minutes (%)
Travel time to work - Less than 5 minutes (% change since 2000)
Travel time to work - 5 to 9 minutes (%)
Travel time to work - 5 to 9 minutes (% change since 2000)
Travel time to work - 10 to 19 minutes (%)
Travel time to work - 10 to 19 minutes (% change since 2000)
Travel time to work - 20 to 29 minutes (%)
Travel time to work - 20 to 29 minutes (% change since 2000)
Travel time to work - 30 to 39 minutes (%)
Travel time to work - 30 to 39 minutes (% change since 2000)
Travel time to work - 40 to 59 minutes (%)
Travel time to work - 40 to 59 minutes (% change since 2000)
Travel time to work - 60 to 89 minutes (%)
Travel time to work - 60 to 89 minutes (% change since 2000)
Travel time to work - 90 or more minutes (%)
Travel time to work - 90 or more minutes (% change since 2000)
Marital status - Never married (%)
Marital status - Now married (%)
Marital status - Separated (%)
Marital status - Widowed (%)
Marital status - Divorced (%)
Median family income ($)
Median family income (% change since 2000)
Median non-family income ($)
Median non-family income (% change since 2000)
Median per capita income ($)
Median per capita income (% change since 2000)
Median family income ($) - White
Median family income ($) - Black or African American
Median family income ($) - Asian
Median family income ($) - Hispanic or Latino
Median family income ($) - American Indian and Alaska Native
Median family income ($) - Multirace
Median family income ($) - Other Race
Median year house/condo built
Median year apartment built
Year house built - Built 2005 or later (%)
Year house built - Built 2000 to 2004 (%)
Year house built - Built 1990 to 1999 (%)
Year house built - Built 1980 to 1989 (%)
Year house built - Built 1970 to 1979 (%)
Year house built - Built 1960 to 1969 (%)
Year house built - Built 1950 to 1959 (%)
Year house built - Built 1940 to 1949 (%)
Year house built - Built 1939 or earlier (%)
Average household size
Household density (households per square mile)
Average household size - White
Average household size - Black or African American
Average household size - Asian
Average household size - Hispanic or Latino
Average household size - American Indian and Alaska Native
Average household size - Multirace
Average household size - Other Race
Occupied housing units (%)
Vacant housing units (%)
Owner occupied housing units (%)
Renter occupied housing units (%)
Vacancy status - For rent (%)
Vacancy status - For sale only (%)
Vacancy status - Rented or sold, not occupied (%)
Vacancy status - For seasonal, recreational, or occasional use (%)
Vacancy status - For migrant workers (%)
Vacancy status - Other vacant (%)
Residents with income below the poverty level (%)
Residents with income below 50% of the poverty level (%)
Children below poverty level (%)
Poor families by family type - Married-couple family (%)
Poor families by family type - Male, no wife present (%)
Poor families by family type - Female, no husband present (%)
Poverty status for native-born residents (%)
Poverty status for foreign-born residents (%)
Poverty among high school graduates not in families (%)
Poverty among people who did not graduate high school not in families (%)
Residents with income below the poverty level (%) - White
Residents with income below the poverty level (%) - Black or African American
Residents with income below the poverty level (%) - Asian
Residents with income below the poverty level (%) - Hispanic or Latino
Residents with income below the poverty level (%) - American Indian and Alaska Native
Residents with income below the poverty level (%) - Multirace
Residents with income below the poverty level (%) - Other Race
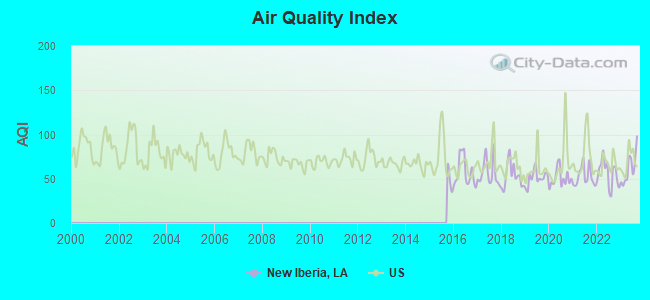
Air pollution - Air Quality Index (AQI)
Air pollution - CO
Air pollution - NO2
Air pollution - SO2
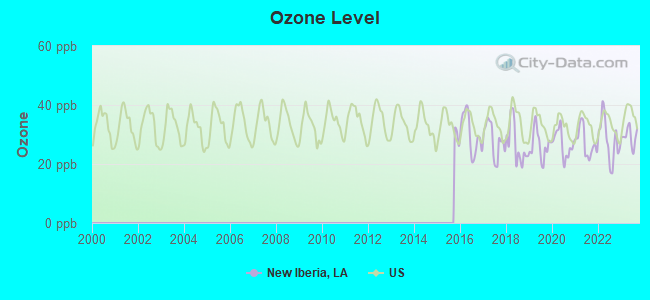
Air pollution - Ozone
Air pollution - PM10
Air pollution - PM25
Air pollution - Pb
Crime - Murders per 100,000 population
Crime - Rapes per 100,000 population
Crime - Robberies per 100,000 population
Crime - Assaults per 100,000 population
Crime - Burglaries per 100,000 population
Crime - Thefts per 100,000 population
Crime - Auto thefts per 100,000 population
Crime - Arson per 100,000 population
Crime - City-data.com crime index
Crime - Violent crime index
Crime - Property crime index
Crime - Murders per 100,000 population (5 year average)
Crime - Rapes per 100,000 population (5 year average)
Crime - Robberies per 100,000 population (5 year average)
Crime - Assaults per 100,000 population (5 year average)
Crime - Burglaries per 100,000 population (5 year average)
Crime - Thefts per 100,000 population (5 year average)
Crime - Auto thefts per 100,000 population (5 year average)
Crime - Arson per 100,000 population (5 year average)
Crime - City-data.com crime index (5 year average)
Crime - Violent crime index (5 year average)
Crime - Property crime index (5 year average)
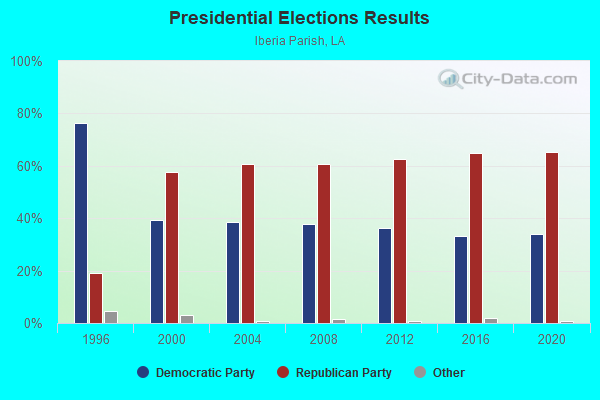
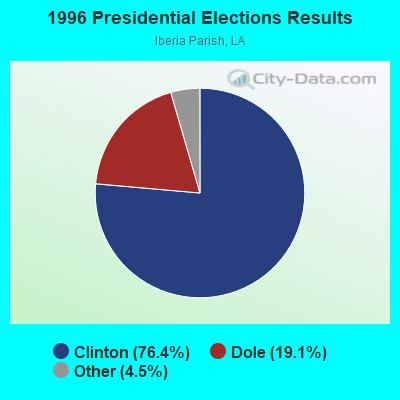
1996 Presidential Elections Results (%) - Democratic Party (Clinton)
1996 Presidential Elections Results (%) - Republican Party (Dole)
1996 Presidential Elections Results (%) - Other
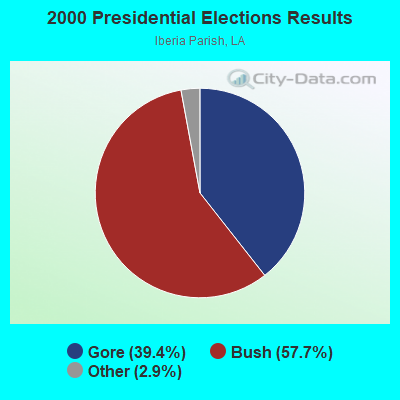
2000 Presidential Elections Results (%) - Democratic Party (Gore)
2000 Presidential Elections Results (%) - Republican Party (Bush)
2000 Presidential Elections Results (%) - Other
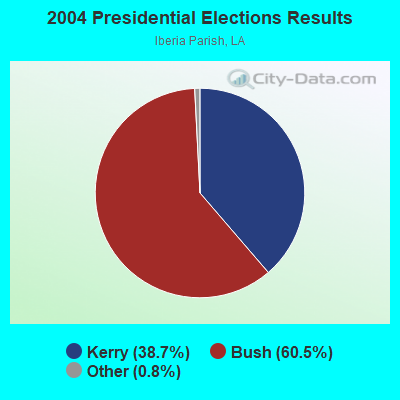
2004 Presidential Elections Results (%) - Democratic Party (Kerry)
2004 Presidential Elections Results (%) - Republican Party (Bush)
2004 Presidential Elections Results (%) - Other
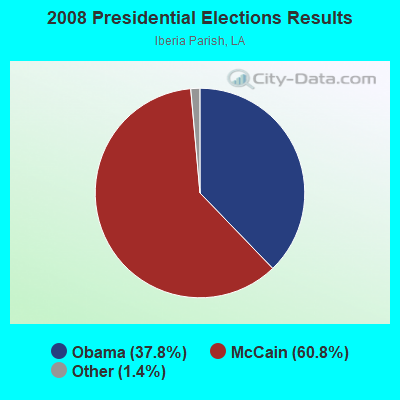
2008 Presidential Elections Results (%) - Democratic Party (Obama)
2008 Presidential Elections Results (%) - Republican Party (McCain)
2008 Presidential Elections Results (%) - Other
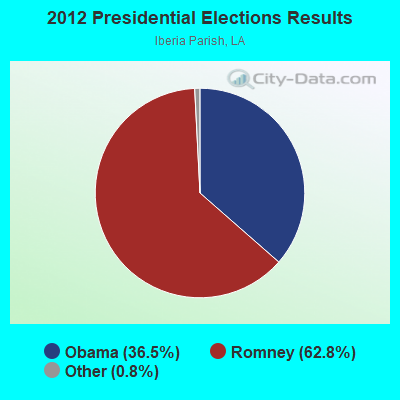
2012 Presidential Elections Results (%) - Democratic Party (Obama)
2012 Presidential Elections Results (%) - Republican Party (Romney)
2012 Presidential Elections Results (%) - Other
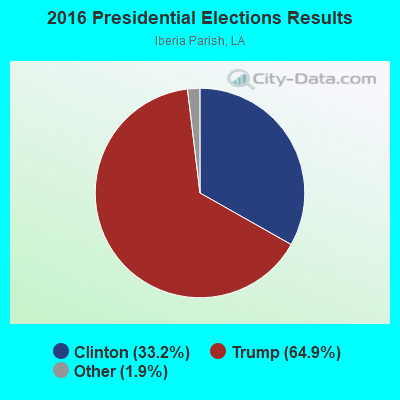
2016 Presidential Elections Results (%) - Democratic Party (Clinton)
2016 Presidential Elections Results (%) - Republican Party (Trump)
2016 Presidential Elections Results (%) - Other
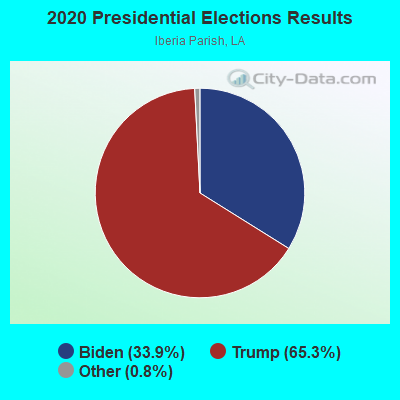
2020 Presidential Elections Results (%) - Democratic Party (Biden)
2020 Presidential Elections Results (%) - Republican Party (Trump)
2020 Presidential Elections Results (%) - Other
Ancestries Reported - Arab (%)
Ancestries Reported - Czech (%)
Ancestries Reported - Danish (%)
Ancestries Reported - Dutch (%)
Ancestries Reported - English (%)
Ancestries Reported - French (%)
Ancestries Reported - French Canadian (%)
Ancestries Reported - German (%)
Ancestries Reported - Greek (%)
Ancestries Reported - Hungarian (%)
Ancestries Reported - Irish (%)
Ancestries Reported - Italian (%)
Ancestries Reported - Lithuanian (%)
Ancestries Reported - Norwegian (%)
Ancestries Reported - Polish (%)
Ancestries Reported - Portuguese (%)
Ancestries Reported - Russian (%)
Ancestries Reported - Scotch-Irish (%)
Ancestries Reported - Scottish (%)
Ancestries Reported - Slovak (%)
Ancestries Reported - Subsaharan African (%)
Ancestries Reported - Swedish (%)
Ancestries Reported - Swiss (%)
Ancestries Reported - Ukrainian (%)
Ancestries Reported - United States (%)
Ancestries Reported - Welsh (%)
Ancestries Reported - West Indian (%)
Ancestries Reported - Other (%)
Educational Attainment - No schooling completed (%)
Educational Attainment - Less than high school (%)
Educational Attainment - High school or equivalent (%)
Educational Attainment - Less than 1 year of college (%)
Educational Attainment - 1 or more years of college (%)
Educational Attainment - Associate degree (%)
Educational Attainment - Bachelor's degree (%)
Educational Attainment - Master's degree (%)
Educational Attainment - Professional school degree (%)
Educational Attainment - Doctorate degree (%)
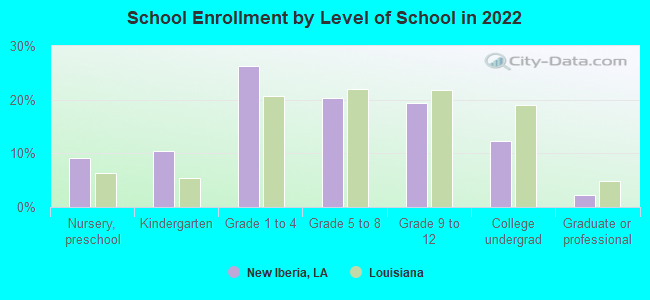
School Enrollment - Nursery, preschool (%)
School Enrollment - Kindergarten (%)
School Enrollment - Grade 1 to 4 (%)
School Enrollment - Grade 5 to 8 (%)
School Enrollment - Grade 9 to 12 (%)
School Enrollment - College undergrad (%)
School Enrollment - Graduate or professional (%)
School Enrollment - Not enrolled in school (%)
School enrollment - Public schools (%)
School enrollment - Private schools (%)
School enrollment - Not enrolled (%)
Median number of rooms in houses and condos
Median number of rooms in apartments
Housing units lacking complete plumbing facilities (%)
Housing units lacking complete kitchen facilities (%)
Density of houses
Urban houses (%)
Rural houses (%)
Households with people 60 years and over (%)
Households with people 65 years and over (%)
Households with people 75 years and over (%)
Households with one or more nonrelatives (%)
Households with no nonrelatives (%)
Population in households (%)
Family households (%)
Nonfamily households (%)
Population in families (%)
Family households with own children (%)
Median number of bedrooms in owner occupied houses
Mean number of bedrooms in owner occupied houses
Median number of bedrooms in renter occupied houses
Mean number of bedrooms in renter occupied houses
Median number of vehichles in owner occupied houses
Mean number of vehichles in owner occupied houses
Median number of vehichles in renter occupied houses
Mean number of vehichles in renter occupied houses
Mortgage status - with mortgage (%)
Mortgage status - with second mortgage (%)
Mortgage status - with home equity loan (%)
Mortgage status - with both second mortgage and home equity loan (%)
Mortgage status - without a mortgage (%)
Average family size
Average family size - White
Average family size - Black or African American
Average family size - Asian
Average family size - Hispanic or Latino
Average family size - American Indian and Alaska Native
Average family size - Multirace
Average family size - Other Race
Geographical mobility - Same house 1 year ago (%)
Geographical mobility - Moved within same county (%)
Geographical mobility - Moved from different county within same state (%)
Geographical mobility - Moved from different state (%)
Geographical mobility - Moved from abroad (%)
Place of birth - Born in state of residence (%)
Place of birth - Born in other state (%)
Place of birth - Native, outside of US (%)
Place of birth - Foreign born (%)
Housing units in structures - 1, detached (%)
Housing units in structures - 1, attached (%)
Housing units in structures - 2 (%)
Housing units in structures - 3 or 4 (%)
Housing units in structures - 5 to 9 (%)
Housing units in structures - 10 to 19 (%)
Housing units in structures - 20 to 49 (%)
Housing units in structures - 50 or more (%)
Housing units in structures - Mobile home (%)
Housing units in structures - Boat, RV, van, etc. (%)
House/condo owner moved in on average (years ago)
Renter moved in on average (years ago)
Year householder moved into unit - Moved in 1999 to March 2000 (%)
Year householder moved into unit - Moved in 1995 to 1998 (%)
Year householder moved into unit - Moved in 1990 to 1994 (%)
Year householder moved into unit - Moved in 1980 to 1989 (%)
Year householder moved into unit - Moved in 1970 to 1979 (%)
Year householder moved into unit - Moved in 1969 or earlier (%)
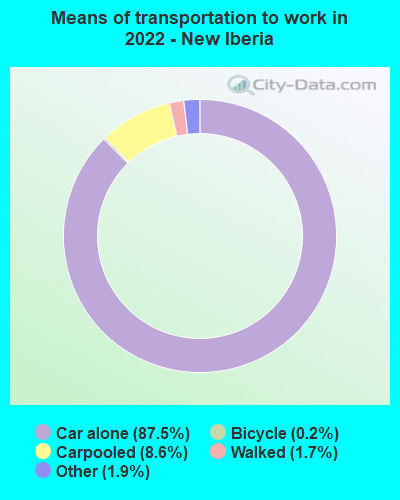
Means of transportation to work - Drove car alone (%)
Means of transportation to work - Carpooled (%)
Means of transportation to work - Public transportation (%)
Means of transportation to work - Bus or trolley bus (%)
Means of transportation to work - Streetcar or trolley car (%)
Means of transportation to work - Subway or elevated (%)
Means of transportation to work - Railroad (%)
Means of transportation to work - Ferryboat (%)
Means of transportation to work - Taxicab (%)
Means of transportation to work - Motorcycle (%)
Means of transportation to work - Bicycle (%)
Means of transportation to work - Walked (%)
Means of transportation to work - Other means (%)
Working at home (%)
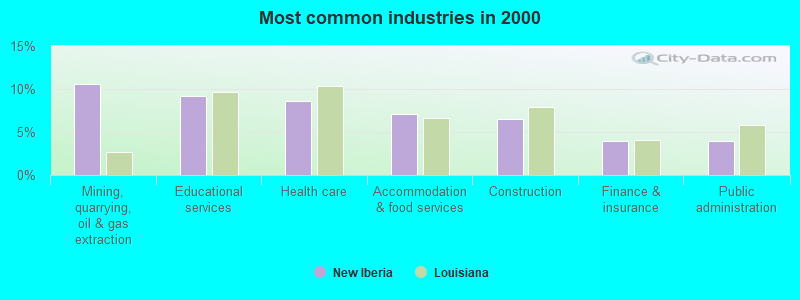
Industry diversity
Most Common Industries - Agriculture, forestry, fishing and hunting, and mining (%)
Most Common Industries - Agriculture, forestry, fishing and hunting (%)
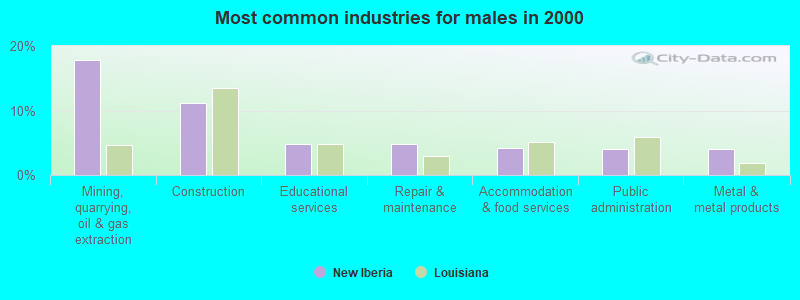
Most Common Industries - Mining, quarrying, and oil and gas extraction (%)
Most Common Industries - Construction (%)
Most Common Industries - Manufacturing (%)
Most Common Industries - Wholesale trade (%)
Most Common Industries - Retail trade (%)
Most Common Industries - Transportation and warehousing, and utilities (%)
Most Common Industries - Transportation and warehousing (%)
Most Common Industries - Utilities (%)
Most Common Industries - Information (%)
Most Common Industries - Finance and insurance, and real estate and rental and leasing (%)
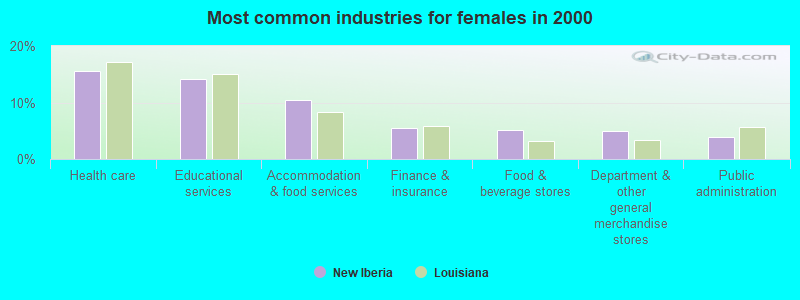
Most Common Industries - Finance and insurance (%)
Most Common Industries - Real estate and rental and leasing (%)
Most Common Industries - Professional, scientific, and management, and administrative and waste management services (%)
Most Common Industries - Professional, scientific, and technical services (%)
Most Common Industries - Management of companies and enterprises (%)
Most Common Industries - Administrative and support and waste management services (%)
Most Common Industries - Educational services, and health care and social assistance (%)
Most Common Industries - Educational services (%)
Most Common Industries - Health care and social assistance (%)
Most Common Industries - Arts, entertainment, and recreation, and accommodation and food services (%)
Most Common Industries - Arts, entertainment, and recreation (%)
Most Common Industries - Accommodation and food services (%)
Most Common Industries - Other services, except public administration (%)
Most Common Industries - Public administration (%)
Occupation diversity
Most Common Occupations - Management, business, science, and arts occupations (%)
Most Common Occupations - Management, business, and financial occupations (%)
Most Common Occupations - Management occupations (%)
Most Common Occupations - Business and financial operations occupations (%)
Most Common Occupations - Computer, engineering, and science occupations (%)
Most Common Occupations - Computer and mathematical occupations (%)
Most Common Occupations - Architecture and engineering occupations (%)
Most Common Occupations - Life, physical, and social science occupations (%)
Most Common Occupations - Education, legal, community service, arts, and media occupations (%)
Most Common Occupations - Community and social service occupations (%)
Most Common Occupations - Legal occupations (%)
Most Common Occupations - Education, training, and library occupations (%)
Most Common Occupations - Arts, design, entertainment, sports, and media occupations (%)
Most Common Occupations - Healthcare practitioners and technical occupations (%)
Most Common Occupations - Health diagnosing and treating practitioners and other technical occupations (%)
Most Common Occupations - Health technologists and technicians (%)
Most Common Occupations - Service occupations (%)
Most Common Occupations - Healthcare support occupations (%)
Most Common Occupations - Protective service occupations (%)
Most Common Occupations - Fire fighting and prevention, and other protective service workers including supervisors (%)
Most Common Occupations - Law enforcement workers including supervisors (%)
Most Common Occupations - Food preparation and serving related occupations (%)
Most Common Occupations - Building and grounds cleaning and maintenance occupations (%)
Most Common Occupations - Personal care and service occupations (%)
Most Common Occupations - Sales and office occupations (%)
Most Common Occupations - Sales and related occupations (%)
Most Common Occupations - Office and administrative support occupations (%)
Most Common Occupations - Natural resources, construction, and maintenance occupations (%)
Most Common Occupations - Farming, fishing, and forestry occupations (%)
Most Common Occupations - Construction and extraction occupations (%)
Most Common Occupations - Installation, maintenance, and repair occupations (%)
Most Common Occupations - Production, transportation, and material moving occupations (%)
Most Common Occupations - Production occupations (%)
Most Common Occupations - Transportation occupations (%)
Most Common Occupations - Material moving occupations (%)
People in Group quarters - Institutionalized population (%)
People in Group quarters - Correctional institutions (%)
People in Group quarters - Federal prisons and detention centers (%)
People in Group quarters - Halfway houses (%)
People in Group quarters - Local jails and other confinement facilities (including police lockups) (%)
People in Group quarters - Military disciplinary barracks (%)
People in Group quarters - State prisons (%)
People in Group quarters - Other types of correctional institutions (%)
People in Group quarters - Nursing homes (%)
People in Group quarters - Hospitals/wards, hospices, and schools for the handicapped (%)
People in Group quarters - Hospitals/wards and hospices for chronically ill (%)
People in Group quarters - Hospices or homes for chronically ill (%)
People in Group quarters - Military hospitals or wards for chronically ill (%)
People in Group quarters - Other hospitals or wards for chronically ill (%)
People in Group quarters - Hospitals or wards for drug/alcohol abuse (%)
People in Group quarters - Mental (Psychiatric) hospitals or wards (%)
People in Group quarters - Schools, hospitals, or wards for the mentally retarded (%)
People in Group quarters - Schools, hospitals, or wards for the physically handicapped (%)
People in Group quarters - Institutions for the deaf (%)
People in Group quarters - Institutions for the blind (%)
People in Group quarters - Orthopedic wards and institutions for the physically handicapped (%)
People in Group quarters - Wards in general hospitals for patients who have no usual home elsewhere (%)
People in Group quarters - Wards in military hospitals for patients who have no usual home elsewhere (%)
People in Group quarters - Juvenile institutions (%)
People in Group quarters - Long-term care (%)
People in Group quarters - Homes for abused, dependent, and neglected children (%)
People in Group quarters - Residential treatment centers for emotionally disturbed children (%)
People in Group quarters - Training schools for juvenile delinquents (%)
People in Group quarters - Short-term care, detention or diagnostic centers for delinquent children (%)
People in Group quarters - Type of juvenile institution unknown (%)
People in Group quarters - Noninstitutionalized population (%)
People in Group quarters - College dormitories (includes college quarters off campus) (%)
People in Group quarters - Military quarters (%)
People in Group quarters - On base (%)
People in Group quarters - Barracks, unaccompanied personnel housing (UPH), (Enlisted/Officer), ;and similar group living quarters for military personnel (%)
People in Group quarters - Transient quarters for temporary residents (%)
People in Group quarters - Military ships (%)
People in Group quarters - Group homes (%)
People in Group quarters - Homes or halfway houses for drug/alcohol abuse (%)
People in Group quarters - Homes for the mentally ill (%)
People in Group quarters - Homes for the mentally retarded (%)
People in Group quarters - Homes for the physically handicapped (%)
People in Group quarters - Other group homes (%)
People in Group quarters - Religious group quarters (%)
People in Group quarters - Dormitories (%)
People in Group quarters - Agriculture workers' dormitories on farms (%)
People in Group quarters - Job Corps and vocational training facilities (%)
People in Group quarters - Other workers' dormitories (%)
People in Group quarters - Crews of maritime vessels (%)
People in Group quarters - Other nonhousehold living situations (%)
People in Group quarters - Other noninstitutional group quarters (%)
Residents speaking English at home (%)
Residents speaking English at home - Born in the United States (%)
Residents speaking English at home - Native, born elsewhere (%)
Residents speaking English at home - Foreign born (%)
Residents speaking Spanish at home (%)
Residents speaking Spanish at home - Born in the United States (%)
Residents speaking Spanish at home - Native, born elsewhere (%)
Residents speaking Spanish at home - Foreign born (%)
Residents speaking other language at home (%)
Residents speaking other language at home - Born in the United States (%)
Residents speaking other language at home - Native, born elsewhere (%)
Residents speaking other language at home - Foreign born (%)
Class of Workers - Employee of private company (%)
Class of Workers - Self-employed in own incorporated business (%)
Class of Workers - Private not-for-profit wage and salary workers (%)
Class of Workers - Local government workers (%)
Class of Workers - State government workers (%)
Class of Workers - Federal government workers (%)
Class of Workers - Self-employed workers in own not incorporated business and Unpaid family workers (%)
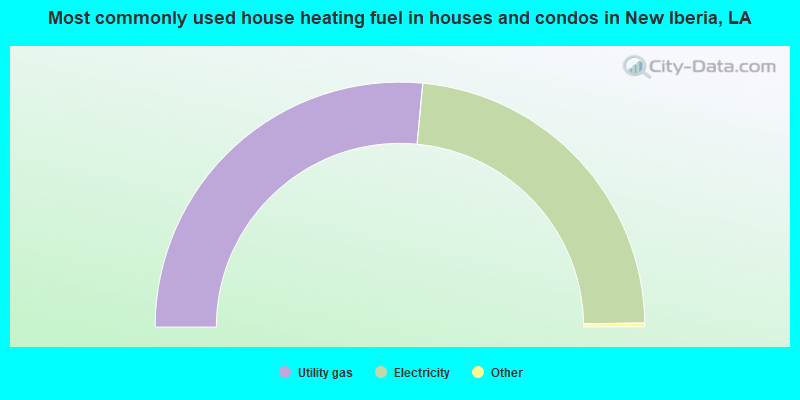
House heating fuel used in houses and condos - Utility gas (%)
House heating fuel used in houses and condos - Bottled, tank, or LP gas (%)
House heating fuel used in houses and condos - Electricity (%)
House heating fuel used in houses and condos - Fuel oil, kerosene, etc. (%)
House heating fuel used in houses and condos - Coal or coke (%)
House heating fuel used in houses and condos - Wood (%)
House heating fuel used in houses and condos - Solar energy (%)
House heating fuel used in houses and condos - Other fuel (%)
House heating fuel used in houses and condos - No fuel used (%)
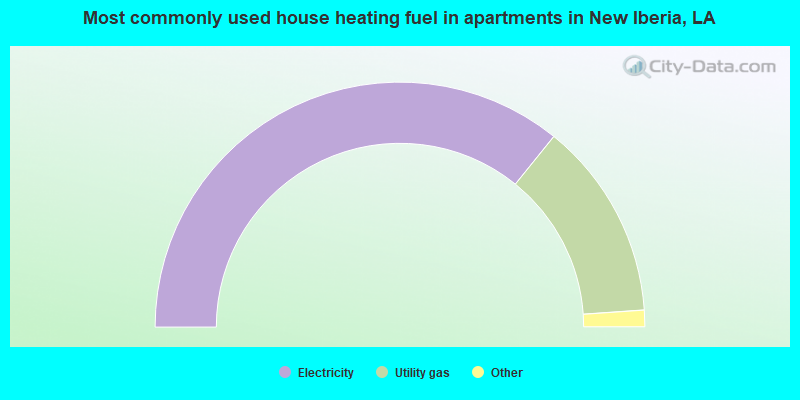
House heating fuel used in apartments - Utility gas (%)
House heating fuel used in apartments - Bottled, tank, or LP gas (%)
House heating fuel used in apartments - Electricity (%)
House heating fuel used in apartments - Fuel oil, kerosene, etc. (%)
House heating fuel used in apartments - Coal or coke (%)
House heating fuel used in apartments - Wood (%)
House heating fuel used in apartments - Solar energy (%)
House heating fuel used in apartments - Other fuel (%)
House heating fuel used in apartments - No fuel used (%)
Armed forces status - In Armed Forces (%)
Armed forces status - Civilian (%)
Armed forces status - Civilian - Veteran (%)
Armed forces status - Civilian - Nonveteran (%)
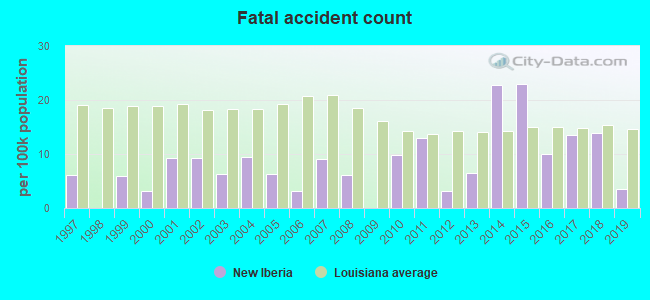
Fatal accidents locations in years 2005-2021
Fatal accidents locations in 2005
Fatal accidents locations in 2006
Fatal accidents locations in 2007
Fatal accidents locations in 2008
Fatal accidents locations in 2009
Fatal accidents locations in 2010
Fatal accidents locations in 2011
Fatal accidents locations in 2012
Fatal accidents locations in 2013
Fatal accidents locations in 2014
Fatal accidents locations in 2015
Fatal accidents locations in 2016
Fatal accidents locations in 2017
Fatal accidents locations in 2018
Fatal accidents locations in 2019
Fatal accidents locations in 2020
Fatal accidents locations in 2021
Alcohol use - People drinking some alcohol every month (%)
Alcohol use - People not drinking at all (%)
Alcohol use - Average days/month drinking alcohol
Alcohol use - Average drinks/week
Alcohol use - Average days/year people drink much
Audiometry - Average condition of hearing (%)
Audiometry - People that can hear a whisper from across a quiet room (%)
Audiometry - People that can hear normal voice from across a quiet room (%)
Audiometry - Ears ringing, roaring, buzzing (%)
Audiometry - Had a job exposure to loud noise (%)
Audiometry - Had off-work exposure to loud noise (%)
Blood Pressure & Cholesterol - Has high blood pressure (%)
Blood Pressure & Cholesterol - Checking blood pressure at home (%)
Blood Pressure & Cholesterol - Frequently checking blood cholesterol (%)
Blood Pressure & Cholesterol - Has high cholesterol level (%)
Consumer Behavior - Money monthly spent on food at supermarket/grocery store
Consumer Behavior - Money monthly spent on food at other stores
Consumer Behavior - Money monthly spent on eating out
Consumer Behavior - Money monthly spent on carryout/delivered foods
Consumer Behavior - Income spent on food at supermarket/grocery store (%)
Consumer Behavior - Income spent on food at other stores (%)
Consumer Behavior - Income spent on eating out (%)
Consumer Behavior - Income spent on carryout/delivered foods (%)
Current Health Status - General health condition (%)
Current Health Status - Blood donors (%)
Current Health Status - Has blood ever tested for HIV virus (%)
Current Health Status - Left-handed people (%)
Dermatology - People using sunscreen (%)
Diabetes - Diabetics (%)
Diabetes - Had a blood test for high blood sugar (%)
Diabetes - People taking insulin (%)
Diet Behavior & Nutrition - Diet health (%)
Diet Behavior & Nutrition - Milk product consumption (# of products/month)
Diet Behavior & Nutrition - Meals not home prepared (#/week)
Diet Behavior & Nutrition - Meals from fast food or pizza place (#/week)
Diet Behavior & Nutrition - Ready-to-eat foods (#/month)
Diet Behavior & Nutrition - Frozen meals/pizza (#/month)
Drug Use - People that ever used marijuana or hashish (%)
Drug Use - Ever used hard drugs (%)
Drug Use - Ever used any form of cocaine (%)
Drug Use - Ever used heroin (%)
Drug Use - Ever used methamphetamine (%)
Health Insurance - People covered by health insurance (%)
Kidney Conditions-Urology - Avg. # of times urinating at night
Medical Conditions - People with asthma (%)
Medical Conditions - People with anemia (%)
Medical Conditions - People with psoriasis (%)
Medical Conditions - People with overweight (%)
Medical Conditions - Elderly people having difficulties in thinking or remembering (%)
Medical Conditions - People who ever received blood transfusion (%)
Medical Conditions - People having trouble seeing even with glass/contacts (%)
Medical Conditions - People with arthritis (%)
Medical Conditions - People with gout (%)
Medical Conditions - People with congestive heart failure (%)
Medical Conditions - People with coronary heart disease (%)
Medical Conditions - People with angina pectoris (%)
Medical Conditions - People who ever had heart attack (%)
Medical Conditions - People who ever had stroke (%)
Medical Conditions - People with emphysema (%)
Medical Conditions - People with thyroid problem (%)
Medical Conditions - People with chronic bronchitis (%)
Medical Conditions - People with any liver condition (%)
Medical Conditions - People who ever had cancer or malignancy (%)
Mental Health - People who have little interest in doing things (%)
Mental Health - People feeling down, depressed, or hopeless (%)
Mental Health - People who have trouble sleeping or sleeping too much (%)
Mental Health - People feeling tired or having little energy (%)
Mental Health - People with poor appetite or overeating (%)
Mental Health - People feeling bad about themself (%)
Mental Health - People who have trouble concentrating on things (%)
Mental Health - People moving or speaking slowly or too fast (%)
Mental Health - People having thoughts they would be better off dead (%)
Oral Health - Average years since last visit a dentist
Oral Health - People embarrassed because of mouth (%)
Oral Health - People with gum disease (%)
Oral Health - General health of teeth and gums (%)
Oral Health - Average days a week using dental floss/device
Oral Health - Average days a week using mouthwash for dental problem
Oral Health - Average number of teeth
Pesticide Use - Households using pesticides to control insects (%)
Pesticide Use - Households using pesticides to kill weeds (%)
Physical Activity - People doing vigorous-intensity work activities (%)
Physical Activity - People doing moderate-intensity work activities (%)
Physical Activity - People walking or bicycling (%)
Physical Activity - People doing vigorous-intensity recreational activities (%)
Physical Activity - People doing moderate-intensity recreational activities (%)
Physical Activity - Average hours a day doing sedentary activities
Physical Activity - Average hours a day watching TV or videos
Physical Activity - Average hours a day using computer
Physical Functioning - People having limitations keeping them from working (%)
Physical Functioning - People limited in amount of work they can do (%)
Physical Functioning - People that need special equipment to walk (%)
Physical Functioning - People experiencing confusion/memory problems (%)
Physical Functioning - People requiring special healthcare equipment (%)
Prescription Medications - Average number of prescription medicines taking
Preventive Aspirin Use - Adults 40+ taking low-dose aspirin (%)
Reproductive Health - Vaginal deliveries (%)
Reproductive Health - Cesarean deliveries (%)
Reproductive Health - Deliveries resulted in a live birth (%)
Reproductive Health - Pregnancies resulted in a delivery (%)
Reproductive Health - Women breastfeeding newborns (%)
Reproductive Health - Women that had a hysterectomy (%)
Reproductive Health - Women that had both ovaries removed (%)
Reproductive Health - Women that have ever taken birth control pills (%)
Reproductive Health - Women taking birth control pills (%)
Reproductive Health - Women that have ever used Depo-Provera or injectables (%)
Reproductive Health - Women that have ever used female hormones (%)
Sexual Behavior - People 18+ that ever had sex (vaginal, anal, or oral) (%)
Sexual Behavior - Males 18+ that ever had vaginal sex with a woman (%)
Sexual Behavior - Males 18+ that ever performed oral sex on a woman (%)
Sexual Behavior - Males 18+ that ever had anal sex with a woman (%)
Sexual Behavior - Males 18+ that ever had any sex with a man (%)
Sexual Behavior - Females 18+ that ever had vaginal sex with a man (%)
Sexual Behavior - Females 18+ that ever performed oral sex on a man (%)
Sexual Behavior - Females 18+ that ever had anal sex with a man (%)
Sexual Behavior - Females 18+ that ever had any kind of sex with a woman (%)
Sexual Behavior - Average age people first had sex
Sexual Behavior - Average number of female sex partners in lifetime (males 18+)
Sexual Behavior - Average number of female vaginal sex partners in lifetime (males 18+)
Sexual Behavior - Average age people first performed oral sex on a woman (18+)
Sexual Behavior - Average number of woman performed oral sex on in lifetime (18+)
Sexual Behavior - Average number of male sex partners in lifetime (males 18+)
Sexual Behavior - Average number of male anal sex partners in lifetime (males 18+)
Sexual Behavior - Average age people first performed oral sex on a man (18+)
Sexual Behavior - Average number of male oral sex partners in lifetime (18+)
Sexual Behavior - People using protection when performing oral sex (%)
Sexual Behavior - Average number of times people have vaginal or anal sex a year
Sexual Behavior - People having sex without condom (%)
Sexual Behavior - Average number of male sex partners in lifetime (females 18+)
Sexual Behavior - Average number of male vaginal sex partners in lifetime (females 18+)
Sexual Behavior - Average number of female sex partners in lifetime (females 18+)
Sexual Behavior - Circumcised males 18+ (%)
Sleep Disorders - Average hours sleeping at night
Sleep Disorders - People that has trouble sleeping (%)
Smoking-Cigarette Use - People smoking cigarettes (%)
Taste & Smell - People 40+ having problems with smell (%)
Taste & Smell - People 40+ having problems with taste (%)
Taste & Smell - People 40+ that ever had wisdom teeth removed (%)
Taste & Smell - People 40+ that ever had tonsils teeth removed (%)
Taste & Smell - People 40+ that ever had a loss of consciousness because of a head injury (%)
Taste & Smell - People 40+ that ever had a broken nose or other serious injury to face or skull (%)
Taste & Smell - People 40+ that ever had two or more sinus infections (%)
Weight - Average height (inches)
Weight - Average weight (pounds)
Weight - Average BMI
Weight - People that are obese (%)
Weight - People that ever were obese (%)
Weight - People trying to lose weight (%)
Officers per 1,000 residents here:
1.94Louisiana average:
3.44
Latest news from New Iberia, LA collected exclusively by city-data.com from local newspapers, TV, and radio stations
Ancestries: French (8.8%), American (6.2%), Cajun (3.7%), English (2.3%), French Canadian (1.6%), Moroccan (1.3%).
Current Local Time:
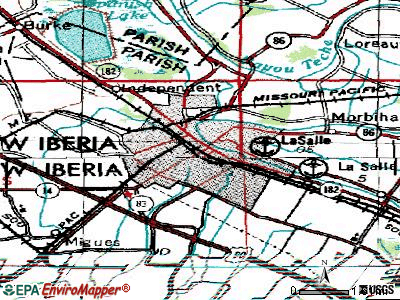
Land area: 10.6 square miles.
Population density: 2,601 people per square mile (average).
697 residents are foreign born (1.2% Asia , 0.8% Latin America , 0.3% Africa ).
This city:
2.5%Louisiana:
4.2%
Median real estate property taxes paid for housing units with mortgages in 2022: $795 (0.4%)Median real estate property taxes paid for housing units with no mortgage in 2022: $275 (0.3%)
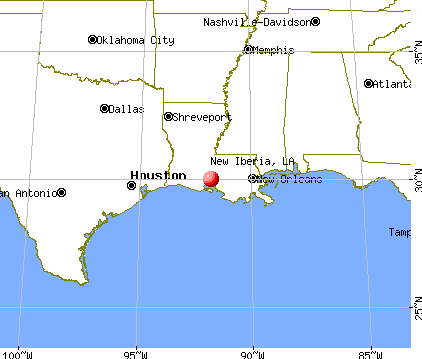
Nearest city with pop. 50,000+: Lafayette, LA
Nearest city with pop. 200,000+: Baton Rouge, LA
Nearest city with pop. 1,000,000+: Houston, TX
Nearest cities:
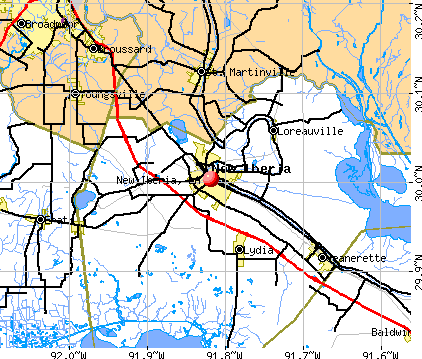
Latitude: 30.00 N, Longitude: 91.82 W
Daytime population change due to commuting: +3,905 (+14.1%)Workers who live and work in this city: 6,499 (62.3%)
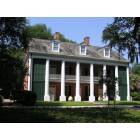
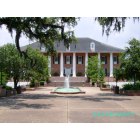
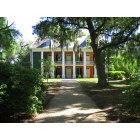
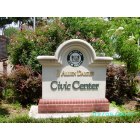
New Iberia tourist attractions:
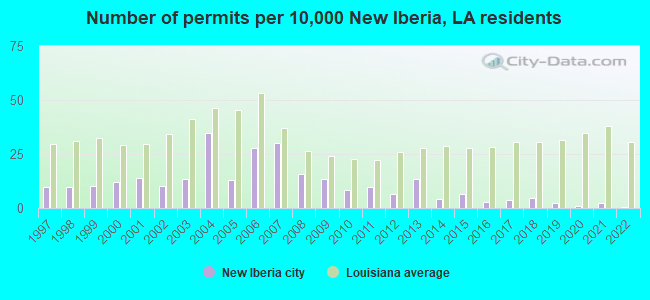
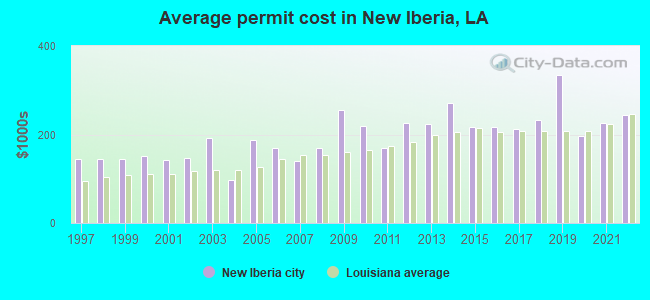
Single-family new house construction building permits:
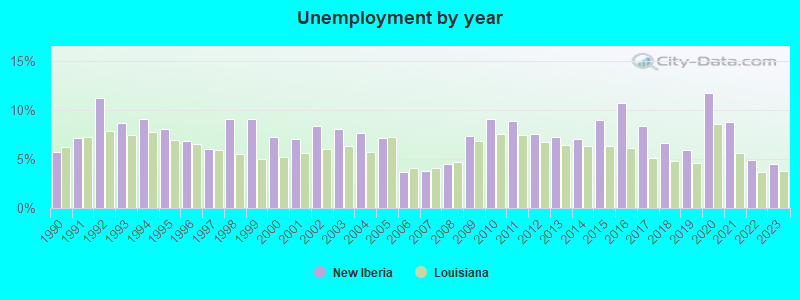
2022: 2 buildings , average cost: $245,0002021: 8 buildings , average cost: $226,7002020: 3 buildings , average cost: $197,0002019: 8 buildings , average cost: $334,1002018: 15 buildings , average cost: $232,3002017: 12 buildings , average cost: $211,7002016: 9 buildings , average cost: $217,5002015: 21 buildings , average cost: $216,9002014: 13 buildings , average cost: $271,4002013: 44 buildings , average cost: $223,1002012: 21 buildings , average cost: $225,5002011: 32 buildings , average cost: $168,6002010: 27 buildings , average cost: $219,8002009: 44 buildings , average cost: $254,8002008: 52 buildings , average cost: $168,8002007: 98 buildings , average cost: $140,5002006: 90 buildings , average cost: $170,3002005: 42 buildings , average cost: $187,1002004: 114 buildings , average cost: $97,4002003: 44 buildings , average cost: $190,9002002: 33 buildings , average cost: $147,2002001: 46 buildings , average cost: $142,1002000: 39 buildings , average cost: $151,4001999: 33 buildings , average cost: $144,8001998: 31 buildings , average cost: $144,8001997: 32 buildings , average cost: $144,800Unemployment in December 2023:
Population change in the 1990s: +498 (+1.6%).
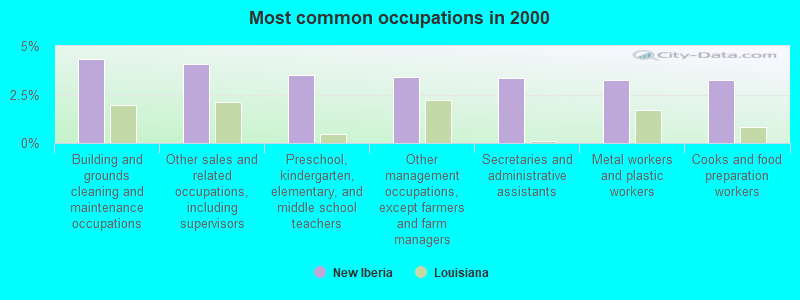
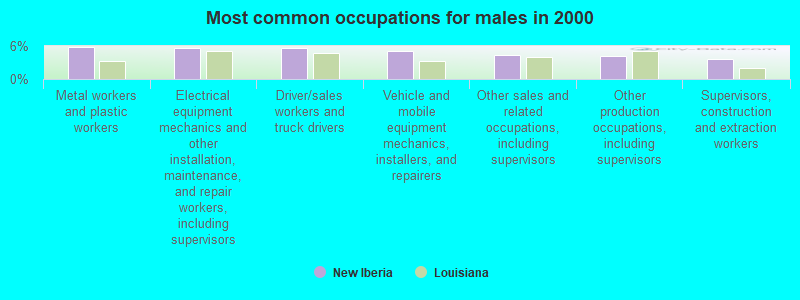
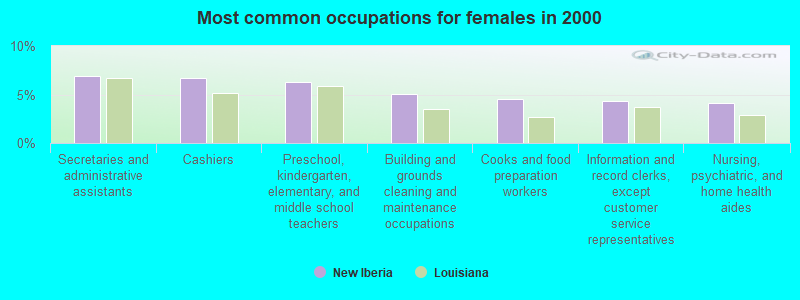
Most common occupations in New Iberia, LA (%)
Both Males Females
Building and grounds cleaning and maintenance occupations (4.3%)
Other sales and related occupations, including supervisors (4.1%)
Preschool, kindergarten, elementary, and middle school teachers (3.5%)
Other management occupations, except farmers and farm managers (3.4%)
Secretaries and administrative assistants (3.3%)
Metal workers and plastic workers (3.3%)
Cooks and food preparation workers (3.2%)
Metal workers and plastic workers (5.8%)
Electrical equipment mechanics and other installation, maintenance, and repair workers, including supervisors (5.7%)
Driver/sales workers and truck drivers (5.7%)
Vehicle and mobile equipment mechanics, installers, and repairers (5.1%)
Other sales and related occupations, including supervisors (4.4%)
Other production occupations, including supervisors (4.3%)
Supervisors, construction and extraction workers (3.7%)
Secretaries and administrative assistants (6.9%)
Cashiers (6.7%)
Preschool, kindergarten, elementary, and middle school teachers (6.3%)
Building and grounds cleaning and maintenance occupations (5.0%)
Cooks and food preparation workers (4.5%)
Information and record clerks, except customer service representatives (4.3%)
Nursing, psychiatric, and home health aides (4.2%)
Air pollution and air quality trends(lower is better)
AQI Ozone
Tornado activity:
New Iberia-area historical tornado activity is slightly below Louisiana state average. It is 36% greater than the overall U.S. average.
On 10/29/1974, a category F3 (max. wind speeds 158-206 mph) tornado 15.7 miles away from the New Iberia city center injured one person and caused between $50,000 and $500,000 in damages.
On 4/21/1977, a category F3 tornado 22.0 miles away from the city center killed one person and injured 11 people and caused between $500,000 and $5,000,000 in damages.
Earthquake activity:
New Iberia-area historical earthquake activity is significantly above Louisiana state average. It is 48% smaller than the overall U.S. average. On 5/17/2012 at 08:12:00, a magnitude 4.8 (4.8 MW, Depth: 3.1 mi, Class: Light, Intensity: IV - V) earthquake occurred 201.4 miles away from the city center On 9/10/2006 at 14:56:08, a magnitude 5.9 (5.9 MB, 5.5 MS, 5.8 MW, Class: Moderate, Intensity: VI - VII) earthquake occurred 409.3 miles away from the city center On 10/24/1997 at 08:35:17, a magnitude 4.9 (4.8 MB, 4.2 MS, 4.9 LG, Depth: 6.2 mi) earthquake occurred 281.6 miles away from New Iberia center On 5/6/2018 at 16:47:09, a magnitude 4.6 (4.6 MB, Depth: 6.2 mi) earthquake occurred 240.6 miles away from the city center On 6/30/1994 at 01:08:24, a magnitude 4.2 (4.2 MB, Depth: 6.2 mi) earthquake occurred 175.5 miles away from the city center On 9/2/2013 at 23:51:15, a magnitude 4.3 (4.3 MW, Depth: 2.9 mi) earthquake occurred 203.3 miles away from New Iberia center Magnitude types: regional Lg-wave magnitude (LG), body-wave magnitude (MB), surface-wave magnitude (MS), moment magnitude (MW) Natural disasters: The number of natural disasters in Iberia Parish (23) is greater than the US average (15).Major Disasters (Presidential) Declared: 16Emergencies Declared: 3Hurricanes: 15, Floods: 4, Tropical Storms: 3, Storms: 2, Other: 1 (Note: some incidents may be assigned to more than one category). Main business address for: UNIFAB INTERNATIONAL INC SHIP & BOAT BUILDING & REPAIRING ).
Hospitals in New Iberia: ANGEL CARE HOSPICE (203 WEST MAIN STREET, SUITE 108) DAUTERIVE HOSPITAL (Proprietary, provides emergency services, 600 NORTH LEWIS STREET) DEHART COMMUNITY HOME (1412 DEHART STREET) IBERIA GENERAL HOSPITAL AND MEDICAL CENTER (Government - Hospital District or Authority, provides emergency services, 2315 E MAIN STREET) IBERIA REHABILITATION HOSPITAL (Proprietary, 532 JEFFERSON TERRACE STREET) IBERIA REHABILITATION HOSPITAL (532 JEFFERSON TERRANCE STREET) IBERIAN GROUP HOME (2618 OLD JEANERETTE ROAD) NORTHSIDE GROUP HOME (3610 NORTHSIDE ROAD) ORANGE GROVE GROUP HOME (1003 ORANGE GROVE AVENUE) PATOUT COMMUNITY HOME (1609 PATOUT STREET) SUGAR MILL COMMUNITY HOME (2201 OLD SUGARMILL ROAD) Amtrak station: NEW IBERIA (WASHINGTON ST. & RAILROAD TRACKS)
.
Services: partially wheelchair accessible, enclosed waiting area, public restrooms, public payphones, free short-term parking, free long-term parking.
Colleges/universities with over 2000 students nearest to New Iberia:
University of Louisiana at Lafayette (about 19 miles; Lafayette, LA ; Full-time enrollment: 14,493)
Acadiana Technical College-Lafayette Campus (about 21 miles; Lafayette, LA ; FT enrollment: 2,378)
South Louisiana Community College (about 21 miles; Lafayette, LA ; FT enrollment: 2,519)
Baton Rouge Community College (about 51 miles; Baton Rouge, LA ; FT enrollment: 5,744)
Southern University and A & M College (about 53 miles; Baton Rouge, LA ; FT enrollment: 5,837)
Louisiana State University and Agricultural & Mechanical College (about 54 miles; Baton Rouge, LA ; FT enrollment: 27,321)
Nicholls State University (about 63 miles; Thibodaux, LA ; FT enrollment: 5,997)
Public high schools in New Iberia:
Private high schools in New Iberia: CATHOLIC HIGH SCHOOL Students: 835, Location: 1301 DE LASALLE DR, Grades: 4-12)
HIGHLAND BAPTIST CHRISTIAN SCHOOL Students: 470, Location: 708 ANGERS ST, Grades: PK-12)
ASSEMBLY CHRISTIAN SCHOOL Students: 316, Location: 4219 E ADMIRAL DOYLE DR, Grades: PK-12)
Biggest public elementary/middle schools in New Iberia: NORTH LEWIS ELEMENTARY SCHOOL Students: 708, Location: 604 NORTH LEWIS STREET, Grades: PK-6)MAGNOLIA ELEMENTARY Students: 580, Location: 3116 EAST ADMIRAL DOYLE DRIVE, Grades: PK-6)IBERIA MIDDLE SCHOOL Students: 579, Location: 613 WEEKS ISLAND ROAD, Grades: 7-8)PESSON ADDITION ELEMENTARY SCHOOL Students: 540, Location: 619 BROUSSARD STREET, Grades: PK-6)JEFFERSON ISLAND ROAD ELEMENTARY Students: 534, Location: 6007 JEFFERSON ISLAND ROAD, Grades: PK-6)CANEVIEW ELEMENTARY SCHOOL Students: 529, Location: 5301 HWY 90 FRONTAGE ROAD, Grades: PK-6)DASPIT ROAD ELEMENTARY SCHOOL Students: 503, Location: 1103 DASPIT ROAD, Grades: PK-6)CENTER STREET ELEMENTARY SCHOOL Students: 470, Location: 1520 CENTER STREET, Grades: PK-6)BELLE PLACE MIDDLE SCHOOL Students: 463, Location: 4110 LOREAUVILLE ROAD, Grades: 7-8)ANDERSON MIDDLE SCHOOL Students: 425, Location: 1059 ANDERSON STREET, Grades: 7-8)Private elementary/middle schools in New Iberia: ST EDWARD SCHOOL Students: 360, Location: 175 PORTER ST, Grades: PK-3)EPIPHANY DAY SCHOOL Students: 124, Location: 120 JEFFERSON ST, Grades: PK-5)
See full list of schools located in New Iberia Library in New Iberia: IBERIA PARISH LIBRARY Operating income: $2,320,770; Location: 445 E. MAIN ST.; 195,685 books ; 9,400 audio materials ; 12,084 video materials ; 12 local licensed databases ; 60 state licensed databases ; 355 print serial subscriptions )
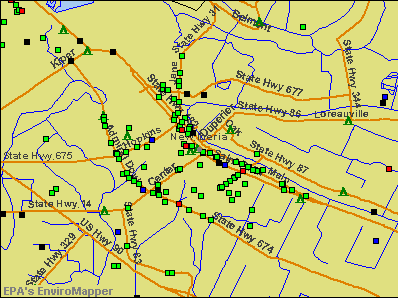
Notable locations in New Iberia: (A) , Gerbent Oak (B) , Iberia Parish Office (C) , Shadows on the Teche Museum (D) , New Iberia Police Department - Traffic Section (E) , New Iberia City Marshal's Office (F) , Iberia Parish Sheriff's Department (G) , Consolata Home (H) , Iberia Parish Library West End Branch (I) , Iberia Parish Library Saint Peter Street Branch (J) , Iberia Parish Library Parkview Branch (K) , New Iberia Police Department - Detectives (L) , New Iberia Police Department - Maintenance Shop (M) , Iberia Parish Sheriff's Department (N) , Iberia Parish Health Unit (O) , New Iberia Fire Department Station 1 (P) , New Iberia Manor North (Q) , New Iberia Manor South (R) , Bayou Art Gallery (S) , Iberia Parish Courthouse (T) . Display/hide their locations on the map
Churches in New Iberia include: (A) , Highland Baptist Church (B) , Assembly of God Church (C) , Church of Christ (D) , The Church of Jesus Christ of Latter Day Saints (E) , Congregation Gates of Prayer (F) , Cottrell Chapel Christian Methodist Episcopal Church (G) , Episcopal Church of the Epiphany (H) , First Assembly of God Church (I) . Display/hide their locations on the map
Cemetery: (1) . Display/hide its location on the map
Parks in New Iberia include: (1) , New Iberia City Park (2) , West End Park (3) . Display/hide their locations on the map
Tourist attractions:
Hotels:
Courts:
Birthplace of: Kathleen Blanco, Lucky Cannon - Professional wrestler, David Thibodaux - Writer, Kerry Joseph - Football player, Mark Roman - 2005 NFL player (Green Bay Packers, born : Mar 26, 1977), Mike Fontenot - 2005 Major League Baseball player (Chicago Cubs, born : Jun 9, 1980), Robert C. Lawson - Cleric, Soko Richardson - Rhythm and blues drummer, Taylor Barras - Member of Louisiana State Legislature, Yvonne Levy Kushner - Stage actor.
Iberia Parish has a predicted average indoor radon screening level less than 2 pCi/L (pico curies per liter) - Low Potential Drinking water stations with addresses in New Iberia and their reported violations in the past:
RIP VAN WINKLE GARDENS (Address: 10106 JEFFERSON ISLAND ROAD Population served: 30, Groundwater):
Past monitoring violations:
3 routine major monitoring violations
Average household size: This city:
2.6 peopleLouisiana:
2.5 people
Percentage of family households: This city:
66.2%Whole state:
67.1%
Percentage of households with unmarried partners: This city:
7.4%Whole state:
6.8%
Likely homosexual households (counted as self-reported same-sex unmarried-partner households)
Lesbian couples: 0.4% of all households Gay men: 0.2% of all households
People in group quarters in New Iberia in 2010:
367 people in nursing facilities/skilled-nursing facilities
44 people in other noninstitutional facilities
16 people in emergency and transitional shelters (with sleeping facilities) for people experiencing homelessness
6 people in group homes intended for adults
People in group quarters in New Iberia in 2000:
405 people in other noninstitutional group quarters
362 people in nursing homes
55 people in hospitals/wards and hospices for chronically ill
55 people in other hospitals or wards for chronically ill
50 people in mental (psychiatric) hospitals or wards
31 people in homes for the mentally ill
19 people in homes for the mentally retarded
5 people in homes or halfway houses for drug/alcohol abuse
5 people in religious group quarters
Banks with most branches in New Iberia (2011 data):
Regions Bank: New Iberia Main Branch, Downtown Branch, North Lewis Branch, Lydia Branch. Info updated 2011/02/24: Bank assets: $123,368.2 mil, Deposits: $98,301.3 mil, headquarters in Birmingham, AL, positive income , Commercial Lending Specialization, 1778 total offices , Holding Company: Regions Financial Corporation
JPMorgan Chase Bank, National Association: Southside Branch, Center Street Branch, North Lewis Branch. Info updated 2011/11/10: Bank assets: $1,811,678.0 mil, Deposits: $1,190,738.0 mil, headquarters in Columbus, OH, positive income , International Specialization, 5577 total offices , Holding Company: Jpmorgan Chase & Co.
Teche Federal Bank: West Saint Peter Street Branch, at 1120 Jefferson Terrace Boulevard, North Lewis Street Branch. Info updated 2011/08/02: Bank assets: $810.9 mil, Deposits: $605.0 mil, local headquarters , positive income , Mortgage Lending Specialization, 19 total offices , Holding Company: Teche Holding Company
Iberiabank: Admiral Doyle Branch, North Lewis Street Branch, St. Peter Street Branch. Info updated 2011/06/08: Bank assets: $11,676.7 mil, Deposits: $9,387.9 mil, headquarters in Lafayette, LA, positive income , Commercial Lending Specialization, 187 total offices , Holding Company: Iberiabank Corporation
MidSouth Bank, National Association: East Admiral Doyle Branch, Bonne Terre Branch, Super 1 Food Branch. Info updated 2012/01/09: Bank assets: $1,396.1 mil, Deposits: $1,192.9 mil, headquarters in Lafayette, LA, positive income , Commercial Lending Specialization, 44 total offices , Holding Company: Midsouth Bancorp, Inc.
Teche Bank & Trust Co.: Coteau Branch at 4515 Coteau Road, branch established on 1995/07/17; Jane Street Branch at 1407 Jane Street, branch established on 2010/06/24. Info updated 2006/05/10: Bank assets: $87.0 mil, Deposits: $70.6 mil, headquarters in Saint Martinville, LA, positive income , Mortgage Lending Specialization, 5 total offices , Holding Company: Louisiana Community Bancorp, Inc.
Community First Bank: Northside Branch at 403 Emile Verret Street, branch established on 2001/05/30; at 535 Jefferson Terrance Boulevard, branch established on 1999/05/10. Info updated 2008/06/27: Bank assets: $246.3 mil, Deposits: $222.0 mil, local headquarters , positive income , Commercial Lending Specialization, 4 total offices , Holding Company: Community First Bancshares, Inc.
Capital One, National Association: Parkview - Drive-Up Branch at 940 Parkview Drive, branch established on 2000/02/15; Admiral Doyle (New Iberia) Branch at 1123 Admiral Odyle Drive, branch established on 1988/07/18. Info updated 2011/07/01: Bank assets: $133,477.8 mil, Deposits: $97,063.7 mil, headquarters in Mclean, VA, positive income , 984 total offices , Holding Company: Capital One Financial Corporation
The First National Bank of Jeanerette: New Iberia Branch at 413 Jefferson Terrace, branch established on 1996/01/16. Info updated 2006/11/03: Bank assets: $198.5 mil, Deposits: $181.1 mil, headquarters in Jeanerette, LA, positive income , 6 total offices , Holding Company: Jeanerette First National Bancorp, Inc.
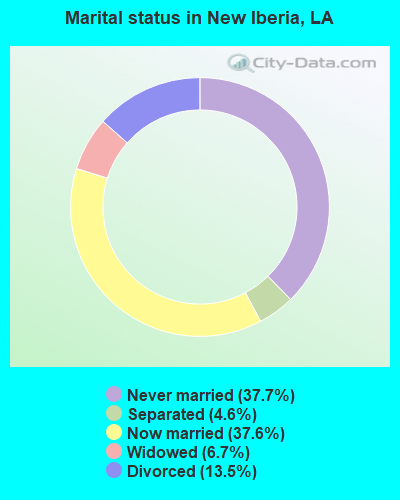
For population 15 years and over in New Iberia:
Never married: 37.7%Now married: 37.6%Separated: 4.6%Widowed: 6.7%Divorced: 13.5% For population 25 years and over in New Iberia:
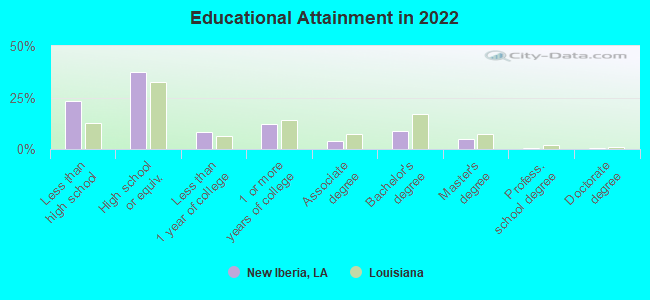
High school or higher: 81.0%Bachelor's degree or higher: 16.3%Graduate or professional degree: 4.8%Unemployed: 11.7%Mean travel time to work (commute): 18.2 minutes
Education Gini index (Inequality in education) Here:
12.3Louisiana average:
11.9
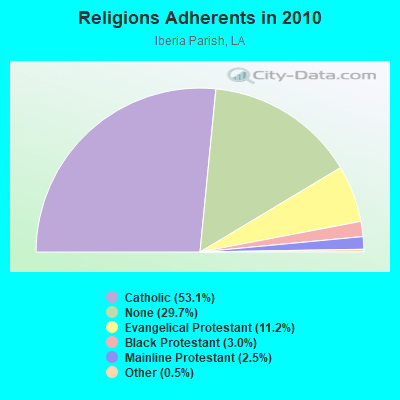
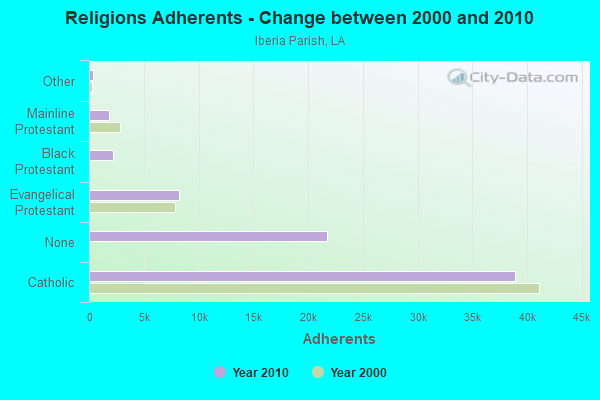
Religion statistics for New Iberia, LA (based on Iberia Parish data)
Religion Adherents Congregations Catholic 38,914 13 Evangelical Protestant 8,188 30 Black Protestant 2,216 8 Mainline Protestant 1,813 11 Other 390 3 None 21,719 -
Source: Clifford Grammich, Kirk Hadaway, Richard Houseal, Dale E.Jones, Alexei Krindatch, Richie Stanley and Richard H.Taylor. 2012. 2010 U.S.Religion Census: Religious Congregations & Membership Study. Association of Statisticians of American Religious Bodies. Jones, Dale E., et al. 2002. Congregations and Membership in the United States 2000. Nashville, TN: Glenmary Research Center. Graphs represent county-level data
Food Environment Statistics: Number of grocery stores : 22Here :
2.94 / 10,000 pop.State :
2.56 / 10,000 pop.
Number of supercenters and club stores : 1This county :
0.13 / 10,000 pop.Louisiana :
0.18 / 10,000 pop.
Number of convenience stores (no gas) : 7Iberia Parish :
0.93 / 10,000 pop.State :
1.29 / 10,000 pop.
Number of convenience stores (with gas) : 39Iberia Parish :
5.20 / 10,000 pop.State :
4.49 / 10,000 pop.
Number of full-service restaurants : 27This county :
3.60 / 10,000 pop.State :
5.92 / 10,000 pop.
Adult diabetes rate : Iberia Parish :
12.8%State :
10.9%
Adult obesity rate : Iberia Parish :
31.0%Louisiana :
29.2%
Low-income preschool obesity rate : Iberia Parish :
9.7%Louisiana :
13.7%
Health and Nutrition: Healthy diet rate : New Iberia:
49.1%Louisiana:
49.4%
Average overall health of teeth and gums : Here:
45.4%Louisiana:
46.5%
People feeling badly about themselves : New Iberia:
20.6%Louisiana:
20.3%
People not drinking alcohol at all : New Iberia:
12.8%Louisiana:
11.4%
Average hours sleeping at night : Overweight people : New Iberia:
34.5%Louisiana:
34.5%
General health condition : Here:
54.6%Louisiana:
55.8%
Average condition of hearing : This city:
79.5%Louisiana:
80.2%
More about Health and Nutrition of New Iberia, LA Residents
Local government employment and payroll (March 2022)
Function
Full-time employees
Monthly full-time payroll
Average yearly full-time wage
Part-time employees
Monthly part-time payroll
Police Protection - Officers
55 $268,008 $58,474 0 $0 Firefighters
53 $261,881 $59,294 0 $0 Sewerage
27 $94,180 $41,858 3 $3,821 Streets and Highways
25 $61,409 $29,476 0 $0 Parks and Recreation
16 $35,370 $26,528 9 $2,955 Police - Other
12 $44,823 $44,823 0 $0 Judicial and Legal
10 $36,145 $43,374 0 $0 Financial Administration
8 $27,621 $41,432 1 $958 Other Government Administration
7 $28,775 $49,329 7 $7,047 Housing and Community Development (Local)
6 $22,091 $44,182 1 $626 Other and Unallocable
3 $14,799 $59,196 0 $0
Totals for Government
222 $895,101 $48,384 21 $15,408
New Iberia government finances - Expenditure in 2021 (per resident):
Construction - Sewerage: $1,817,000 ($66.14)
Parks and Recreation: $201,000 ($7.32)Regular Highways: $49,000 ($1.78)Current Operations - Police Protection: $6,650,000 ($242.06)
Local Fire Protection: $5,821,000 ($211.88)Sewerage: $5,462,000 ($198.81)Solid Waste Management: $4,779,000 ($173.95)Housing and Community Development: $2,086,000 ($75.93)Regular Highways: $2,031,000 ($73.93)Central Staff Services: $1,572,000 ($57.22)Judicial and Legal Services: $1,516,000 ($55.18)Parks and Recreation: $918,000 ($33.41)Financial Administration: $682,000 ($24.82)General - Other: $439,000 ($15.98)General Public Buildings: $318,000 ($11.58)Protective Inspection and Regulation - Other: $272,000 ($9.90)Public Welfare - Other: $199,000 ($7.24)General - Interest on Debt: $825,000 ($30.03)
Intergovernmental to Local - Other - Police Protection: $192,000 ($6.99)
Other - General - Other: $51,000 ($1.86)Other Capital Outlay - Regular Highways: $37,000 ($1.35)
Judicial and Legal Services: $14,000 ($0.51)Housing and Community Development: $4,000 ($0.15)Total Salaries and Wages: $9,769,000 ($355.59)
New Iberia government finances - Revenue in 2021 (per resident):
Charges - Sewerage: $4,243,000 ($154.44)
Other: $542,000 ($19.73)Housing and Community Development: $274,000 ($9.97)Parks and Recreation: $32,000 ($1.16)Federal Intergovernmental - Housing and Community Development: $2,018,000 ($73.45)
Public Welfare: $1,514,000 ($55.11)Local Intergovernmental - Other: $1,892,000 ($68.87)
Sewerage: $801,000 ($29.16)General Local Government Support: $102,000 ($3.71)Miscellaneous - General Revenue - Other: $1,794,000 ($65.30)
Fines and Forfeits: $156,000 ($5.68)Interest Earnings: $142,000 ($5.17)Rents: $20,000 ($0.73)State Intergovernmental - Public Welfare: $3,659,000 ($133.19)
Other: $26,000 ($0.95)General Local Government Support: $13,000 ($0.47)Tax - General Sales and Gross Receipts: $17,473,000 ($636.01)
Property: $4,698,000 ($171.00)Occupation and Business License - Other: $1,247,000 ($45.39)Other License: $222,000 ($8.08)Alcoholic Beverage Sales: $47,000 ($1.71)Alcoholic Beverage License: $18,000 ($0.66)
New Iberia government finances - Debt in 2021 (per resident):
Long Term Debt - Beginning Outstanding - Unspecified Public Purpose: $29,142,000 ($1060.75)
Outstanding Unspecified Public Purpose: $27,340,000 ($995.16)Retired Unspecified Public Purpose: $1,802,000 ($65.59)
New Iberia government finances - Cash and Securities in 2021 (per resident):
Other Funds - Cash and Securities: $22,510,000 ($819.35)
Sinking Funds - Cash and Securities: $5,116,000 ($186.22)
Businesses in New Iberia, LA
Name Count Name Count
AT&T 3 Lowe's 1 Advance Auto Parts 1 McDonald's 4 AutoZone 1 Nike 2 Baskin-Robbins 1 Nissan 1 Blockbuster 1 Office Depot 1 Burger King 3 Papa John's Pizza 1 CVS 2 Payless 1 Chevrolet 1 Pizza Hut 2 Church's Chicken 1 Popeyes 1 Circle K 1 Quiznos 1 Comfort Suites 1 RadioShack 1 Curves 1 Ramada 1 DHL 1 Rite Aid 2 Days Inn 1 Ruby Tuesday 1 Domino's Pizza 2 Rue21 1 FedEx 5 SONIC Drive-In 2 Ford 1 Sears 1 GNC 2 Starbucks 1 GameStop 1 Subway 4 Goodwill 1 Super 8 1 H&R Block 1 T-Mobile 2 Hardee's 1 Taco Bell 1 Holiday Inn 2 Toyota 1 Honda 1 U-Haul 4 KFC 1 UPS 7 Kmart 1 Verizon Wireless 1 La Quinta 1 Waffle House 1 La-Z-Boy 2 Walgreens 2 Lane Furniture 3 Walmart 1 Little Caesars Pizza 1 Wendy's 2
Strongest AM radio stations in New Iberia:
KANE (1240 AM; 1 kW; NEW IBERIA, LA; Owner: COASTAL BROADCASTING OF LAFOURCHE, L.L.C.)
KNIR (1360 AM; 1 kW; NEW IBERIA, LA; Owner: RADIO MARIA, INC.)
KDYS (1520 AM; 10 kW; LAFAYETTE, LA; Owner: CITADEL BROADCASTING COMPANY)
KVOL (1330 AM; 5 kW; LAFAYETTE, LA; Owner: CITADEL BROADCASTING COMPANY)
WWL (870 AM; 50 kW; NEW ORLEANS, LA; Owner: ENTERCOM NEW ORLEANS LICENSE, LLC)
WLNO (1060 AM; 50 kW; NEW ORLEANS, LA; Owner: COMMUNICOM CO. OF LOUISIANA, L.P.)
KROF (960 AM; 1 kW; ABBEVILLE, LA; Owner: ABBEVILLE BROADCASTING SERVICE, INC.)
KTIB (640 AM; 5 kW; THIBODAUX, LA; Owner: LA TERR BROADCASTING CORPORATION)
KJCB (770 AM; 1 kW; LAFAYETTE, LA; Owner: R & M BROADCASTING, INC.)
WSKR (1210 AM; 10 kW; DENHAM SPRINGS, LA; Owner: CAPSTAR TX LIMITED PARTNERSHIP)
WJBO (1150 AM; 5 kW; BATON ROUGE, LA; Owner: CAPSTAR TX LIMITED PARTNERSHIP)
WOMN (1110 AM; daytime; 30 kW; FRANKLINTON, LA; Owner: PITTMAN BROADCASTING SERVICES, LLC.)
KTRH (740 AM; 50 kW; HOUSTON, TX; Owner: AMFM TEXAS LICENSES LIMITED PARTNERSHIP)
Strongest FM radio stations in New Iberia:
KTDY (99.9 FM; LAFAYETTE, LA; Owner: REGENT BROADCASTING OF LAFAYETTE, INC.)
KXKC (99.1 FM; NEW IBERIA, LA; Owner: BONIN BROADCASTING CORPORATION)
KRKA (107.9 FM; ERATH, LA; Owner: REGENT BROADCASTING OF LAFAYETTE, INC.)
KFTE (96.5 FM; BREAUX BRIDGE, LA; Owner: REGENT BROADCASTING OF LAFAYETTE, INC.)
KMDL (97.3 FM; KAPLAN, LA; Owner: REGENT BROADCASTING OF LAFAYETTE, INC.)
KRVS (88.7 FM; LAFAYETTE, LA; Owner: THE UNIVERSITY OF LOUISIANA AT LAFAYETTE)
K219DB (91.7 FM; NEW IBERIA, LA; Owner: BIBLE BROADCASTING NETWORK, INC.)
KAJN-FM (102.9 FM; CROWLEY, LA; Owner: RICE CAPITAL BROADCASTING CO., INC.)
WYPY (100.7 FM; BATON ROUGE, LA; Owner: GUARANTY BROADCASTING COMPANY OF BATON ROUGE, LLC)
WYNK-FM (101.5 FM; BATON ROUGE, LA; Owner: CAPSTAR TX LIMITED PARTNERSHIP)
KOOJ (93.7 FM; NEW IBERIA, LA; Owner: CITADEL BROADCASTING COMPANY)
K213DG (90.5 FM; NEW IBERIA, LA; Owner: FAMILY WORSHIP CENTER CHURCH, INC.)
KQIS (102.1 FM; BASILE, LA; Owner: THIRD PARTNER BROADCASTING, INC.)
WFMF (102.5 FM; BATON ROUGE, LA; Owner: CAPSTAR TX LIMITED PARTNERSHIP)
KSMB (94.5 FM; LAFAYETTE, LA; Owner: CITADEL BROADCASTING COMPANY)
WDGL (98.1 FM; BATON ROUGE, LA; Owner: GUARANTY BROADCASTING COMPANY OF BATON ROUGE, LLC)
KFXZ (106.3 FM; MAURICE, LA; Owner: CITADEL BROADCASTING COMPANY)
KRRQ (95.5 FM; LAFAYETTE, LA; Owner: CITADEL BROADCASTING COMPANY)
KSJY (90.9 FM; LAFAYETTE, LA; Owner: AMERICAN FAMILY ASSOCIATION, INC.)
KPEL-FM (105.1 FM; ABBEVILLE, LA; Owner: ABBEVILLE BROADCASTING SERVICE, INC.)
TV broadcast stations around New Iberia:
K49DE (Channel 49; NEW IBERIA, LA; Owner: TRINITY BROADCASTING NETWORK)
K54FT (Channel 54; NEW IBERIA, LA; Owner: GULF MANAGEMENT II, L.L.C.)
KATC (Channel 3; LAFAYETTE, LA; Owner: KATC COMMUNICATIONS, INC.)
KAJN-LP (Channel 40; LAFAYETTE, LA; Owner: RICE CAPITAL BROADCASTING COMPANY, INC.)
WBRZ-TV (Channel 2; BATON ROUGE, LA; Owner: LOUISIANA TELEVISION BROADCASTING, LLC)
WGMB (Channel 44; BATON ROUGE, LA; Owner: COMCORP OF BATON ROUGE LICENSE CORP.)
KLPB-TV (Channel 24; LAFAYETTE, LA; Owner: LOUISIANA EDUCATIONAL TELEVISION AUTHORITY)
WVLA (Channel 33; BATON ROUGE, LA; Owner: KNIGHT BROADCASTING OF BATON ROUGE LIC. CORP.)
KLFY-TV (Channel 10; LAFAYETTE, LA; Owner: KLFY, L.P.)
WAFB (Channel 9; BATON ROUGE, LA; Owner: WAFB, L.L.C)
KADN (Channel 15; LAFAYETTE, LA; Owner: KADN-15, INC.)
K58GA (Channel 46; LAFAYETTE, LA; Owner: WNTZ-48, INC.)
K58GB (Channel 58; BATON ROUGE, LA; Owner: TRINITY BROADCASTING NETWORK)
K69HD (Channel 69; CHURCH POINT, LA; Owner: GULF MANAGEMENT II, L.L.C.)
KLFT-LP (Channel 21; LAFAYETTE, LA; Owner: K. SANDOVAL BURKE)
National Bridge Inventory (NBI) Statistics 101 Number of bridges3,146ft / 959m Total length $21,384,000 Total costs768,410 Total average daily traffic68,930 Total average daily truck traffic
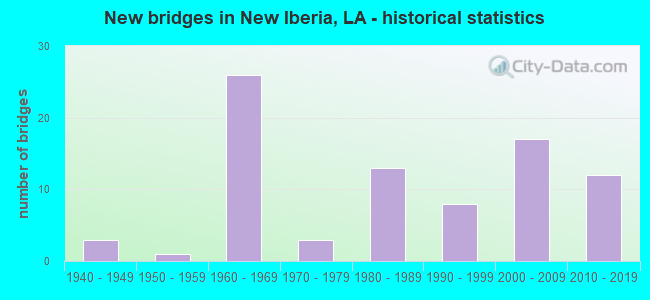
New bridges - historical statistics
3 1940-1949 1 1950-1959 26 1960-1969 3 1970-1979 13 1980-1989 8 1990-1999 17 2000-2009 12 2010-2019
See full National Bridge Inventory statistics for New Iberia, LA
Fire-safe hotels and motels in New Iberia, Louisiana:
Comfort Suites, 2817 Hwy 14, New Iberia, Louisiana 70560 Phone: (337) 367-0855, Fax: (337) 367-0845
Holiday Inn Express & Suites, 318 West Hwy 90 , Frontage Rd, New Iberia, Louisiana 70560 Phone: (337) 408-2700, Fax: (337) 408-2710
Candlewood Suites-New Iberia/Avery Island, 2600 Hwy 14, New Iberia, Louisiana 70560 Phone: (337) 344-5862, Fax: (334) 769-2899
Laquinta Inns & Suites, 611 A Queen City Dr, New Iberia, Louisiana 70560 Phone: (337) 321-6000, Fax: (337) 321-6007
Hampton Inn & Suites, 400 Spanish Towne Blvd, New Iberia, Louisiana 70560 Phone: (337) 321-6700, Fax: (337) 321-6659
La Quinta Inn & Suites New Iberia, 611a Queen City Dr, New Iberia, Louisiana 70560 Phone: (337) 321-6000, Fax: (337) 321-6007
Ramada Conference Center, 2915 Hwy 14, New iberia, Louisiana 70560 Phone: (337) 367-1201, Fax: (337) 367-7877
All 7 fire-safe hotels and motels in New Iberia, Louisiana
Most common first names in New Iberia, LA among deceased individuals Name Count Lived (average)
Joseph 261 71.4 years Mary 229 73.9 years John 182 71.4 years Marie 140 81.9 years James 133 68.6 years Robert 126 71.7 years Charles 103 70.5 years William 98 71.0 years George 98 75.0 years Louis 98 74.8 years
Most common last names in New Iberia, LA among deceased individuals Last name Count Lived (average)
Broussard 358 75.8 years Romero 315 74.6 years Landry 227 76.5 years Hebert 205 75.7 years Leblanc 196 76.1 years Viator 158 76.8 years Derouen 134 75.0 years Bourque 117 74.1 years Delcambre 114 77.4 years Segura 114 75.5 years
New Iberia compared to Louisiana state average:
Median age below state average. Foreign-born population percentage below state average. Length of stay since moving in above state average. New Iberia on our top lists :
#30 on the list of "Top 101 cities with largest percentage of males in industries: mining, quarrying, and oil and gas extraction (population 5,000+)"
#57 on the list of "Top 101 cities with the most residents born in Laos (population 500+)"
#60 on the list of "Top 101 cities with the most people below 50% of the poverty level, excluding cities with 15% or more of residents in college and with the median age below 28 (population 5,000+)"
#46 (70560) on the list of "Top 101 zip codes with the largest percentage of French first ancestries (pop 5,000+)"
#57 on the list of "Top 101 counties with the largest increase in the number of deaths per 1000 residents 2000-2006 to 2007-2013 (pop. 50,000+)"
Top Patent Applicants
William J. Thomas, Iii (12)
Don Umphries (9)
William F. Boelte (9)
Zlatko Salihbegovic (7)
Vernon Joseph Bouligny (7)
Vernon Joseph Bouligny, Jr. (6)
Larry E. Berges (6)
Vernon J. Bouligny (5)
Herman Joseph Schellstede (5)
Rizal Masingkan (5)
Total of 127 patent applications in 2008-2024.


 Recent articles from our blog. Our writers, many of them Ph.D. graduates or candidates, create easy-to-read articles on a wide variety of topics.

 (19.3 miles
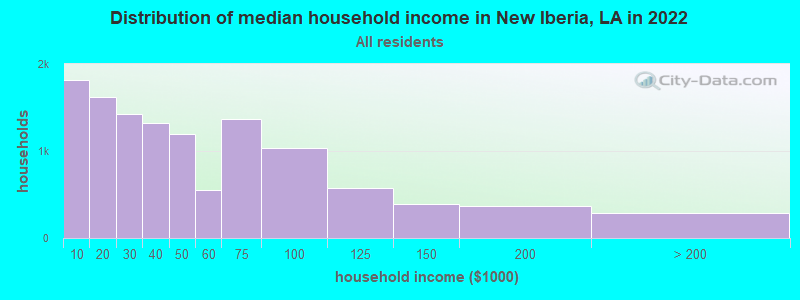

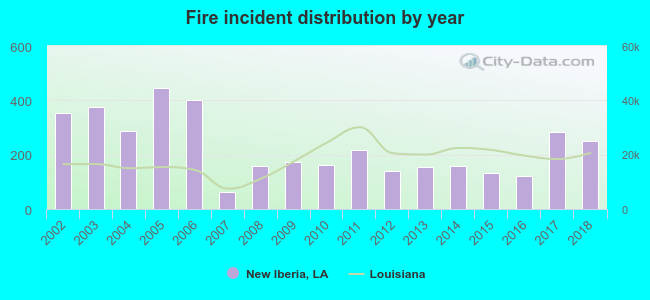 According to the data from the years 2002 - 2018 the average number of fires per year is 228. The highest number of fires - 445 took place in 2005, and the least - 61 in 2007. The data has a declining trend.
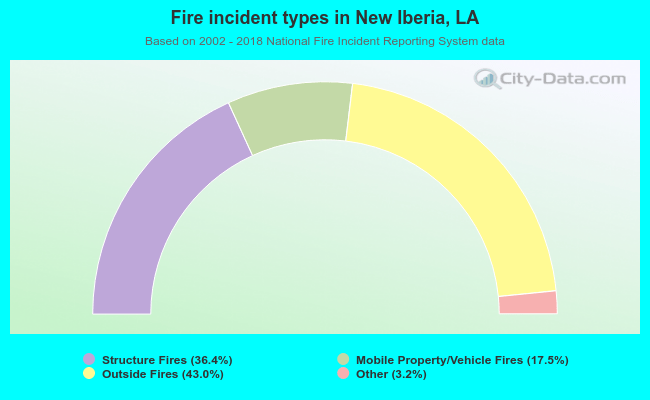 When looking into fire subcategories, the most reports belonged to: Outside Fires (43.0%), and Structure Fires (36.4%).