Races in New Territory, Texas (TX) Detailed Stats
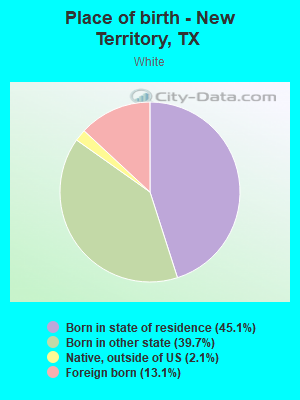
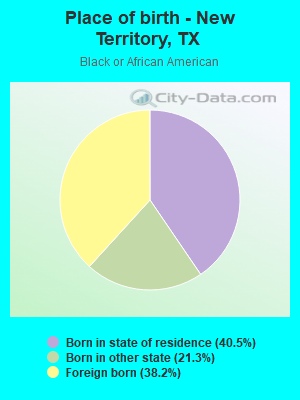
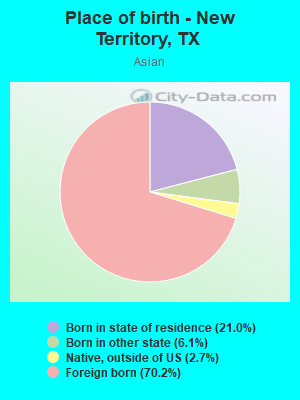
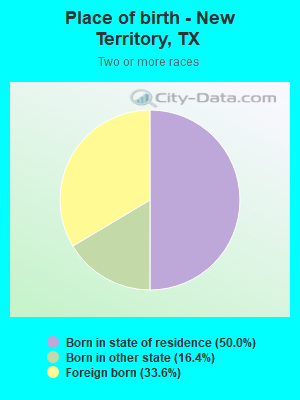
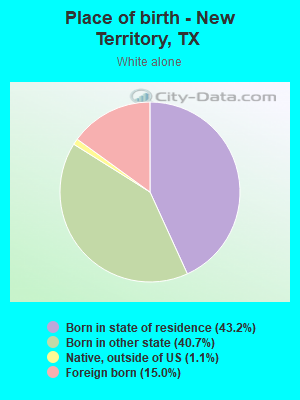
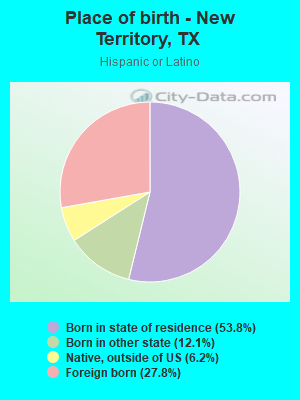
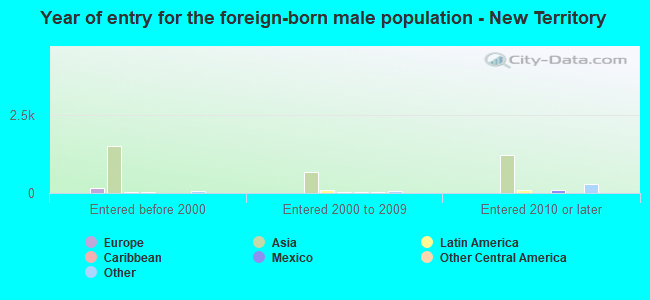
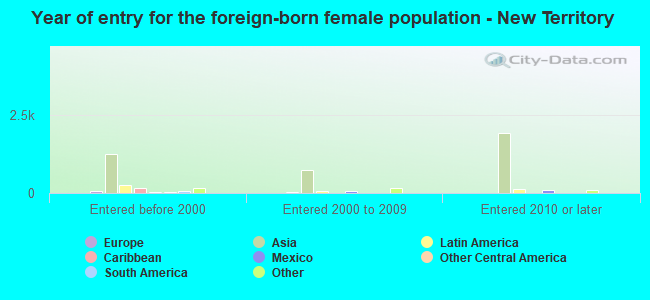
According to 2022 data, the most numerous races in New Territory, TX are Hispanic (1,648 residents), White alone (5,344 residents), and Black alone (1,680 residents). 46.6% of New Territory residents speak English at home. 40.7% of New Territory, TX residents are foreign-born (33.3% born in Asia), which is 58.2% greater than the foreign-born rate of 17.0% across the entire state of Texas.
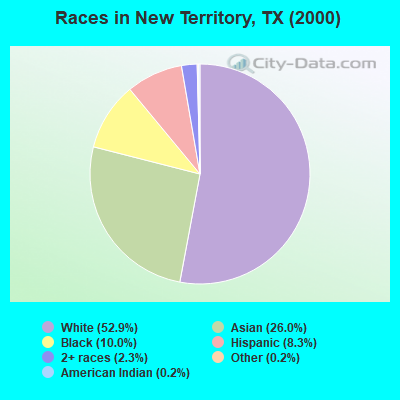
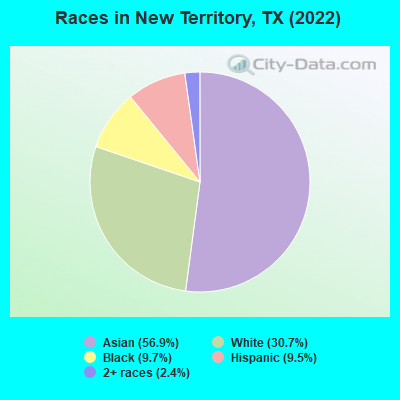
Race distribution in New Territory
2000 2022
10,933,313 52.4% White alone 6,669,666 32.0% Hispanic 2,364,255 11.3% Black alone 554,445 2.7% Asian alone 230,567 1.1% Two or more races 68,859 0.3% American Indian alone 19,958 0.10% Other race alone 10,757 0.05% Native Hawaiian and Other
12,070,642 40.2% Hispanic 11,683,430 38.9% White alone 3,508,706 11.7% Black alone 1,608,173 5.4% Asian alone 956,560 3.2% Two or more races 125,763 0.4% Other race alone 47,023 0.2% American Indian alone 29,275 0.10% Native Hawaiian and Other
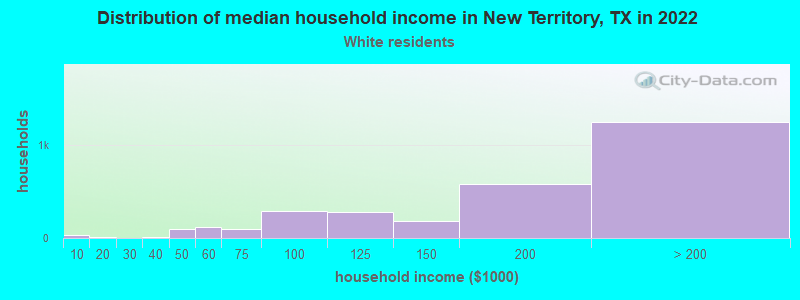
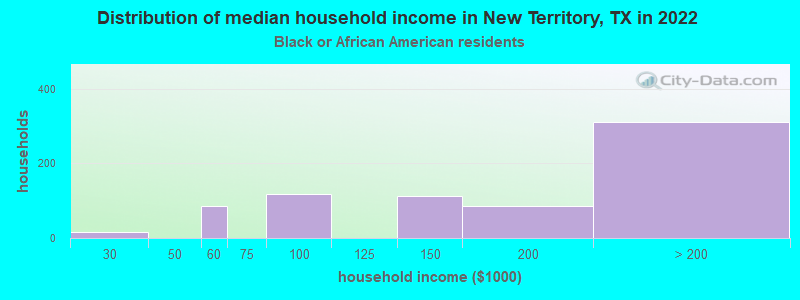
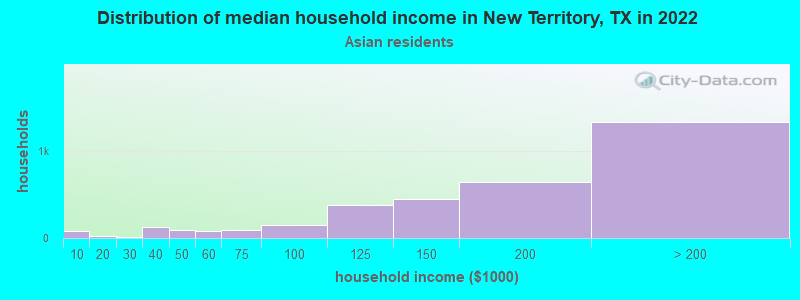
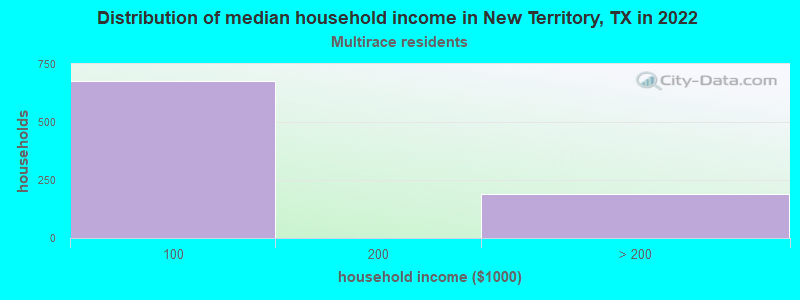
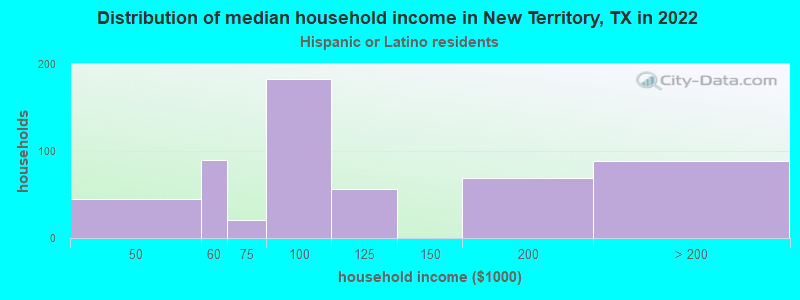
Income and house value in New Territory Median household income in 2022 $199,429 White non-Hispanic householders$187,282 Black householders$95,201 American Indian and Alaska Native householders$199,393 Asian householders$85,070 Some other race householders$106,793 Two or more races householders$125,603 Hispanic or Latino race householdersMedian 2022 house value $534,381 White Non-Hispanic householders$495,984 Black or African American householders$279,249 American Indian or Alaska Native householders $508,677 Asian householders$465,520 Some other race householders$443,307 Two or more races householders$430,297 Hispanic or Latino householders
Median age by race in New Territory
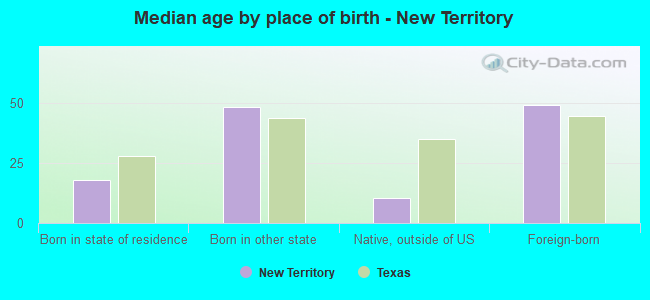
45.2 Median age for White residents46.5 43.1 34.5 Median age for Black or African American residents34.7 26.6 38.8 Median age for Asian residents33.6 40.2 50.4 Median age for Other race residents51.7 Median age for Two or more races residents52.2 24.3 46.8 Median age for White alone residents46.7 47.0 24.3 Median age for Hispanic or Latino residents17.3 23.9
Owner/renter occupied households by race in New Territory
House owners and renters - White residents 1,864 89.4% Owner occupied221 10.6% Renter occupiedHouse owners and renters - Black or African American residents 294 60.9% Owner occupied189 39.1% Renter occupiedHouse owners and renters - Asian residents 2,369 83.6% Owner occupied464 16.4% Renter occupiedHouse owners and renters - Two or more races residents 114 29.7% Owner occupied271 70.3% Renter occupiedHouse owners and renters - White alone residents 1,835 91.9% Owner occupied162 8.1% Renter occupiedHouse owners and renters - Hispanic or Latino residents 251 60.9% Owner occupied161 39.1% Renter occupied
Language usage in New Territory
English speakers - Total 46.6% of residents of New Territory speak English at home.
5.9% of residents speak Spanish at home 829 82.7% Speak English very well174 17.3% Speak English less than very well56.7% of residents speak other language at home 7,542 78.1% Speak English very well2,116 21.9% Speak English less than very well
English speakers - Born in the United States 84.1% of residents of New Territory speak English at home.
0.8% of residents speak Spanish at home 28 100.0% Speak English very well17.5% of residents speak other language at home 610 97.4% Speak English very well16 2.6% Speak English less than very well
English speakers - Native, born elsewhere 32.7% of residents of New Territory speak English at home.
21.6% of residents speak Spanish at home 86 100.0% Speak English very well53.5% of residents speak other language at home 163 76.5% Speak English very well50 23.5% Speak English less than very well
English speakers - Foreign-born 12.3% of residents of New Territory speak English at home.
5.8% of residents speak Spanish at home 306 66.4% Speak English very well155 33.6% Speak English less than very well97.9% of residents speak other language at home 5,741 73.7% Speak English very well2,049 26.3% Speak English less than very well
White (Caucasian) - Speak only English Native:
95.7% (4,884)Foreign-born:
36.1% (288)
White (Caucasian) - Speak another language Native:
8.4% (428)Foreign-born:
69.9% (557)
Black or African American - Speak only English Native:
98.5% (1,125)Foreign-born:
49.0% (292)
Asian - Speak only English Native:
33.5% (941)Foreign-born:
4.6% (328)
Asian - Speak another language Native:
60.4% (1,695)Foreign-born:
93.3% (6,661)
Two or more races - Speak only English Native:
53.8% (643)Foreign-born:
10.4% (59)
Two or more races - Speak another language Native:
16.1% (192)Foreign-born:
94.6% (537)
White alone - Speak only English Native:
96.5% (4,537)Foreign-born:
37.4% (319)
White alone - Speak another language Native:
3.4% (161)Foreign-born:
62.6% (533)
Hispanic or Latino - Speak only English Native:
62.1% (745)Foreign-born:
7.4% (36)
Hispanic or Latino - Speak another language Native:
41.4% (497)Foreign-born:
91.8% (442)
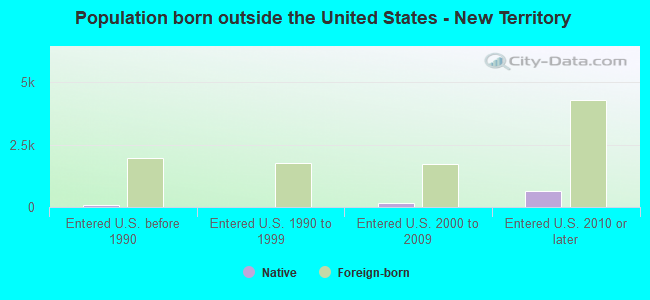
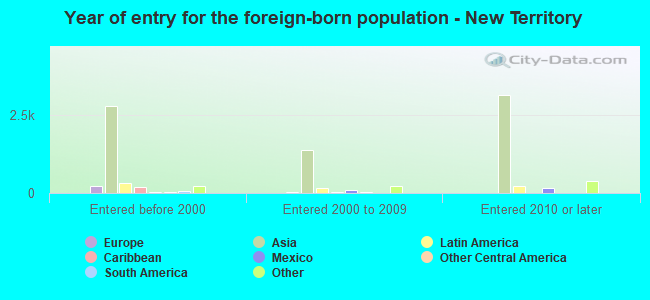
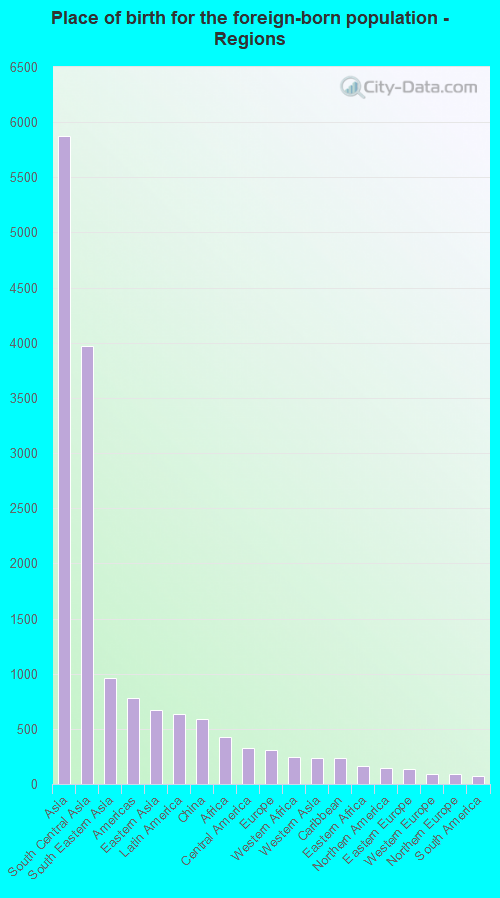
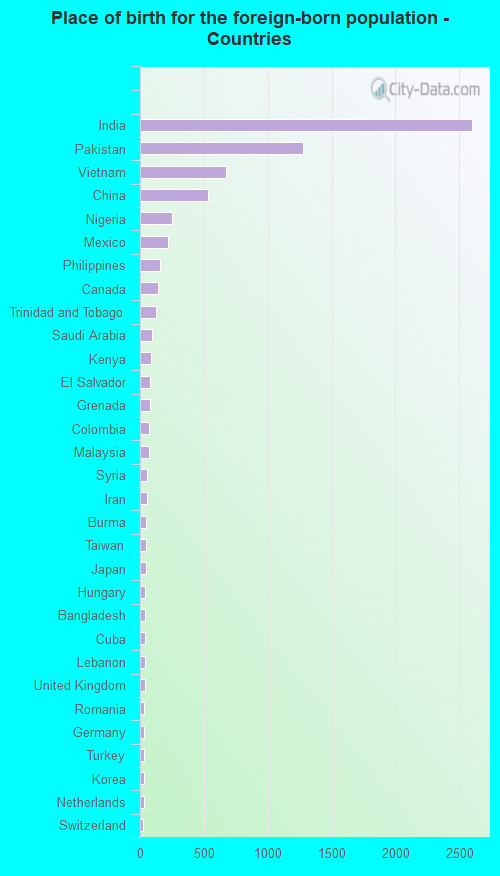
Foreign-born residents in New Territory 7,432 residents are foreign born (33.3% Asia ).
This city:
40.7%Texas:
100.0%
Marital status for residents in New Territory Marital status - White (Caucasian) population 15 years and over
Males 24.0% Never married67.1% Now married1.0% Separated1.0% Widowed6.8% DivorcedFemales 22.1% Never married63.0% Now married0.6% Separated3.4% Widowed10.9% DivorcedWomen who gave birth in the past 12 months Now married:
100.0% (9)Unmarried:
0.0% (0)
Women who did not give birth in the past 12 months Now married:
57.9% (775)Unmarried:
42.1% (565)
Marital status - Black or African American population 15 years and over
Males 42.7% Never married57.3% Now married0.0% Separated0.0% Widowed0.0% DivorcedFemales 62.2% Never married37.8% Now married0.0% Separated0.0% Widowed0.0% DivorcedWomen who did not give birth in the past 12 months Now married:
33.3% (221)Unmarried:
66.7% (443)
Marital status - Asian population 15 years and over
Males 29.2% Never married69.8% Now married0.0% Separated0.0% Widowed1.0% DivorcedFemales 21.0% Never married72.0% Now married1.4% Separated4.2% Widowed1.5% DivorcedWomen who gave birth in the past 12 months Now married:
100.0% (60)Unmarried:
0.0% (0)
Women who did not give birth in the past 12 months Now married:
69.8% (1,928)Unmarried:
30.2% (836)
Marital status - Two or more races population 15 years and over
Males 76.7% Never married23.3% Now married0.0% Separated0.0% Widowed0.0% DivorcedFemales 0.0% Never married57.8% Now married0.0% Separated0.0% Widowed42.2% DivorcedWomen who did not give birth in the past 12 months Now married:
50.6% (282)Unmarried:
49.4% (275)
Marital status - White alone, not Hispanic / Latino population 15 years and over
Males 23.4% Never married68.1% Now married1.1% Separated1.1% Widowed6.3% DivorcedFemales 19.7% Never married66.8% Now married0.8% Separated4.3% Widowed8.4% DivorcedWomen who gave birth in the past 12 months Now married:
100.0% (10)Unmarried:
0.0% (0)
Women who did not give birth in the past 12 months Now married:
59.9% (670)Unmarried:
40.1% (449)
Marital status - Hispanic or Latino population 15 years and over
Males 34.7% Never married53.8% Now married0.0% Separated0.0% Widowed11.5% DivorcedFemales 28.4% Never married46.8% Now married0.0% Separated0.0% Widowed24.8% DivorcedWomen who did not give birth in the past 12 months Now married:
49.5% (275)Unmarried:
50.5% (281)
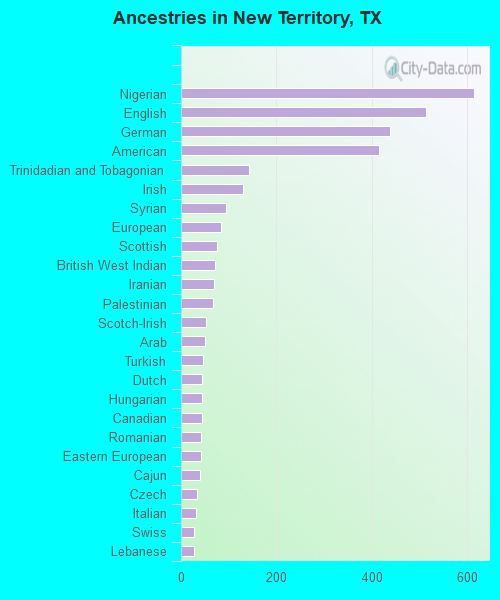
Ancestries in New Territory
615 5.6% Nigerian513 4.7% English438 4.0% German415 3.8% American142 1.3% Trinidadian and Tobagonian130 1.2% Irish95 0.9% Syrian83 0.8% European76 0.7% Scottish72 0.7% British West Indian69 0.6% Iranian68 0.6% Palestinian52 0.5% Scotch-Irish51 0.5% Arab47 0.4% Turkish44 0.4% Dutch44 0.4% Hungarian43 0.4% Canadian41 0.4% Romanian41 0.4% Eastern European40 0.4% Cajun33 0.3% Czech31 0.3% Italian28 0.3% Swiss27 0.2% Lebanese26 0.2% Egyptian24 0.2% Polish23 0.2% African22 0.2% French Canadian14 0.1% Jordanian13 0.1% Cypriot13 0.1% Danish12 0.1% Australian11 0.1% Celtic11 0.1% Russian4 0.04% French
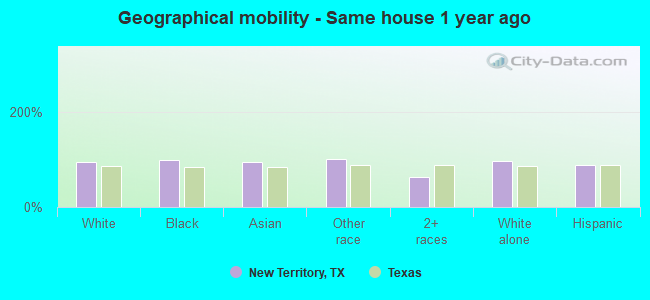
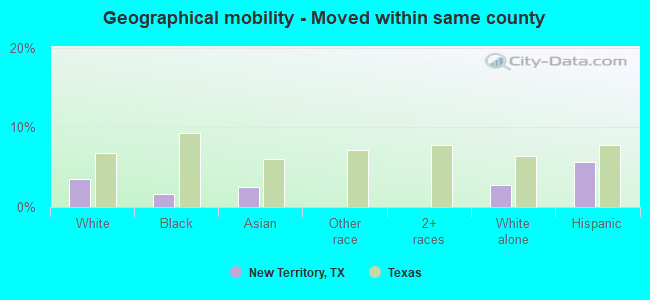
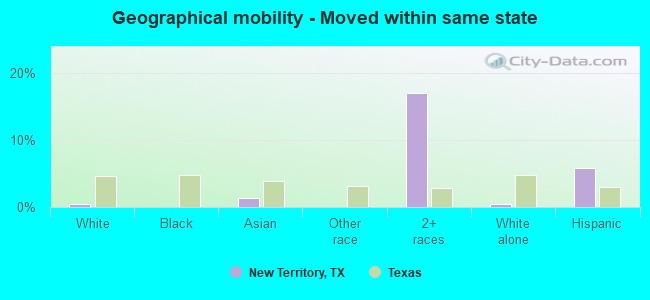
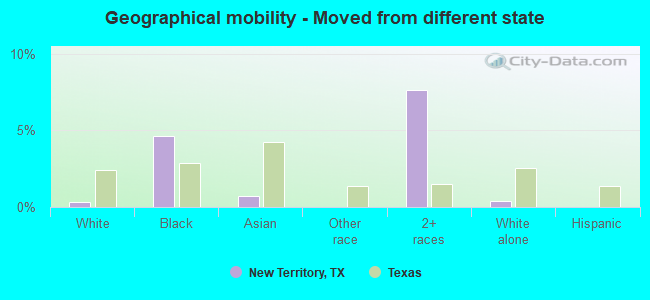
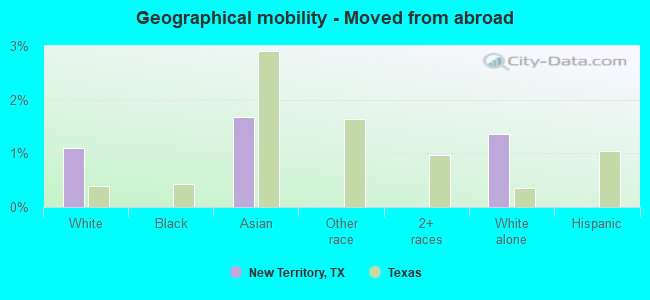
Geographical mobility in New Territory Same house 1 year ago 5,437 95.2% White (Caucasian)1,644 97.6% Black or African American9,682 94.1% Asian23 100.0% Other race1,406 62.4% Two or more races5,120 95.8% White alone, not Hispanic / Latino1,477 89.3% Hispanic or LatinoMoved within same county 201 3.5% White / Caucasian28 1.6% Black or African American252 2.5% Asian149 2.8% White alone, not Hispanic / Latino94 5.7% Hispanic or LatinoMoved within same state 24 0.4% White / Caucasian137 1.3% Asian382 16.9% Two or more races26 0.5% White alone, not Hispanic / Latino97 5.9% Hispanic or LatinoMoved from different state 20 0.4% White / Caucasian78 4.6% Black or African American77 0.7% Asian172 7.6% Two or more races22 0.4% White alone, not Hispanic / LatinoMoved from abroad 63 1.1% White173 1.7% Asian73 1.4% White alone, not Hispanic / Latino
Children Nativity (place of birth) in New Territory
Children under 6 years - Living with two parents Both parents native 152 100.0% NativeBoth parents foreign-born 239 66.6% Native120 33.4% Foreign-bornOne native, one foreign-born parent 19 100.0% NativeChildren under 6 years - Living with one parent Native parent 42 100.0% NativeForeign-born parent 26 78.0% Native7 22.0% Foreign-bornChildren 6 to 17 years - Living with two parents Both parents native 1,154 100.0% NativeBoth parents foreign-born 1,602 73.3% Native584 26.7% Foreign-bornOne native, one foreign-born parent 200 92.2% Native17 7.8% Foreign-bornChildren 6 to 17 years - Living with one parent Native parent 141 100.0% NativeForeign-born parent 225 49.9% Native226 50.1% Foreign-born
Grandparents responsible for own grandchildren in New Territory
Grandparents (30 to 59 years) White / Caucasian 24 100.0% Not responsible for grandchildrenBlack or African American 21 43.7% Responsible for grandchildren28 56.3% Not responsible for grandchildrenAsian 22 51.4% Responsible for grandchildren21 48.6% Not responsible for grandchildrenTwo or more races 207 100.0% Responsible for grandchildrenWhite alone, not Hispanic / Latino 10 100.0% Not responsible for grandchildrenHispanic or Latino 17 58.2% Responsible for grandchildren12 41.8% Not responsible for grandchildrenGrandparents (60 years and over) White / Caucasian 83 100.0% Not responsible for grandchildrenBlack or African American 106 100.0% Not responsible for grandchildrenAsian 89 18.1% Responsible for grandchildren402 81.9% Not responsible for grandchildrenWhite alone, not Hispanic / Latino 71 100.0% Not responsible for grandchildrenHispanic or Latino 26 100.0% Not responsible for grandchildren