Races in Newfield, Maine (ME) Detailed Stats
Ancestries, Foreign-born residents, place of birth

Recent posts about races in Newfield, Maine on our local forum with over 2,400,000 registered users:
 | Really Enjoyable Maine Weekend (15 replies) |
2.1% of Newfield, ME residents are foreign-born (1.0% born in Europe, 0.7% born in North America, 0.3% born in Latin America), which is 42.3% less than the foreign-born rate of 3.0% across the entire state of Maine.
Race distribution in Newfield

- 1,29197.2%White alone
- 120.9%Two or more races
- 120.9%American Indian alone
- 90.7%Hispanic
- 20.2%Other race alone
- 10.08%Black alone
- 10.08%Asian alone

2000
2022
-
- 1,230,29796.5%White alone
- 11,7310.9%Two or more races
- 9,3600.7%Hispanic
- 9,0140.7%Asian alone
- 6,4400.5%Black alone
- 6,9110.5%American Indian alone
- 8360.07%Other race alone
- 3340.03%Native Hawaiian and Other
Pacific Islander alone

-
- 1,249,23390.2%White alone
- 58,3574.2%Two or more races
- 28,7172.1%Hispanic
- 21,5831.6%Black alone
- 16,1511.2%Asian alone
- 5,8730.4%Other race alone
- 5,2050.4%American Indian alone
- 2210.02%Native Hawaiian and Other
Pacific Islander alone

Income and house value in Newfield
- Median household income in 2022
- $73,295White non-Hispanic householders
- $46,975Two or more races householders
- $78,171Hispanic or Latino race householders
- Median 2022 house value
- $297,055White Non-Hispanic householders
- $175,677American Indian or Alaska Native householders
- $239,560Two or more races householders
- $447,179Hispanic or Latino householders
Household income for White non-Hispanic householders

Household income for American Indian and Alaska Native householders

Household income for Two or more races householders

Household income for Hispanic or Latino race householders

Foreign-born residents in Newfield
28 residents are foreign born (1.0% Europe, 0.7% North America, 0.3% Latin America).
| This city: | 2.1% |
| Maine: | 2.9% |
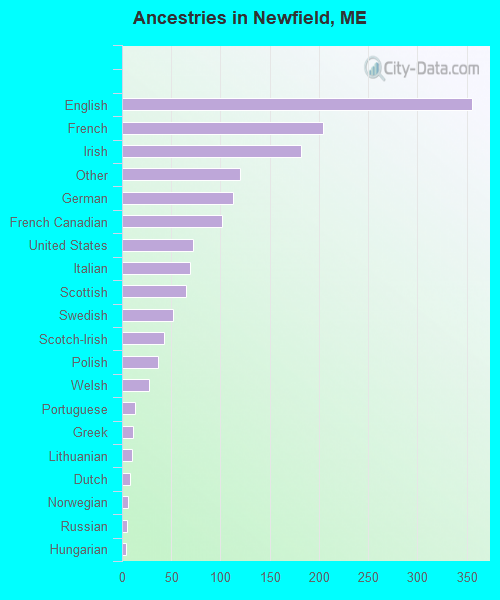
Ancestries in Newfield

- 35523.6%English
- 20413.6%French
- 18212.1%Irish
- 1208.0%Other
- 1137.5%German
- 1026.8%French Canadian
- 724.8%United States
- 694.6%Italian
- 654.3%Scottish
- 523.5%Swedish
- 432.9%Scotch-Irish
- 372.5%Polish
- 271.8%Welsh
- 130.9%Portuguese
- 110.7%Greek
- 100.7%Lithuanian
- 80.5%Dutch
- 60.4%Norwegian
- 50.3%Russian
- 40.3%Hungarian
- 30.2%Czech
- 20.1%Danish
- 10.07%Arab
Zip codes: 04095.