Races in Newton, New Hampshire (NH) Detailed Stats
Ancestries, Foreign-born residents, place of birth

Recent posts about races in Newton, New Hampshire on our local forum with over 2,400,000 registered users:
 | What if NH Had a Flat Income Tax Like PA? (118 replies) |
| Low density housing is killing nh! (67 replies) |
| should I move from Los Angeles to New Hampshire? (42 replies) |
| Moving from Va to NH looking for some advice :) (32 replies) |
| What will be the biggest changes when moving to NH from MA? (44 replies) |
| First visit to NH (28 replies) |
Latest news about races in Newton, NH collected exclusively by city-data.com from local newspapers, TV, and radio stations
2.5% of Newton, NH residents are foreign-born (1.7% born in Europe, 0.6% born in North America), which is 98.6% less than the foreign-born rate of 5.0% across the entire state of New Hampshire.
Race distribution in Newton

- 4,17197.2%White alone
- 561.3%Hispanic
- 320.7%Two or more races
- 170.4%Black alone
- 60.1%American Indian alone
- 30.07%Asian alone
- 30.07%Other race alone
- 10.02%Native Hawaiian and Other
Pacific Islander alone

2000
2022
-
- 1,175,25295.1%White alone
- 20,4891.7%Hispanic
- 15,8031.3%Asian alone
- 11,6060.9%Two or more races
- 8,3540.7%Black alone
- 2,6980.2%American Indian alone
- 1,2540.1%Other race alone
- 3300.03%Native Hawaiian and Other
Pacific Islander alone

-
- 1,208,10186.6%White alone
- 63,4794.5%Hispanic
- 60,7244.4%Two or more races
- 36,5192.6%Asian alone
- 17,9311.3%Black alone
- 6,6150.5%Other race alone
- 1,0140.07%American Indian alone
- 8480.06%Native Hawaiian and Other
Pacific Islander alone

Income and house value in Newton
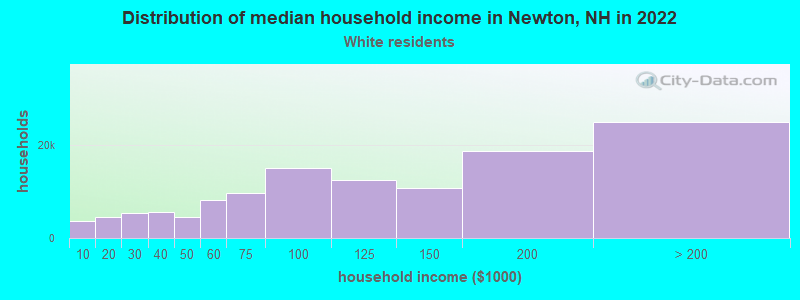
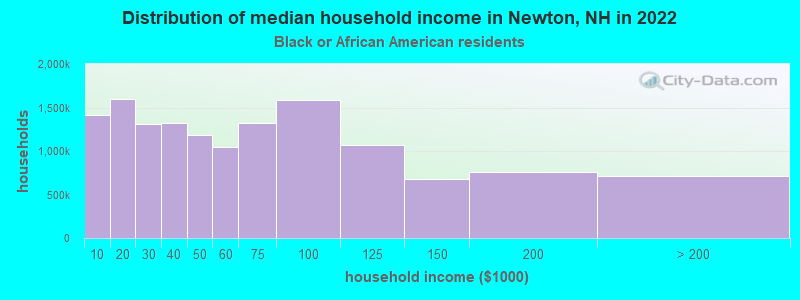
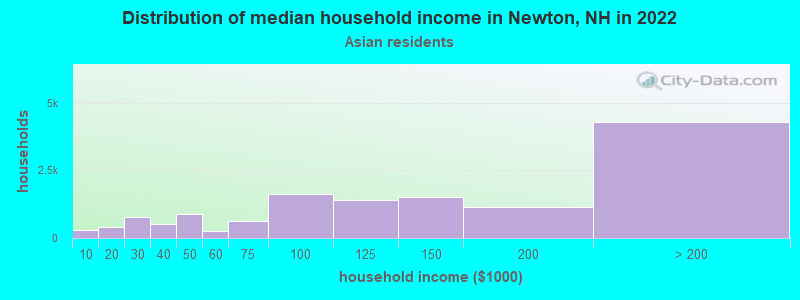
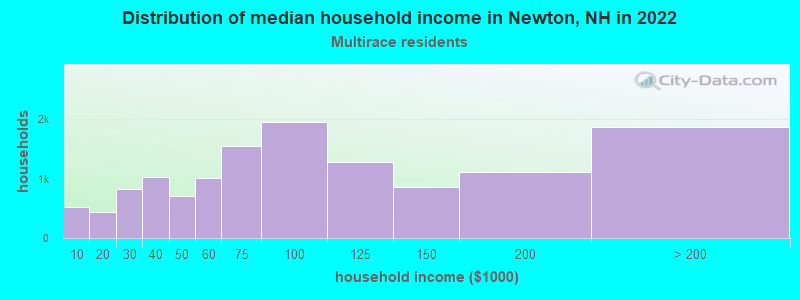
- Median household income in 2022
- $114,429White non-Hispanic householders
- $38,836Black householders
- $110,143Asian householders
- $94,455Two or more races householders
- $134,171Hispanic or Latino race householders
- Median 2022 house value
- $462,310White Non-Hispanic householders
- $496,533Asian householders
- $343,753Two or more races householders
- $420,143Hispanic or Latino householders
Household income for White non-Hispanic householders
Household income for Black householders
Household income for Asian householders
Household income for Two or more races householders
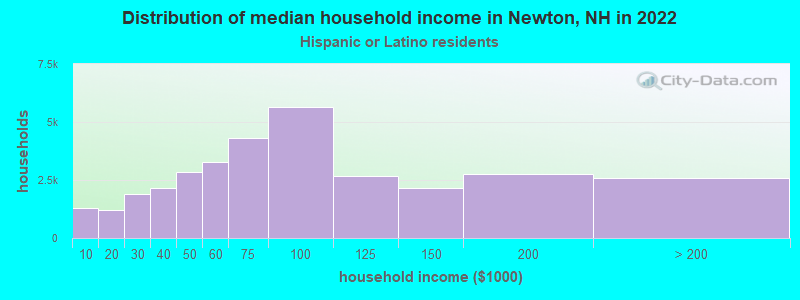
Household income for Hispanic or Latino race householders
Foreign-born residents in Newton
108 residents are foreign born (1.7% Europe, 0.6% North America).
| This city: | 2.5% |
| New Hampshire: | 4.4% |
Ancestries in Newton

- 92018.0%Irish
- 90517.7%English
- 63512.4%French
- 62412.2%Italian
- 3446.7%Other
- 3076.0%French Canadian
- 2685.2%German
- 2124.2%Scottish
- 1913.7%Polish
- 1603.1%United States
- 1132.2%Greek
- 1112.2%Portuguese
- 871.7%Swedish
- 731.4%Scotch-Irish
- 480.9%Norwegian
- 400.8%Welsh
- 140.3%Russian
- 120.2%Dutch
- 90.2%Arab
- 80.2%Hungarian
- 70.1%Lithuanian
- 70.1%Slovak
- 70.1%Swiss
- 50.10%Subsaharan African

Zip codes: 03858.