Races in North Liberty, Iowa (IA) Detailed Stats
Data:
Races - White alone (%)
Races - White alone (% change since 2000)
Races - Black alone (%)
Races - Black alone (% change since 2000)
Races - American Indian alone (%)
Races - American Indian alone (% change since 2000)
Races - Asian alone (%)
Races - Asian alone (% change since 2000)
Races - Hispanic (%)
Races - Hispanic (% change since 2000)
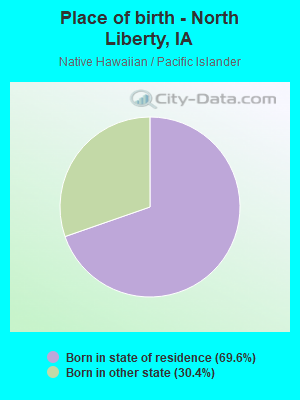
Races - Native Hawaiian and Other Pacific Islander alone (%)
Races - Native Hawaiian and Other Pacific Islander alone (% change since 2000)
Races - Two or more races(%)
Races - Two or more races(% change since 2000)
Races - Other race alone (%)
Races - Other race alone (% change since 2000)
Racial diversity
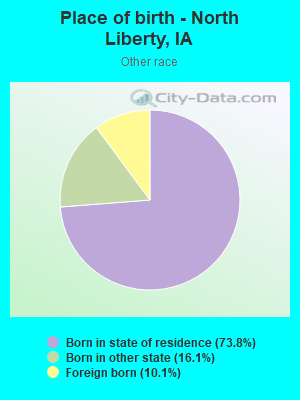
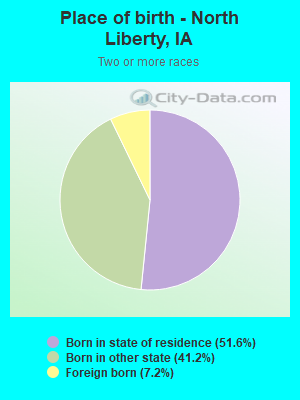
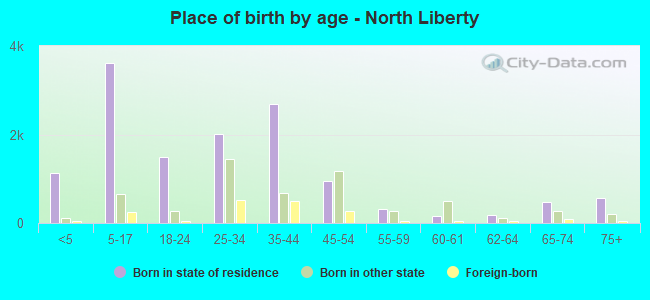
Place of birth - Born in state of residence (%)
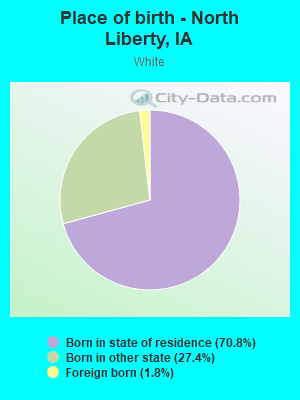
Place of birth - Born in state of residence (%) - White
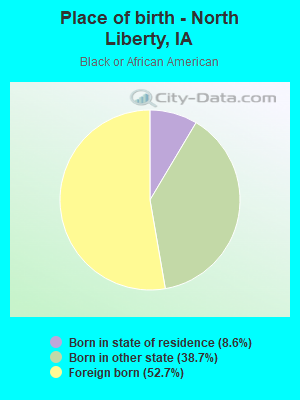
Place of birth - Born in state of residence (%) - Black or African American
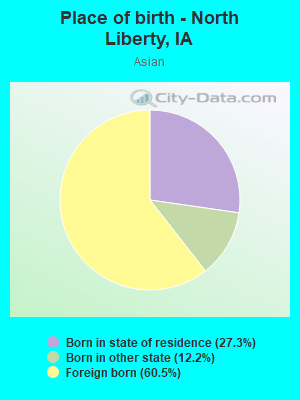
Place of birth - Born in state of residence (%) - Asian
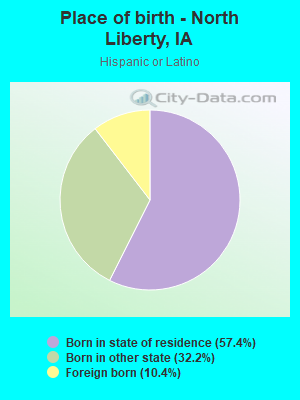
Place of birth - Born in state of residence (%) - Hispanic or Latino
Place of birth - Born in state of residence (%) - American Indian and Alaska Native
Place of birth - Born in state of residence (%) - Multirace
Place of birth - Born in state of residence (%) - Other Race
Place of birth - Born in other state (%)
Place of birth - Born in other state (%) - White
Place of birth - Born in other state (%) - Black or African American
Place of birth - Born in other state (%) - Asian
Place of birth - Born in other state (%) - Hispanic or Latino
Place of birth - Born in other state (%) - American Indian and Alaska Native
Place of birth - Born in other state (%) - Multirace
Place of birth - Born in other state (%) - Other Race
Place of birth - Native, outside of US (%)
Place of birth - Native, outside of US (%) - White
Place of birth - Native, outside of US (%) - Black or African American
Place of birth - Native, outside of US (%) - Asian
Place of birth - Native, outside of US (%) - Hispanic or Latino
Place of birth - Native, outside of US (%) - American Indian and Alaska Native
Place of birth - Native, outside of US (%) - Multirace
Place of birth - Native, outside of US (%) - Other Race
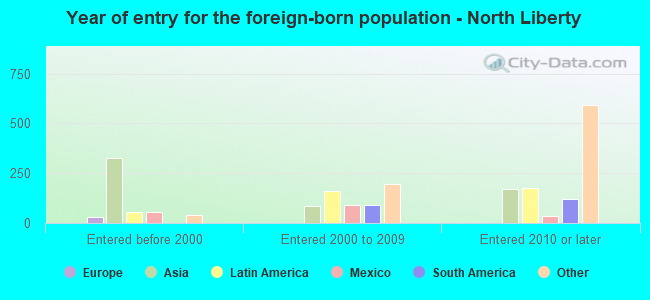
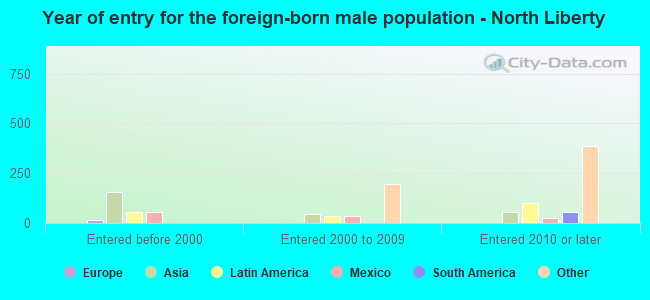
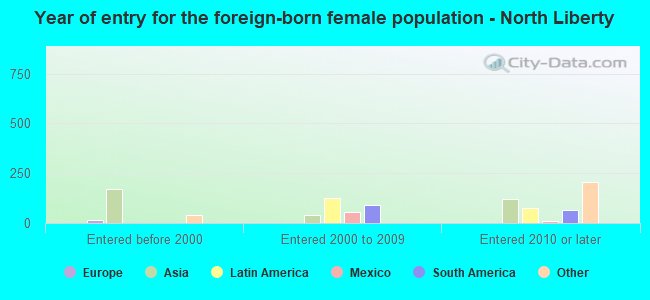
Place of birth - Foreign born (%)
Place of birth - Foreign born (%) - White
Place of birth - Foreign born (%) - Black or African American
Place of birth - Foreign born (%) - Asian
Place of birth - Foreign born (%) - Hispanic or Latino
Place of birth - Foreign born (%) - American Indian and Alaska Native
Place of birth - Foreign born (%) - Multirace
Place of birth - Foreign born (%) - Other Race
Residents speaking English at home (%)
Residents speaking English at home - Born in the United States (%)
Residents speaking English at home - Native, born elsewhere (%)
Residents speaking English at home - Foreign born (%)
Residents speaking Spanish at home (%)
Residents speaking Spanish at home - Born in the United States (%)
Residents speaking Spanish at home - Native, born elsewhere (%)
Residents speaking Spanish at home - Foreign born (%)
Residents speaking other language at home (%)
Residents speaking other language at home - Born in the United States (%)
Residents speaking other language at home - Native, born elsewhere (%)
Residents speaking other language at home - Foreign born (%)
Marital status - Never married (%)
Marital status - Now married (%)
Marital status - Separated (%)
Marital status - Widowed (%)
Marital status - Divorced (%)
Ancestries Reported - Arab (%)
Ancestries Reported - Czech (%)
Ancestries Reported - Danish (%)
Ancestries Reported - Dutch (%)
Ancestries Reported - English (%)
Ancestries Reported - French (%)
Ancestries Reported - French Canadian (%)
Ancestries Reported - German (%)
Ancestries Reported - Greek (%)
Ancestries Reported - Hungarian (%)
Ancestries Reported - Irish (%)
Ancestries Reported - Italian (%)
Ancestries Reported - Lithuanian (%)
Ancestries Reported - Norwegian (%)
Ancestries Reported - Polish (%)
Ancestries Reported - Portuguese (%)
Ancestries Reported - Russian (%)
Ancestries Reported - Scotch-Irish (%)
Ancestries Reported - Scottish (%)
Ancestries Reported - Slovak (%)
Ancestries Reported - Subsaharan African (%)
Ancestries Reported - Swedish (%)
Ancestries Reported - Swiss (%)
Ancestries Reported - Ukrainian (%)
Ancestries Reported - United States (%)
Ancestries Reported - Welsh (%)
Ancestries Reported - West Indian (%)
Ancestries Reported - Other (%)
Geographical mobility - Same house 1 year ago (%)
Geographical mobility - Same house 1 year ago (%) - White
Geographical mobility - Same house 1 year ago (%) - Black or African American
Geographical mobility - Same house 1 year ago (%) - Asian
Geographical mobility - Same house 1 year ago (%) - Hispanic or Latino
Geographical mobility - Same house 1 year ago (%) - American Indian and Alaska Native
Geographical mobility - Same house 1 year ago (%) - Multirace
Geographical mobility - Same house 1 year ago (%) - Other Race
Geographical mobility - Moved within same county (%)
Geographical mobility - Moved within same county (%) - White
Geographical mobility - Moved within same county (%) - Black or African American
Geographical mobility - Moved within same county (%) - Asian
Geographical mobility - Moved within same county (%) - Hispanic or Latino
Geographical mobility - Moved within same county (%) - American Indian and Alaska Native
Geographical mobility - Moved within same county (%) - Multirace
Geographical mobility - Moved within same county (%) - Other Race
Geographical mobility - Moved from different county within same state (%)
Geographical mobility - Moved from different county within same state (%) - White
Geographical mobility - Moved from different county within same state (%) - Black or African American
Geographical mobility - Moved from different county within same state (%) - Asian
Geographical mobility - Moved from different county within same state (%) - Hispanic or Latino
Geographical mobility - Moved from different county within same state (%) - American Indian and Alaska Native
Geographical mobility - Moved from different county within same state (%) - Multirace
Geographical mobility - Moved from different county within same state (%) - Other Race
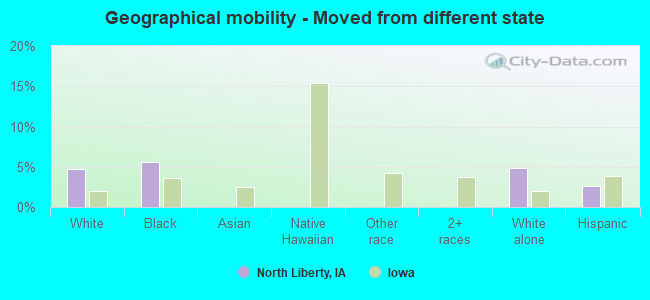
Geographical mobility - Moved from different state (%)
Geographical mobility - Moved from different state (%) - White
Geographical mobility - Moved from different state (%) - Black or African American
Geographical mobility - Moved from different state (%) - Asian
Geographical mobility - Moved from different state (%) - Hispanic or Latino
Geographical mobility - Moved from different state (%) - American Indian and Alaska Native
Geographical mobility - Moved from different state (%) - Multirace
Geographical mobility - Moved from different state (%) - Other Race
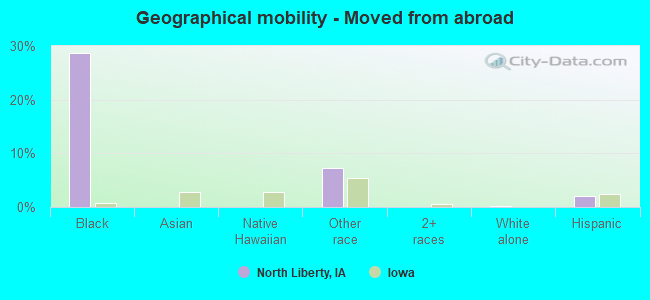
Geographical mobility - Moved from abroad (%)
Geographical mobility - Moved from abroad (%) - White
Geographical mobility - Moved from abroad (%) - Black or African American
Geographical mobility - Moved from abroad (%) - Asian
Geographical mobility - Moved from abroad (%) - Hispanic or Latino
Geographical mobility - Moved from abroad (%) - American Indian and Alaska Native
Geographical mobility - Moved from abroad (%) - Multirace
Geographical mobility - Moved from abroad (%) - Other Race
Place of birth for the foreign-born population - Ireland (%)
Place of birth for the foreign-born population - Denmark (%)
Place of birth for the foreign-born population - Norway (%)
Place of birth for the foreign-born population - Sweden (%)
Place of birth for the foreign-born population - United Kingdom (%)
Place of birth for the foreign-born population - England (%)
Place of birth for the foreign-born population - Scotland (%)
Place of birth for the foreign-born population - Other Northern Europe (%)
Place of birth for the foreign-born population - Austria (%)
Place of birth for the foreign-born population - Belgium (%)
Place of birth for the foreign-born population - France (%)
Place of birth for the foreign-born population - Germany (%)
Place of birth for the foreign-born population - Netherlands (%)
Place of birth for the foreign-born population - Switzerland (%)
Place of birth for the foreign-born population - Other Western Europe (%)
Place of birth for the foreign-born population - Greece (%)
Place of birth for the foreign-born population - Italy (%)
Place of birth for the foreign-born population - Portugal (%)
Place of birth for the foreign-born population - Spain (%)
Place of birth for the foreign-born population - Other Southern Europe (%)
Place of birth for the foreign-born population - Albania (%)
Place of birth for the foreign-born population - Belarus (%)
Place of birth for the foreign-born population - Bosnia and Herzegovina (%)
Place of birth for the foreign-born population - Bulgaria (%)
Place of birth for the foreign-born population - Croatia (%)
Place of birth for the foreign-born population - Czechoslovakia (%)
Place of birth for the foreign-born population - Hungary (%)
Place of birth for the foreign-born population - Latvia (%)
Place of birth for the foreign-born population - Lithuania (%)
Place of birth for the foreign-born population - North Macedonia (Macedonia) (%)
Place of birth for the foreign-born population - Moldova (%)
Place of birth for the foreign-born population - Poland (%)
Place of birth for the foreign-born population - Romania (%)
Place of birth for the foreign-born population - Russia (%)
Place of birth for the foreign-born population - Serbia (%)
Place of birth for the foreign-born population - Ukraine (%)
Place of birth for the foreign-born population - Other Eastern Europe (%)
Place of birth for the foreign-born population - China (%)
Place of birth for the foreign-born population - Hong Kong (%)
Place of birth for the foreign-born population - Taiwan (%)
Place of birth for the foreign-born population - Japan (%)
Place of birth for the foreign-born population - Korea (%)
Place of birth for the foreign-born population - Other Eastern Asia (%)
Place of birth for the foreign-born population - Afghanistan (%)
Place of birth for the foreign-born population - Bangladesh (%)
Place of birth for the foreign-born population - India (%)
Place of birth for the foreign-born population - Iran (%)
Place of birth for the foreign-born population - Kazakhstan (%)
Place of birth for the foreign-born population - Nepal (%)
Place of birth for the foreign-born population - Pakistan (%)
Place of birth for the foreign-born population - Sri Lanka (%)
Place of birth for the foreign-born population - Uzbekistan (%)
Place of birth for the foreign-born population - Other South Central Asia (%)
Place of birth for the foreign-born population - Burma (%)
Place of birth for the foreign-born population - Cambodia (%)
Place of birth for the foreign-born population - Indonesia (%)
Place of birth for the foreign-born population - Laos (%)
Place of birth for the foreign-born population - Malaysia (%)
Place of birth for the foreign-born population - Philippines (%)
Place of birth for the foreign-born population - Singapore (%)
Place of birth for the foreign-born population - Thailand (%)
Place of birth for the foreign-born population - Vietnam (%)
Place of birth for the foreign-born population - Other South Eastern Asia (%)
Place of birth for the foreign-born population - Armenia (%)
Place of birth for the foreign-born population - Iraq (%)
Place of birth for the foreign-born population - Israel (%)
Place of birth for the foreign-born population - Jordan (%)
Place of birth for the foreign-born population - Kuwait (%)
Place of birth for the foreign-born population - Lebanon (%)
Place of birth for the foreign-born population - Saudi Arabia (%)
Place of birth for the foreign-born population - Syria (%)
Place of birth for the foreign-born population - Turkey (%)
Place of birth for the foreign-born population - Yemen (%)
Place of birth for the foreign-born population - Other Western Asia (%)
Place of birth for the foreign-born population - Eritrea (%)
Place of birth for the foreign-born population - Ethiopia (%)
Place of birth for the foreign-born population - Kenya (%)
Place of birth for the foreign-born population - Somalia (%)
Place of birth for the foreign-born population - Uganda (%)
Place of birth for the foreign-born population - Zimbabwe (%)
Place of birth for the foreign-born population - Other Eastern Africa (%)
Place of birth for the foreign-born population - Cameroon (%)
Place of birth for the foreign-born population - Congo (%)
Place of birth for the foreign-born population - Democratic Republic of Congo (Zaire) (%)
Place of birth for the foreign-born population - Other Middle Africa (%)
Place of birth for the foreign-born population - Egypt (%)
Place of birth for the foreign-born population - Morocco (%)
Place of birth for the foreign-born population - Sudan (%)
Place of birth for the foreign-born population - Other Northern Africa (%)
Place of birth for the foreign-born population - South Africa (%)
Place of birth for the foreign-born population - Other Southern Africa (%)
Place of birth for the foreign-born population - Cabo Verde (%)
Place of birth for the foreign-born population - Ghana (%)
Place of birth for the foreign-born population - Liberia (%)
Place of birth for the foreign-born population - Nigeria (%)
Place of birth for the foreign-born population - Senegal (%)
Place of birth for the foreign-born population - Sierra Leone (%)
Place of birth for the foreign-born population - Other Western Africa (%)
Place of birth for the foreign-born population - Australia (%)
Place of birth for the foreign-born population - New Zealand (%)
Place of birth for the foreign-born population - Fiji (%)
Place of birth for the foreign-born population - Micronesia (%)
Place of birth for the foreign-born population - Bahamas (%)
Place of birth for the foreign-born population - Barbados (%)
Place of birth for the foreign-born population - Cuba (%)
Place of birth for the foreign-born population - Dominica (%)
Place of birth for the foreign-born population - Dominican Republic (%)
Place of birth for the foreign-born population - Grenada (%)
Place of birth for the foreign-born population - Haiti (%)
Place of birth for the foreign-born population - Jamaica (%)
Place of birth for the foreign-born population - St. Vincent and the Grenadines (%)
Place of birth for the foreign-born population - Trinidad and Tobago (%)
Place of birth for the foreign-born population - West Indies (%)
Place of birth for the foreign-born population - Other Caribbean (%)
Place of birth for the foreign-born population - Belize (%)
Place of birth for the foreign-born population - Costa Rica (%)
Place of birth for the foreign-born population - El Salvador (%)
Place of birth for the foreign-born population - Guatemala (%)
Place of birth for the foreign-born population - Honduras (%)
Place of birth for the foreign-born population - Mexico (%)
Place of birth for the foreign-born population - Nicaragua (%)
Place of birth for the foreign-born population - Panama (%)
Place of birth for the foreign-born population - Other Central America (%)
Place of birth for the foreign-born population - Argentina (%)
Place of birth for the foreign-born population - Bolivia (%)
Place of birth for the foreign-born population - Brazil (%)
Place of birth for the foreign-born population - Chile (%)
Place of birth for the foreign-born population - Colombia (%)
Place of birth for the foreign-born population - Ecuador (%)
Place of birth for the foreign-born population - Guyana (%)
Place of birth for the foreign-born population - Peru (%)
Place of birth for the foreign-born population - Uruguay (%)
Place of birth for the foreign-born population - Venezuela (%)
Place of birth for the foreign-born population - Other South America (%)
Place of birth for the foreign-born population - Canada (%)
Place of birth for the foreign-born population - Other Northern America (%)
Place of birth for the foreign-born population - Other (%)
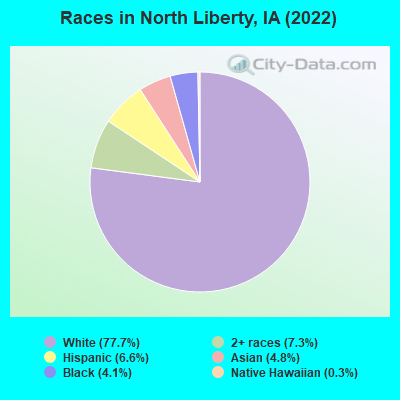
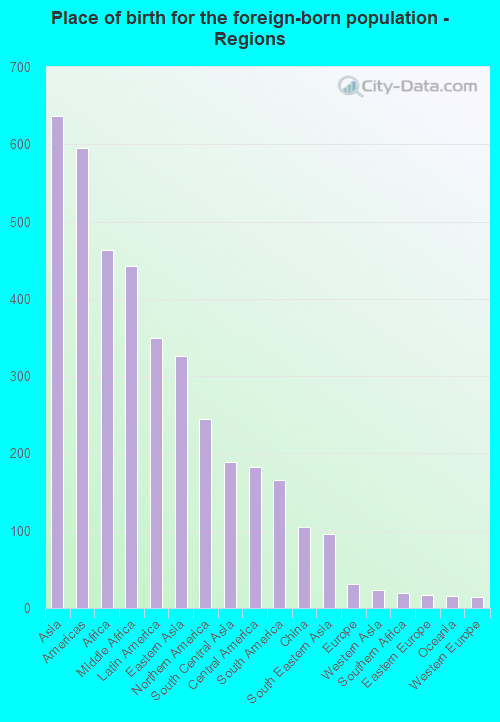
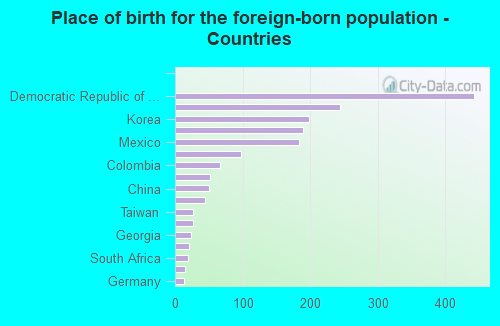
According to 2022 data, the most numerous races in North Liberty, IA are White alone (16,164 residents), Hispanic (1,374 residents), and Black alone (855 residents). 89.8% of North Liberty residents speak English at home. 8.4% of North Liberty, IA residents are foreign-born (3.1% born in Asia, 2.2% born in Africa, 1.7% born in Latin America, 1.2% born in North America), which is 40.3% greater than the foreign-born rate of 5.0% across the entire state of Iowa.
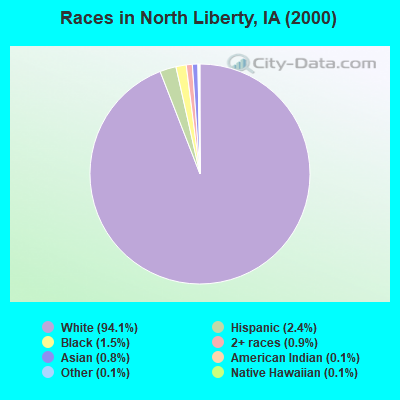
Race distribution in North Liberty
2000 2022
2,710,344 92.6% White alone 82,473 2.8% Hispanic 60,744 2.1% Black alone 36,345 1.2% Asian alone 25,472 0.9% Two or more races 7,955 0.3% American Indian alone 2,103 0.07% Other race alone 888 0.03% Native Hawaiian and Other
2,650,110 82.8% White alone 218,024 6.8% Hispanic 119,004 3.7% Black alone 115,286 3.6% Two or more races 74,892 2.3% Asian alone 9,260 0.3% Other race alone 8,595 0.3% Native Hawaiian and Other 5,346 0.2% American Indian alone
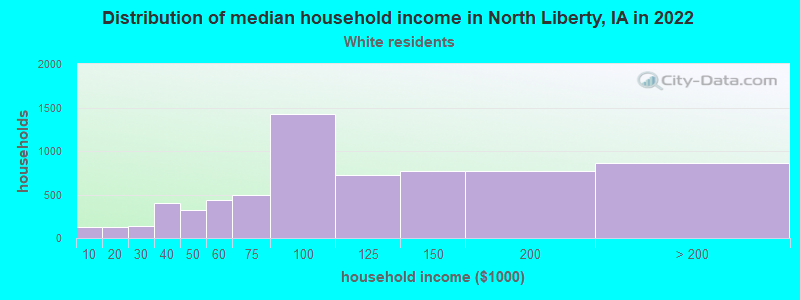
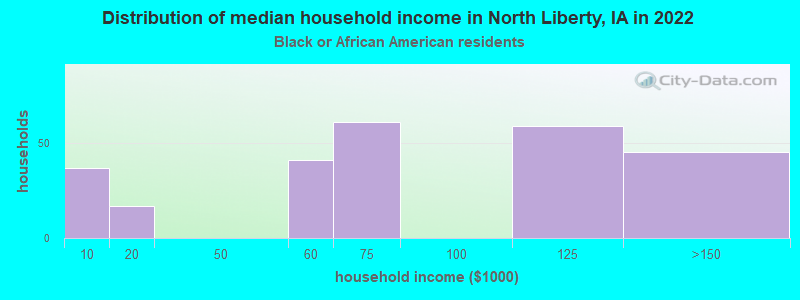
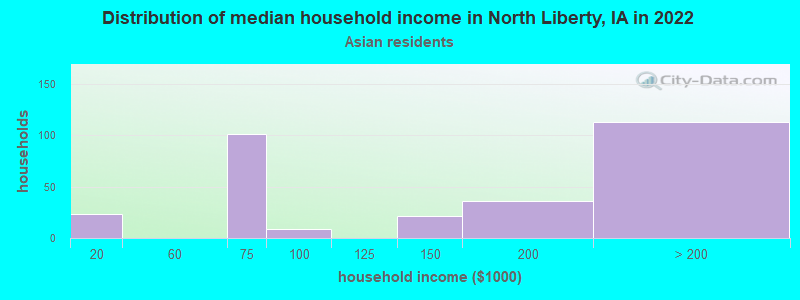
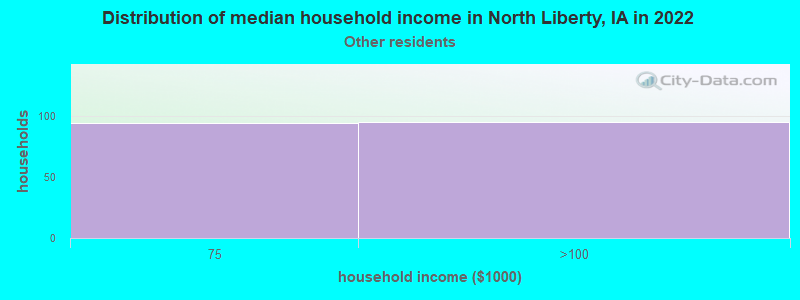
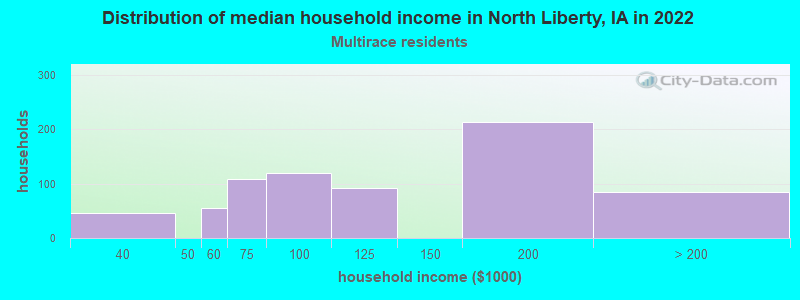
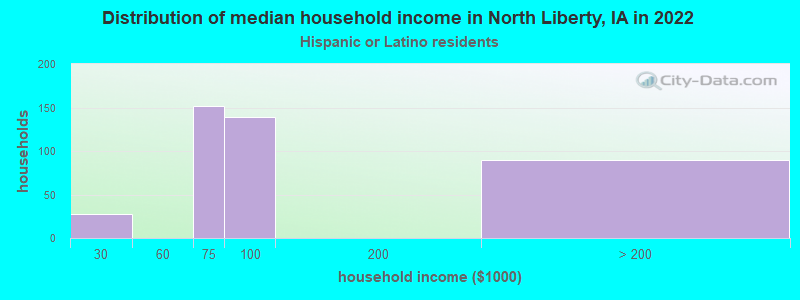
Income and house value in North Liberty Median household income in 2022 $103,347 White non-Hispanic householders$49,314 Black householders$100,977 Some other race householders$110,690 Two or more races householders$77,331 Hispanic or Latino race householdersMedian 2022 house value $319,181 White Non-Hispanic householders$322,044 Black or African American householders $465,174 Asian householders$322,044 Some other race householders$311,452 Hispanic or Latino householders
Median age by race in North Liberty
32.9 Median age for White residents31.3 34.6 42.4 Median age for Black or African American residents38.8 45.4 -660,397,073.5 Median age for American Indian / Alaska Native residents-654,282,765.1 -670,912,950.5 37.7 Median age for Asian residents42.4 36.7 -580,729,166.1 Median age for Native Hawaiian / Pacific Islander residents-776,978,416.5 -504,347,825.6 25.9 Median age for Other race residents22.6 30.4 18.8 Median age for Two or more races residents15.4 30.9 32.9 Median age for White alone residents31.6 34.5 29.2 Median age for Hispanic or Latino residents20.3 37.6
Owner/renter occupied households by race in North Liberty
House owners and renters - White residents 4,877 73.8% Owner occupied1,732 26.2% Renter occupiedHouse owners and renters - Black or African American residents 278 71.8% Owner occupied109 28.2% Renter occupiedHouse owners and renters - Asian residents 139 44.3% Owner occupied175 55.7% Renter occupiedHouse owners and renters - Other race residents 152 73.7% Owner occupied54 26.3% Renter occupiedHouse owners and renters - Two or more races residents 520 96.5% Owner occupied19 3.5% Renter occupiedHouse owners and renters - White alone residents 4,917 74.2% Owner occupied1,710 25.8% Renter occupiedHouse owners and renters - Hispanic or Latino residents 209 61.8% Owner occupied129 38.2% Renter occupied
Language usage in North Liberty
English speakers - Total 89.8% of residents of North Liberty speak English at home.
3.6% of residents speak Spanish at home 680 98.3% Speak English very well12 1.7% Speak English less than very well6.4% of residents speak other language at home 844 67.7% Speak English very well403 32.3% Speak English less than very well
English speakers - Born in the United States 92.3% of residents of North Liberty speak English at home.
3.8% of residents speak Spanish at home 219 100.0% Speak English very well3.2% of residents speak other language at home 186 100.0% Speak English very well
English speakers - Foreign-born 34.1% of residents of North Liberty speak English at home.
10.2% of residents speak Spanish at home 164 100.0% Speak English very well58.6% of residents speak other language at home 577 61.2% Speak English very well366 38.8% Speak English less than very well
White (Caucasian) - Speak only English Native:
97.4% (14,583)Foreign-born:
84.5% (255)
White (Caucasian) - Speak another language Native:
2.0% (304)Foreign-born:
23.9% (72)
Black or African American - Speak only English Native:
97.5% (434)Foreign-born:
16.7% (78)
Asian - Speak only English Native:
69.3% (267)Foreign-born:
25.9% (150)
Asian - Speak another language Native:
36.8% (142)Foreign-born:
75.6% (439)
Other race - Speak only English Native:
31.1% (119)Foreign-born:
8.6% (10)
Other race - Speak another language Native:
63.3% (243)Foreign-born:
89.7% (99)
Two or more races - Speak only English Native:
84.5% (1,512)Foreign-born:
76.8% (136)
Two or more races - Speak another language Native:
11.4% (204)Foreign-born:
43.7% (77)
White alone - Speak only English Native:
97.6% (14,330)Foreign-born:
82.7% (266)
White alone - Speak another language Native:
2.0% (299)Foreign-born:
13.1% (42)
Hispanic or Latino - Speak only English Native:
55.8% (683)Foreign-born:
73.4% (122)
Hispanic or Latino - Speak another language Native:
40.2% (492)Foreign-born:
62.6% (104)
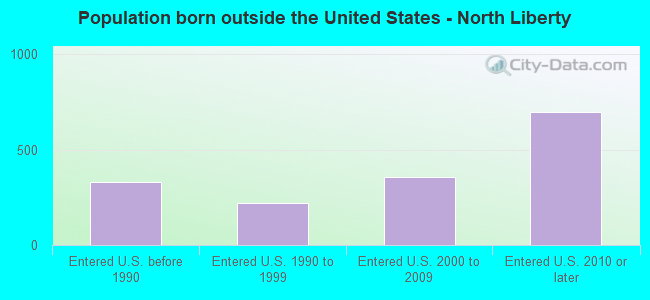
Foreign-born residents in North Liberty 1,743 residents are foreign born (3.1% Asia , 2.2% Africa , 1.7% Latin America , 1.2% North America ).
Marital status for residents in North Liberty Marital status - White (Caucasian) population 15 years and over
Males 32.9% Never married56.3% Now married1.7% Separated2.4% Widowed6.7% DivorcedFemales 27.7% Never married57.4% Now married0.3% Separated5.1% Widowed9.5% DivorcedWomen who gave birth in the past 12 months Now married:
100.0% (317)Unmarried:
0.0% (0)
Women who did not give birth in the past 12 months Now married:
54.3% (2,187)Unmarried:
45.7% (1,844)
Marital status - Black or African American population 15 years and over
Males 54.8% Never married41.4% Now married0.0% Separated0.0% Widowed3.8% DivorcedFemales 30.5% Never married35.0% Now married0.0% Separated0.0% Widowed34.5% DivorcedWomen who did not give birth in the past 12 months Now married:
74.2% (67)Unmarried:
25.8% (23)
Marital status - Asian population 15 years and over
Males 26.9% Never married73.1% Now married0.0% Separated0.0% Widowed0.0% DivorcedFemales 0.0% Never married94.2% Now married0.0% Separated0.0% Widowed5.8% DivorcedWomen who did not give birth in the past 12 months Now married:
100.0% (284)Unmarried:
0.0% (0)
Marital status - Other race population 15 years and over
Males 72.8% Never married27.2% Now married0.0% Separated0.0% Widowed0.0% DivorcedFemales 94.0% Never married6.0% Now married0.0% Separated0.0% Widowed0.0% DivorcedWomen who did not give birth in the past 12 months Now married:
6.0% (13)Unmarried:
94.0% (202)
Marital status - Two or more races population 15 years and over
Males 50.4% Never married47.9% Now married0.0% Separated0.0% Widowed1.8% DivorcedFemales 32.5% Never married54.7% Now married0.0% Separated0.0% Widowed12.8% DivorcedWomen who did not give birth in the past 12 months Now married:
58.2% (357)Unmarried:
41.8% (257)
Marital status - White alone, not Hispanic / Latino population 15 years and over
Males 32.6% Never married56.4% Now married1.7% Separated2.4% Widowed6.8% DivorcedFemales 28.1% Never married56.4% Now married0.4% Separated5.3% Widowed9.8% DivorcedWomen who gave birth in the past 12 months Now married:
100.0% (312)Unmarried:
0.0% (0)
Women who did not give birth in the past 12 months Now married:
53.5% (2,049)Unmarried:
46.5% (1,784)
Marital status - Hispanic or Latino population 15 years and over
Males 53.1% Never married44.8% Now married0.0% Separated0.0% Widowed2.1% DivorcedFemales 41.1% Never married58.9% Now married0.0% Separated0.0% Widowed0.0% DivorcedWomen who did not give birth in the past 12 months Now married:
52.4% (250)Unmarried:
47.6% (227)
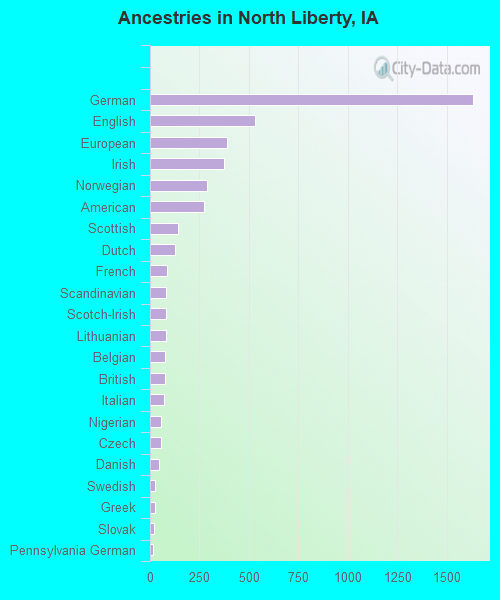
Ancestries in North Liberty
1,631 24.9% German530 8.1% English390 6.0% European372 5.7% Irish289 4.4% Norwegian273 4.2% American140 2.1% Scottish125 1.9% Dutch87 1.3% French82 1.3% Scandinavian80 1.2% Scotch-Irish79 1.2% Lithuanian75 1.1% Belgian75 1.1% British71 1.1% Italian58 0.9% Nigerian57 0.9% Czech45 0.7% Danish24 0.4% Swedish23 0.4% Greek18 0.3% Slovak15 0.2% Pennsylvania German12 0.2% Latvian11 0.2% African9 0.1% Welsh
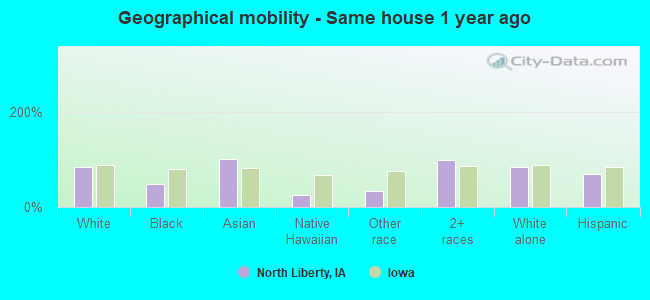
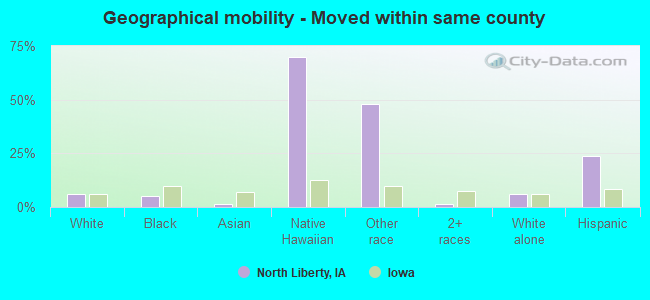
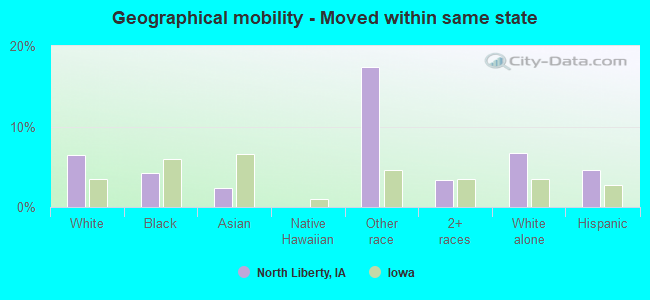
Geographical mobility in North Liberty Same house 1 year ago 13,353 83.3% White (Caucasian)414 48.0% Black or African American1,060 100.0% Asian8 26.2% Native Hawaiian / Pacific Islander166 33.1% Other race2,107 97.5% Two or more races13,063 83.1% White alone, not Hispanic / Latino954 68.8% Hispanic or LatinoMoved within same county 935 5.8% White / Caucasian44 5.1% Black or African American15 1.5% Asian20 70.1% Native Hawaiian / Pacific Islander241 48.0% Other race25 1.2% Two or more races916 5.8% White alone, not Hispanic / Latino332 23.9% Hispanic or LatinoMoved within same state 1,035 6.5% White / Caucasian37 4.2% Black or African American23 2.3% Asian87 17.4% Other race72 3.4% Two or more races1,047 6.7% White alone, not Hispanic / Latino63 4.5% Hispanic or LatinoMoved from different state 752 4.7% White / Caucasian48 5.5% Black or African American768 4.9% White alone, not Hispanic / Latino37 2.7% Hispanic or LatinoMoved from abroad 11 0.1% White248 28.7% Black or African American37 7.3% Other race24 0.2% White alone, not Hispanic / Latino29 2.1% Hispanic or Latino
Children Nativity (place of birth) in North Liberty
Children under 6 years - Living with two parents Both parents native 1,547 99.9% Native1 0.1% Foreign-bornBoth parents foreign-born 40 58.0% Native29 42.0% Foreign-bornOne native, one foreign-born parent 50 100.0% NativeChildren under 6 years - Living with one parent Native parent 48 100.0% NativeChildren 6 to 17 years - Living with two parents Both parents native 2,891 100.0% NativeBoth parents foreign-born 176 61.5% Native110 38.5% Foreign-bornOne native, one foreign-born parent 218 100.0% NativeChildren 6 to 17 years - Living with one parent Native parent 572 100.0% NativeForeign-born parent 57 51.8% Native53 48.2% Foreign-born