Estimated zip code population in 2022: 5,211 Zip code population in 2010: 2,180 Zip code population in 2000: 1,202
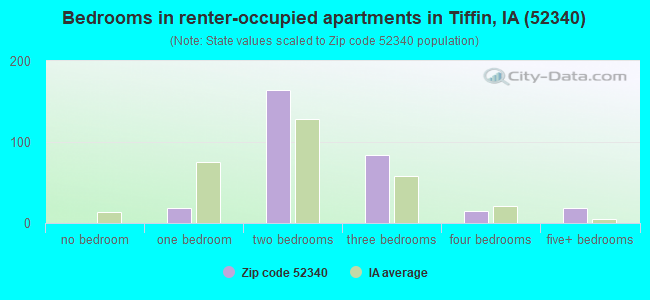
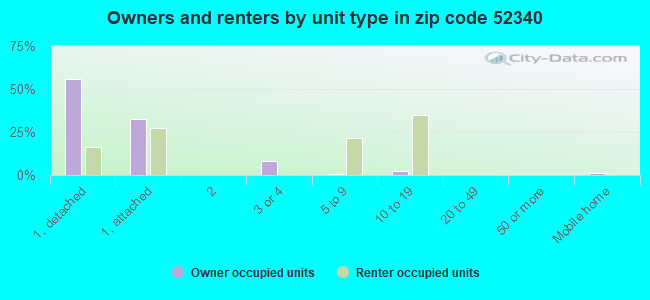
Houses and condos: 2,210 Renter-occupied apartments: 301
% of renters here:
15%
State:
28%
March 2022 cost of living index in zip code 52340: 91.2 (less than average, U.S. average is 100)
Land area: 16.6 sq. mi. Water area: 0.0 sq. mi.
Population density: 314 people per square mile
(very low).
OSM Map
General Map
Google Map
MSN Map
OSM Map
General Map
Google Map
MSN Map
OSM Map
General Map
Google Map
MSN Map
OSM Map
General Map
Google Map
MSN Map
Please wait while loading the map...
Real estate property taxes paid for housing units in 2022:
This zip code:
1.5% ($4,836)
Iowa:
1.4% ($2,724)
Median real estate property taxes paid for housing units with mortgages in 2022: $4,686 (1.5%) Median real estate property taxes paid for housing units with no mortgage in 2022: $7,905 (1.8%)
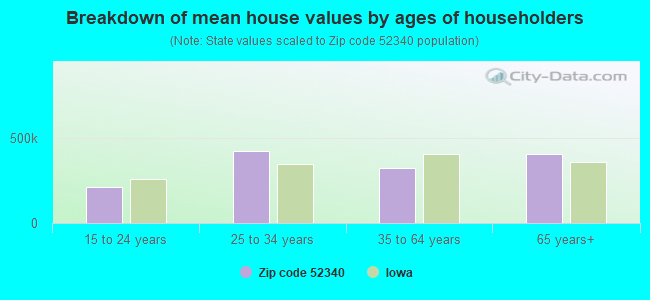
Estimated median house/condo value in 2022: $318,368
52340:
$318,368
Iowa:
$194,600
According to our research of Iowa and other state lists, there were 6 registered sex offenders living in 52340 zip code as of May 15, 2024. The ratio of all residents to sex offenders in zip code 52340 is 431 to 1. The ratio of registered sex offenders to all residents in this zip code is near the state average.
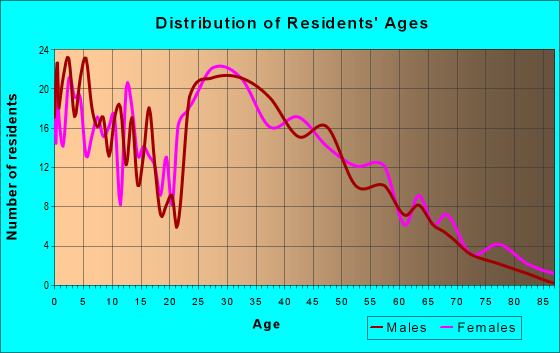
Median resident age:
This zip code:
32.8 years
Iowa median age:
38.9 years
Average household size:
This zip code:
2.6 people
Iowa:
2.3 people
Averages for the 2020 tax year for zip code 52340, filed in 2021:
Average Adjusted Gross Income (AGI) in 2020: $72,715 (Individual Income Tax Returns)
Here:
$72,715
State:
$71,087
Salary/wage: $64,534 (reported on 91.2% of returns)
Here:
$64,534
State:
$57,361
(% of AGI for various income ranges: 1367.6% for AGIs below $25k, 3925.1% for AGIs $25k-50k, 6417.8% for AGIs $50k-75k, 9113.7% for AGIs $75k-100k, 17841.9% for AGIs $100k-200k, 56165.0% for AGIs over 200k)
Taxable interest for individuals: $922 (reported on 41.5% of returns)
This zip code:
$922
Iowa:
$1,633
(% of AGI for various income ranges: 19.3% for AGIs below $25k, 16.9% for AGIs $25k-50k, 20.7% for AGIs $50k-75k, 40.0% for AGIs $75k-100k, 133.2% for AGIs $100k-200k, 555.0% for AGIs over 200k)
Ordinary dividends: $2,754 (reported on 21.5% of returns)
Here:
$2,754
State:
$5,432
(% of AGI for various income ranges: 13.8% for AGIs below $25k, 27.1% for AGIs $25k-50k, 46.8% for AGIs $50k-75k, 95.9% for AGIs $75k-100k, 179.7% for AGIs $100k-200k, 882.5% for AGIs over 200k)
Net capital gain/loss in AGI: +$7,953 (reported on 19.4% of returns)
Here:
+$7,953
State:
+$15,243
(% of AGI for various income ranges: 3.6% for AGIs below $25k, 52.4% for AGIs $25k-50k, 47.8% for AGIs $50k-75k, 105.2% for AGIs $75k-100k, 349.7% for AGIs $100k-200k, 5740.0% for AGIs over 200k)
Profit/loss from business: +$10,418 (reported on 14.1% of returns)
Here:
+$10,418
State:
+$11,763
(% of AGI for various income ranges: 64.9% for AGIs below $25k, 111.6% for AGIs $25k-50k, 119.3% for AGIs $50k-75k, 218.1% for AGIs $75k-100k, 313.8% for AGIs $100k-200k, 2555.0% for AGIs over 200k)
Taxable individual retirement arrangement distribution: $20,304 (reported on 8.1% of returns)
52340:
$20,304
Iowa:
$17,324
(% of AGI for various income ranges: 36.7% for AGIs below $25k, 65.1% for AGIs $25k-50k, 267.3% for AGIs $50k-75k, 212.2% for AGIs $75k-100k, 669.7% for AGIs $100k-200k)
Total itemized deductions: $26,133 (reported on 9.5% of returns)
Here:
$26,133
State:
$33,775
(% of AGI for various income ranges: 143.6% for AGIs $25k-50k, 275.6% for AGIs $50k-75k, 343.7% for AGIs $75k-100k, 698.4% for AGIs $100k-200k, 4060.0% for AGIs over 200k)
Charity contributions: $5,706 (reported on 6.0% of returns)
Here:
$5,706
State:
$13,075
(% of AGI for various income ranges: 28.5% for AGIs $50k-75k, 52.2% for AGIs $75k-100k, 139.5% for AGIs $100k-200k, 490.0% for AGIs over 200k)
Taxes paid: $8,154 (reported on 9.2% of returns)
52340:
$8,154
State:
$7,704
(% of AGI for various income ranges: 24.2% for AGIs $25k-50k, 105.6% for AGIs $50k-75k, 131.9% for AGIs $75k-100k, 212.2% for AGIs $100k-200k, 1032.5% for AGIs over 200k)
Earned income credit: $1,921 (reported on 8.5% of returns)
Here:
$1,921
State:
$2,195
(% of AGI for various income ranges: 59.1% for AGIs below $25k, 35.5% for AGIs $25k-50k)
Percentage of individuals using paid preparers for their 2020 taxes: 96.1%
Here:
96%
State:
95%
(% for various income ranges: 93.4% for AGIs below $25k, 97.0% for AGIs $25k-50k, 96.2% for AGIs $50k-75k, 97.1% for AGIs $75k-100k, 96.6% for AGIs $100k-200k, 100.0% for AGIs over 200k)
Averages for the 2012 tax year for zip code 52340, filed in 2013:
Average Adjusted Gross Income (AGI) in 2012: $58,983 (Individual Income Tax Returns)
Here:
$58,983
State:
$58,860
Salary/wage: $51,250 (reported on 93.1% of returns)
Here:
$51,250
State:
$46,659
(% of AGI for various income ranges: 89.0% for AGIs below $25k, 87.5% for AGIs $25k-50k, 86.2% for AGIs $50k-75k, 82.0% for AGIs $75k-100k, 103.3% for AGIs $100k-200k)
Taxable interest for individuals: $1,119 (reported on 45.4% of returns)
This zip code:
$1,119
Iowa:
$1,537
(% of AGI for various income ranges: 1.9% for AGIs below $25k, 0.5% for AGIs $25k-50k, 0.7% for AGIs $50k-75k, 1.7% for AGIs $75k-100k, 0.6% for AGIs $100k-200k, 0.6% for AGIs over 200k)
Ordinary dividends: $2,644 (reported on 20.8% of returns)
Here:
$2,644
State:
$4,542
(% of AGI for various income ranges: 0.5% for AGIs below $25k, 0.3% for AGIs $25k-50k, 0.6% for AGIs $50k-75k, 0.9% for AGIs $75k-100k, 2.0% for AGIs $100k-200k)
Net capital gain/loss in AGI: +$10,295 (reported on 14.6% of returns)
Here:
+$10,295
State:
+$11,802
(% of AGI for various income ranges: 0.8% for AGIs $75k-100k, 7.9% for AGIs $100k-200k)
Profit/loss from business: +$8,780 (reported on 15.4% of returns)
Here:
+$8,780
State:
+$10,509
(% of AGI for various income ranges: 6.0% for AGIs below $25k, 3.3% for AGIs $25k-50k, 1.6% for AGIs $50k-75k, 3.0% for AGIs $75k-100k, 1.8% for AGIs $100k-200k)
Taxable individual retirement arrangement distribution: $12,025 (reported on 6.2% of returns)
52340:
$12,025
Iowa:
$11,773
(% of AGI for various income ranges: 2.3% for AGIs $25k-50k, 3.0% for AGIs $50k-75k, 1.1% for AGIs $100k-200k)
Total itemized deductions: $18,223 (19% of AGI, reported on 40.8% of returns)
Here:
$18,223
State:
$21,278
Here:
19.2% of AGI
State:
18.9% of AGI
(% of AGI for various income ranges: 8.8% for AGIs below $25k, 9.0% for AGIs $25k-50k, 12.0% for AGIs $50k-75k, 16.0% for AGIs $75k-100k, 14.9% for AGIs $100k-200k, 9.9% for AGIs over 200k)
Charity contributions: $2,215 (reported on 30.8% of returns)
Here:
$2,215
State:
$4,044
(% of AGI for various income ranges: 1.0% for AGIs $25k-50k, 1.3% for AGIs $50k-75k, 1.5% for AGIs $75k-100k, 1.3% for AGIs $100k-200k, 0.9% for AGIs over 200k)
Taxes paid: $7,868 (reported on 40.8% of returns)
52340:
$7,868
State:
$8,846
(% of AGI for various income ranges: 2.9% for AGIs below $25k, 3.0% for AGIs $25k-50k, 4.6% for AGIs $50k-75k, 6.6% for AGIs $75k-100k, 7.0% for AGIs $100k-200k, 6.0% for AGIs over 200k)
Earned income credit: $2,036 (reported on 10.8% of returns)
Here:
$2,036
State:
$2,098
(% of AGI for various income ranges: 4.2% for AGIs below $25k, 0.6% for AGIs $25k-50k)
Percentage of individuals using paid preparers for their 2012 taxes: 58.5%
Here:
58%
State:
65%
(% for various income ranges: 51.4% for AGIs below $25k, 55.6% for AGIs $25k-50k, 59.1% for AGIs $50k-75k, 73.3% for AGIs $75k-100k, 72.2% for AGIs $100k-200k)
Averages for the 2004 tax year for zip code 52340, filed in 2005:
Average Adjusted Gross Income (AGI) in 2004: $42,564 (Individual Income Tax Returns)
Here:
$42,564
State:
$43,875
Salary/wage: $39,531 (reported on 90.9% of returns)
Here:
$39,531
State:
$38,265
(% of AGI for various income ranges: 95.0% for AGIs below $10k, 79.7% for AGIs $10k-25k, 90.9% for AGIs $25k-50k, 85.4% for AGIs $50k-75k, 86.8% for AGIs $75k-100k, 73.1% for AGIs over 100k)
Taxable interest for individuals: $990 (reported on 43.2% of returns)
This zip code:
$990
Iowa:
$1,768
(% of AGI for various income ranges: 6.4% for AGIs below $10k, 2.6% for AGIs $10k-25k, 0.5% for AGIs $25k-50k, 0.7% for AGIs $50k-75k, 0.8% for AGIs $75k-100k, 1.1% for AGIs over 100k)
Taxable dividends: $860 (reported on 23.8% of returns)
Here:
$860
State:
$2,510
(% of AGI for various income ranges: 1.6% for AGIs below $10k, 1.2% for AGIs $10k-25k, 0.2% for AGIs $25k-50k, 0.4% for AGIs $50k-75k, 0.2% for AGIs $75k-100k, 0.7% for AGIs over 100k)
Net capital gain/loss: +$7,319 (reported on 18.4% of returns)
Here:
+$7,319
State:
+$6,139
(% of AGI for various income ranges: -1.6% for AGIs below $10k, -0.1% for AGIs $10k-25k, 0.0% for AGIs $25k-50k, 0.3% for AGIs $50k-75k, 0.6% for AGIs $75k-100k, 15.8% for AGIs over 100k)
Profit/loss from business: +$5,895 (reported on 15.8% of returns)
Here:
+$5,895
State:
+$8,574
(% of AGI for various income ranges: 3.4% for AGIs below $10k, 4.4% for AGIs $10k-25k, 2.0% for AGIs $25k-50k, 3.4% for AGIs $50k-75k, 1.5% for AGIs $75k-100k, 0.3% for AGIs over 100k)
IRA payment deduction: $2,882 (reported on 1.9% of returns)
52340:
$2,882
Iowa:
$2,970
Total itemized deductions: $14,704 (22% of AGI, reported on 39.6% of returns)
Here:
$14,704
State:
$16,976
Here:
22.2% of AGI
State:
20.8% of AGI
(% of AGI for various income ranges: 12.3% for AGIs $10k-25k, 11.0% for AGIs $25k-50k, 14.5% for AGIs $50k-75k, 17.5% for AGIs $75k-100k, 14.3% for AGIs over 100k)
Charity contributions deductions: $1,565 (2% of AGI, reported on 33.1% of returns)
Here:
$1,565
State:
$3,089
Here:
2.3% of AGI
State:
3.6% of AGI
(% of AGI for various income ranges: 1.1% for AGIs $10k-25k, 0.8% for AGIs $25k-50k, 1.4% for AGIs $50k-75k, 2.0% for AGIs $75k-100k, 1.0% for AGIs over 100k)
Total tax: $4,748 (reported on 81.2% of returns)
52340:
$4,748
State:
$6,177
(% of AGI for various income ranges: 1.9% for AGIs below $10k, 4.7% for AGIs $10k-25k, 7.4% for AGIs $25k-50k, 8.5% for AGIs $50k-75k, 9.8% for AGIs $75k-100k, 13.8% for AGIs over 100k)
Earned income credit: $1,404 (reported on 11.0% of returns)
Here:
$1,404
State:
$1,540
Percentage of individuals using paid preparers for their 2004 taxes: 62.9%
Here:
63%
State:
70%
(% for various income ranges: 48.6% for AGIs below $10k, 61.4% for AGIs $10k-25k, 63.1% for AGIs $25k-50k, 72.8% for AGIs $50k-75k, 60.7% for AGIs $75k-100k, 75.9% for AGIs over 100k)
Household received Food Stamps/SNAP in the past 12 months: 36 Household did not receive Food Stamps/SNAP in the past 12 months: 1,995
Women who had a birth in the past 12 months: 174 (174 now married, 4 unmarried) Women who did not have a birth in the past 12 months: 1,124 (480 now married, 644 unmarried)
Housing units in zip code 52340 with a mortgage: 1,414 (174 second mortgage, 152 both second mortgage and home equity loan) Median monthly owner costs for units with a mortgage: $1,823 Median monthly owner costs for units without a mortgage: $967
Residents with income below the poverty level in 2022:
This zip code:
8.5%
Whole state:
11.0%
Residents with income below 50% of the poverty level in 2022:
This zip code:
1.7%
Whole state:
5.5%
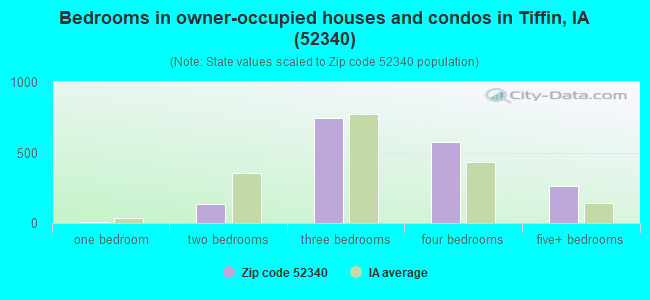
Median number of rooms in houses and condos:
Here:
7.1
State:
6.8
Median number of rooms in apartments:
Here:
4.2
State:
4.2
Notable locations in this zip code not listed on our city pages
Notable locations in zip code 52340: Tiffin (A), Tiffin East Bound Rest Area (B), Tiffin West Bound Rest Area (C), Tiffin School Community Library (D), Tiffin Fire Department and First Responders (E). Display/hide their locations on the map
Parks in zip code 52340 include: Historic Amana Colonies State Historical Marker (1), Historic Iowa City State Historical Marker (2), Hoover Historic Site State Historical Marker (3). Display/hide their locations on the map
Size of family households: 664 2-persons, 422 3-persons, 317 4-persons, 104 5-persons, 11 6-persons
Size of nonfamily households: 269 1-person, 216 2-persons
953 married couples with children.
463 single-parent households (80 men, 383 women).
90.9% of residents of 52340 zip code speak English at home.
3.8% of residents speak Spanish at home (56% very well, 10% well, 34% not well).
2.3% of residents speak other Indo-European language at home (75% very well, 25% well).
2.0% of residents speak Asian or Pacific Island language at home (67% very well, 33% well).
0.8% of residents speak other language at home (100% very well).
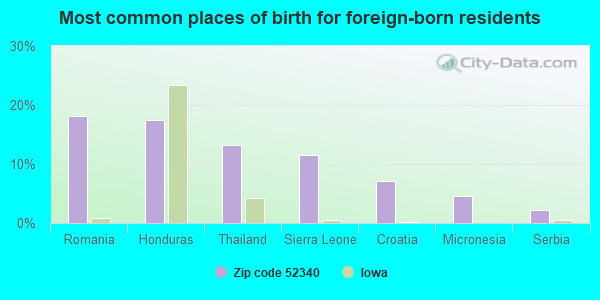
Foreign born population: 328 (6.3%) (73.7% of them are naturalized citizens)
This zip code:
6.3%
Whole state:
6.0%
18%Romania
17%Honduras
13%Thailand
12%Sierra Leone
7%Croatia
5%Micronesia
2%Serbia
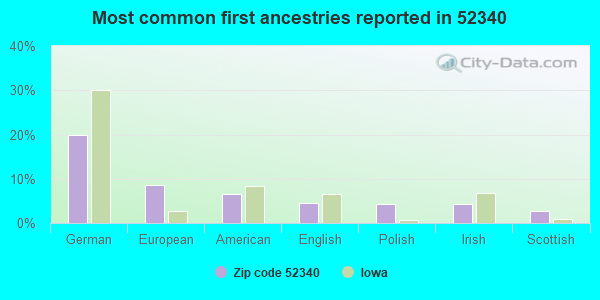
20%German
9%European
7%American
4%English
4%Polish
4%Irish
3%Scottish
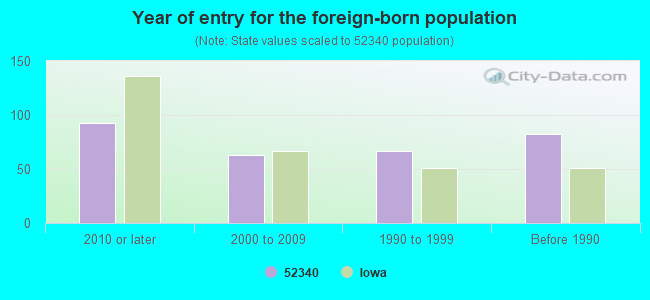
Year of entry for the foreign-born population
932010 or later
632000 to 2009
671990 to 1999
82Before 1990
Facilities with environmental interests located in this zip code:
TITRONICS R & D (400 STEPHANS ST in TIFFIN, IA)
(Resource Conservation and Recovery Act (tracking hazardous waste)) - ICIS-, ENFORCEMENT/COMPLIANCE ACTIVITY Organizations: TODD GRAPER (CONTACT/OPERATOR)
, ROGER TITONE (CONTACT/OWNER)
CLEAR CREEK AMANA HIGH SCHOOL (311 W MARENGO RD in TIFFIN, IA)
(National Center for Education Statistics) - STATE ID-521221 109 Conditionally Exempt Small Quantity Generators, less than 100 kg/month of hazardous waste (Resource Conservation and Recovery Act (tracking hazardous waste)) Business NAICS classification: ALL OTHER MISCELLANEOUS SCHOOLS AND INSTRUCTION. Organizations: CLEAR CREEK-AMANA COMM SCHOOL DISTRICT (SCHOOL DISTRICT)
TIFFIN CITY OF STP (99 BROWN STREET in TIFFIN, IA)
National Pollutant Discharge Elimination System NON-MAJOR (Tracking pollutant discharge elimination systems) - permit Business SIC classification: SEWERAGE SYSTEMS Organizations: CITY OF TIFFIN (CONTACT/OWNER)
P B BODY SHOP (RAILROAD & MAIN in TIFFIN, IA)
Small Quantity Generators, between 100 kg and 1000 kg of hazardous waste/month (Resource Conservation and Recovery Act (tracking hazardous waste)) Business NAICS classification: AUTOMOTIVE BODY, PAINT, AND INTERIOR REPAIR AND MAINTENANCE.
Housing units lacking complete kitchen facilities: 0.6%
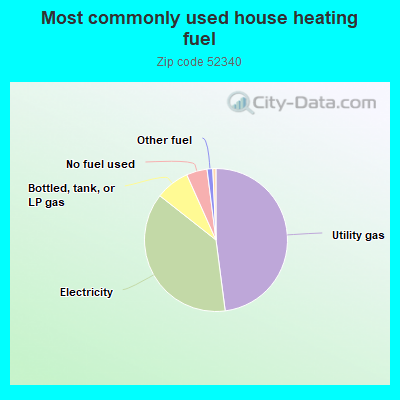
48.0%Utility gas
37.7%Electricity
7.7%Bottled, tank, or LP gas
4.7%No fuel used
1.3%Other fuel
0.7%Fuel oil, kerosene, etc.
Place of birth for U.S.-born residents:
This state: 3,730
Northeast: 50
Midwest: 742
South: 186
West: 182
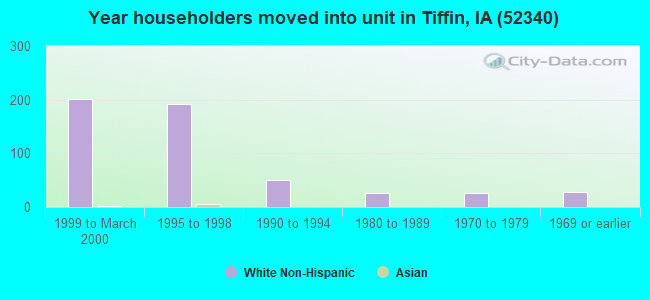
27% of the 52340 zip code residents lived in the same house 5 years ago. Out of people who lived in different houses, 54% lived in this county. Out of people who lived in different counties, 50% lived in Iowa.
78% of the 52340 zip code residents lived in the same house 1 year ago. Out of people who lived in different houses, 53% moved from this county. Out of people who lived in different houses, 20% moved from different county within same state. Out of people who lived in different houses, 24% moved from different state.
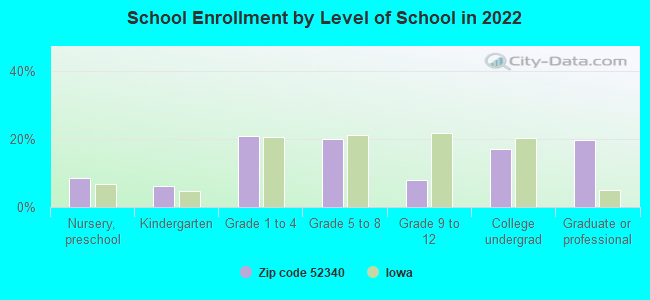
Private vs. public school enrollment:
Students in private schools in grades 1 to 8 (elementary and middle school):
Here:
0.0%
Iowa:
10.6%
Students in private schools in grades 9 to 12 (high school):
Here:
0.0%
Iowa:
7.9%
Students in private undergraduate colleges: 79
Here:
25.6%
Iowa:
23.9%
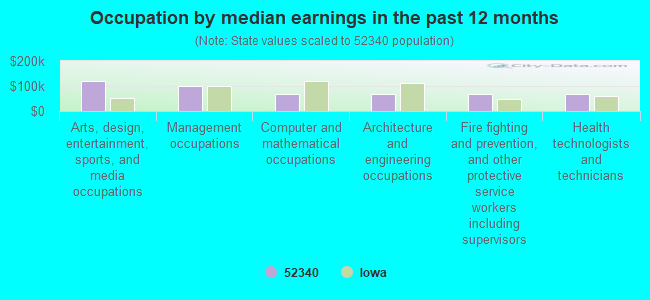
Occupation by median earnings in the past 12 months ($)
121,405Arts, design, entertainment, sports, and media occupations
101,143Management occupations
70,000Computer and mathematical occupations
69,354Architecture and engineering occupations
67,967Fire fighting and prevention, and other protective service workers including supervisors
66,776Health technologists and technicians
Top industries in this zip code by the number of employees in 2005:
Construction: Commercial and Institutional Building Construction (10-19 employees: 1 establishment)
Health Care and Social Assistance: Other Individual and Family Services (10-19: 1)
Other Services (except Public Administration): Religious Organizations (10-19: 1)
Construction: New Single-Family Housing Construction (except Operative Builders) (5-9: 2)
Other Services (except Public Administration): Commercial and Industrial Machinery and Equipment (except Automotive and Electronic) Repair and Maintenance (5-9: 1, 1-4: 1)
Other Services (except Public Administration): Automotive Body, Paint, and Interior Repair and Maintenance (5-9: 1, 1-4: 1)
Accommodation and Food Services: Limited-Service Restaurants (5-9: 1)
Fatal accident statistics in 2012:
Fatal accident count: 3
Vehicles involved in fatal accidents: 5
Fatal accidents caused by drunken drivers: 0
Fatalities: 4
Persons involved in fatal accidents: 9
Pedestrians involved in fatal accidents: 1
Fatal accident statistics in 2011:
Fatal accident count: 2
Vehicles involved in fatal accidents: 4
Fatal accidents caused by drunken drivers: 0
Fatalities: 2
Persons involved in fatal accidents: 14
Pedestrians involved in fatal accidents: 1
2002 - 2017 National Fire Incident Reporting System (NFIRS) incidents
Based on the data from the years 2002 - 2017 the average number of fire incidents per year is 26. The highest number of fire incidents - 47 took place in 2003, and the least - 0 in 2009. The data has an increasing trend.
When looking into fire subcategories, the most reports belonged to: Outside Fires (43.1%), and Structure Fires (31.0%).
Fire incident types reported to NFIRS in Zip Code 52340
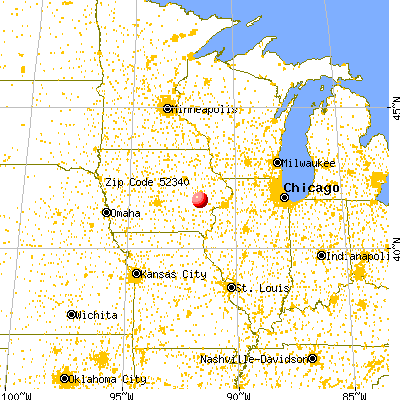


 Nearest zip codes: 52317, 52241, 52322, 52338, 52246, 52242.
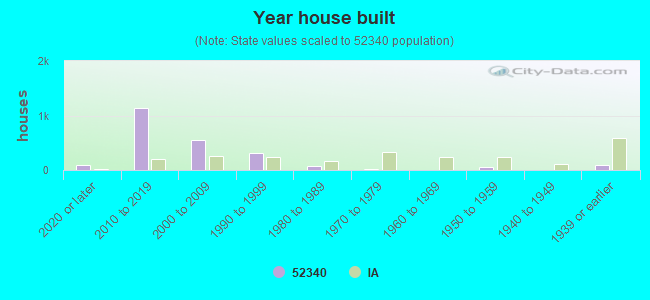


 Based on the data from the years 2002 - 2017 the average number of fire incidents per year is 26. The highest number of fire incidents - 47 took place in 2003, and the least - 0 in 2009. The data has an increasing trend.
 When looking into fire subcategories, the most reports belonged to: Outside Fires (43.1%), and Structure Fires (31.0%).