Races in Portage, Michigan (MI) Detailed Stats
Data:
Races - White alone (%)
Races - White alone (% change since 2000)
Races - Black alone (%)
Races - Black alone (% change since 2000)
Races - American Indian alone (%)
Races - American Indian alone (% change since 2000)
Races - Asian alone (%)
Races - Asian alone (% change since 2000)
Races - Hispanic (%)
Races - Hispanic (% change since 2000)
Races - Native Hawaiian and Other Pacific Islander alone (%)
Races - Native Hawaiian and Other Pacific Islander alone (% change since 2000)
Races - Two or more races(%)
Races - Two or more races(% change since 2000)
Races - Other race alone (%)
Races - Other race alone (% change since 2000)
Racial diversity
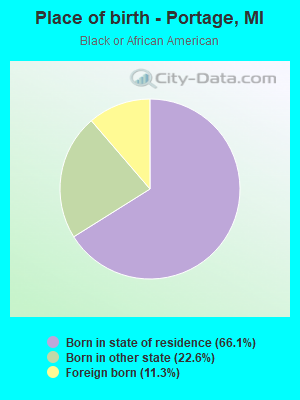
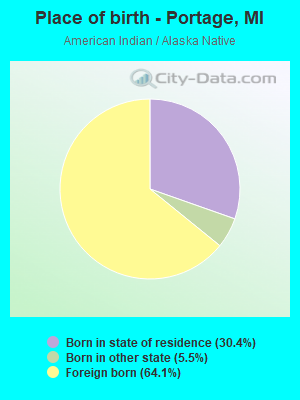
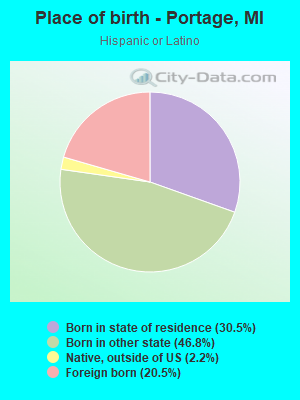
Place of birth - Born in state of residence (%)
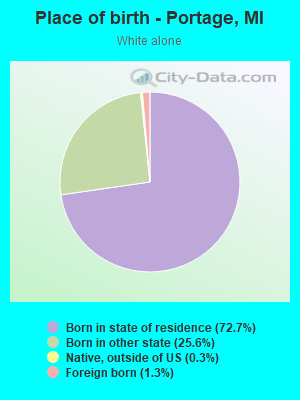
Place of birth - Born in state of residence (%) - White
Place of birth - Born in state of residence (%) - Black or African American
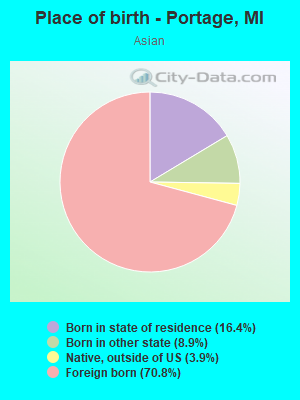
Place of birth - Born in state of residence (%) - Asian
Place of birth - Born in state of residence (%) - Hispanic or Latino
Place of birth - Born in state of residence (%) - American Indian and Alaska Native
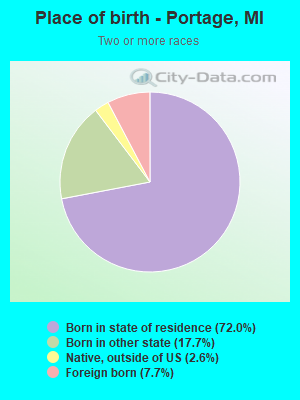
Place of birth - Born in state of residence (%) - Multirace
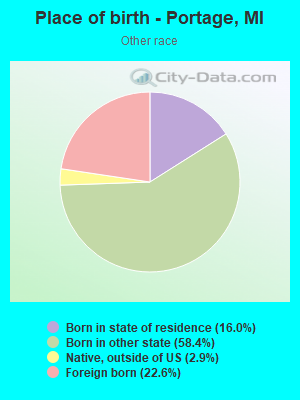
Place of birth - Born in state of residence (%) - Other Race
Place of birth - Born in other state (%)
Place of birth - Born in other state (%) - White
Place of birth - Born in other state (%) - Black or African American
Place of birth - Born in other state (%) - Asian
Place of birth - Born in other state (%) - Hispanic or Latino
Place of birth - Born in other state (%) - American Indian and Alaska Native
Place of birth - Born in other state (%) - Multirace
Place of birth - Born in other state (%) - Other Race
Place of birth - Native, outside of US (%)
Place of birth - Native, outside of US (%) - White
Place of birth - Native, outside of US (%) - Black or African American
Place of birth - Native, outside of US (%) - Asian
Place of birth - Native, outside of US (%) - Hispanic or Latino
Place of birth - Native, outside of US (%) - American Indian and Alaska Native
Place of birth - Native, outside of US (%) - Multirace
Place of birth - Native, outside of US (%) - Other Race
Place of birth - Foreign born (%)
Place of birth - Foreign born (%) - White
Place of birth - Foreign born (%) - Black or African American
Place of birth - Foreign born (%) - Asian
Place of birth - Foreign born (%) - Hispanic or Latino
Place of birth - Foreign born (%) - American Indian and Alaska Native
Place of birth - Foreign born (%) - Multirace
Place of birth - Foreign born (%) - Other Race
Residents speaking English at home (%)
Residents speaking English at home - Born in the United States (%)
Residents speaking English at home - Native, born elsewhere (%)
Residents speaking English at home - Foreign born (%)
Residents speaking Spanish at home (%)
Residents speaking Spanish at home - Born in the United States (%)
Residents speaking Spanish at home - Native, born elsewhere (%)
Residents speaking Spanish at home - Foreign born (%)
Residents speaking other language at home (%)
Residents speaking other language at home - Born in the United States (%)
Residents speaking other language at home - Native, born elsewhere (%)
Residents speaking other language at home - Foreign born (%)
Marital status - Never married (%)
Marital status - Now married (%)
Marital status - Separated (%)
Marital status - Widowed (%)
Marital status - Divorced (%)
Ancestries Reported - Arab (%)
Ancestries Reported - Czech (%)
Ancestries Reported - Danish (%)
Ancestries Reported - Dutch (%)
Ancestries Reported - English (%)
Ancestries Reported - French (%)
Ancestries Reported - French Canadian (%)
Ancestries Reported - German (%)
Ancestries Reported - Greek (%)
Ancestries Reported - Hungarian (%)
Ancestries Reported - Irish (%)
Ancestries Reported - Italian (%)
Ancestries Reported - Lithuanian (%)
Ancestries Reported - Norwegian (%)
Ancestries Reported - Polish (%)
Ancestries Reported - Portuguese (%)
Ancestries Reported - Russian (%)
Ancestries Reported - Scotch-Irish (%)
Ancestries Reported - Scottish (%)
Ancestries Reported - Slovak (%)
Ancestries Reported - Subsaharan African (%)
Ancestries Reported - Swedish (%)
Ancestries Reported - Swiss (%)
Ancestries Reported - Ukrainian (%)
Ancestries Reported - United States (%)
Ancestries Reported - Welsh (%)
Ancestries Reported - West Indian (%)
Ancestries Reported - Other (%)
Geographical mobility - Same house 1 year ago (%)
Geographical mobility - Same house 1 year ago (%) - White
Geographical mobility - Same house 1 year ago (%) - Black or African American
Geographical mobility - Same house 1 year ago (%) - Asian
Geographical mobility - Same house 1 year ago (%) - Hispanic or Latino
Geographical mobility - Same house 1 year ago (%) - American Indian and Alaska Native
Geographical mobility - Same house 1 year ago (%) - Multirace
Geographical mobility - Same house 1 year ago (%) - Other Race
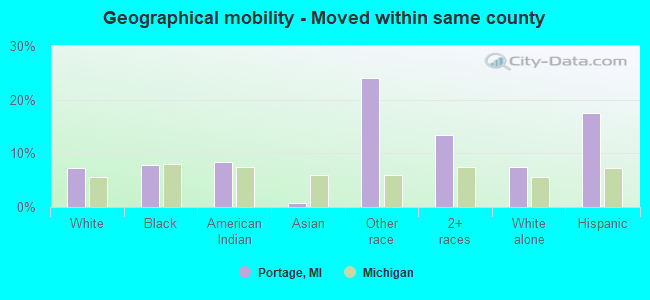
Geographical mobility - Moved within same county (%)
Geographical mobility - Moved within same county (%) - White
Geographical mobility - Moved within same county (%) - Black or African American
Geographical mobility - Moved within same county (%) - Asian
Geographical mobility - Moved within same county (%) - Hispanic or Latino
Geographical mobility - Moved within same county (%) - American Indian and Alaska Native
Geographical mobility - Moved within same county (%) - Multirace
Geographical mobility - Moved within same county (%) - Other Race
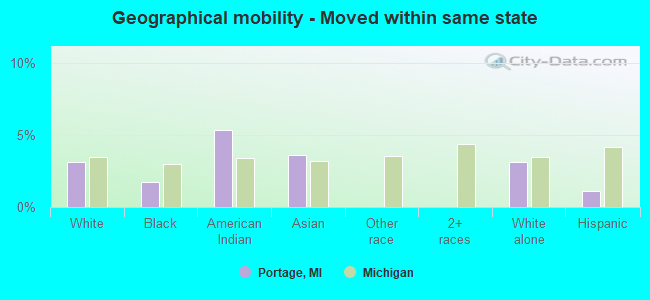
Geographical mobility - Moved from different county within same state (%)
Geographical mobility - Moved from different county within same state (%) - White
Geographical mobility - Moved from different county within same state (%) - Black or African American
Geographical mobility - Moved from different county within same state (%) - Asian
Geographical mobility - Moved from different county within same state (%) - Hispanic or Latino
Geographical mobility - Moved from different county within same state (%) - American Indian and Alaska Native
Geographical mobility - Moved from different county within same state (%) - Multirace
Geographical mobility - Moved from different county within same state (%) - Other Race
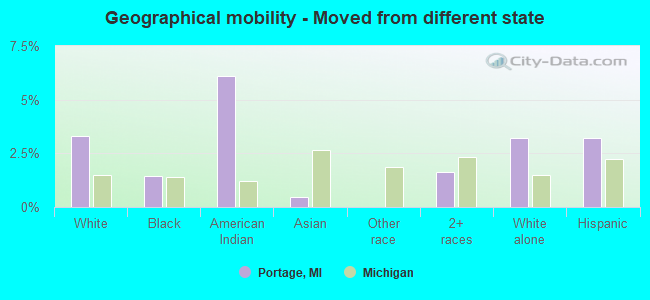
Geographical mobility - Moved from different state (%)
Geographical mobility - Moved from different state (%) - White
Geographical mobility - Moved from different state (%) - Black or African American
Geographical mobility - Moved from different state (%) - Asian
Geographical mobility - Moved from different state (%) - Hispanic or Latino
Geographical mobility - Moved from different state (%) - American Indian and Alaska Native
Geographical mobility - Moved from different state (%) - Multirace
Geographical mobility - Moved from different state (%) - Other Race
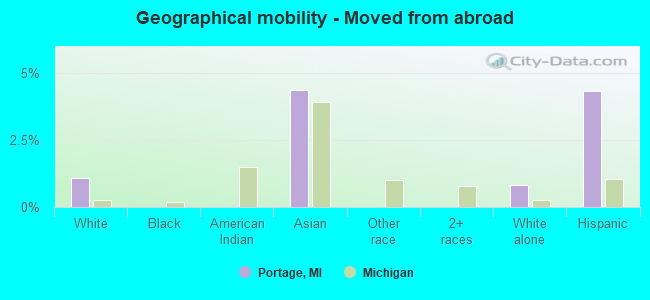
Geographical mobility - Moved from abroad (%)
Geographical mobility - Moved from abroad (%) - White
Geographical mobility - Moved from abroad (%) - Black or African American
Geographical mobility - Moved from abroad (%) - Asian
Geographical mobility - Moved from abroad (%) - Hispanic or Latino
Geographical mobility - Moved from abroad (%) - American Indian and Alaska Native
Geographical mobility - Moved from abroad (%) - Multirace
Geographical mobility - Moved from abroad (%) - Other Race
Place of birth for the foreign-born population - Ireland (%)
Place of birth for the foreign-born population - Denmark (%)
Place of birth for the foreign-born population - Norway (%)
Place of birth for the foreign-born population - Sweden (%)
Place of birth for the foreign-born population - United Kingdom (%)
Place of birth for the foreign-born population - England (%)
Place of birth for the foreign-born population - Scotland (%)
Place of birth for the foreign-born population - Other Northern Europe (%)
Place of birth for the foreign-born population - Austria (%)
Place of birth for the foreign-born population - Belgium (%)
Place of birth for the foreign-born population - France (%)
Place of birth for the foreign-born population - Germany (%)
Place of birth for the foreign-born population - Netherlands (%)
Place of birth for the foreign-born population - Switzerland (%)
Place of birth for the foreign-born population - Other Western Europe (%)
Place of birth for the foreign-born population - Greece (%)
Place of birth for the foreign-born population - Italy (%)
Place of birth for the foreign-born population - Portugal (%)
Place of birth for the foreign-born population - Spain (%)
Place of birth for the foreign-born population - Other Southern Europe (%)
Place of birth for the foreign-born population - Albania (%)
Place of birth for the foreign-born population - Belarus (%)
Place of birth for the foreign-born population - Bosnia and Herzegovina (%)
Place of birth for the foreign-born population - Bulgaria (%)
Place of birth for the foreign-born population - Croatia (%)
Place of birth for the foreign-born population - Czechoslovakia (%)
Place of birth for the foreign-born population - Hungary (%)
Place of birth for the foreign-born population - Latvia (%)
Place of birth for the foreign-born population - Lithuania (%)
Place of birth for the foreign-born population - North Macedonia (Macedonia) (%)
Place of birth for the foreign-born population - Moldova (%)
Place of birth for the foreign-born population - Poland (%)
Place of birth for the foreign-born population - Romania (%)
Place of birth for the foreign-born population - Russia (%)
Place of birth for the foreign-born population - Serbia (%)
Place of birth for the foreign-born population - Ukraine (%)
Place of birth for the foreign-born population - Other Eastern Europe (%)
Place of birth for the foreign-born population - China (%)
Place of birth for the foreign-born population - Hong Kong (%)
Place of birth for the foreign-born population - Taiwan (%)
Place of birth for the foreign-born population - Japan (%)
Place of birth for the foreign-born population - Korea (%)
Place of birth for the foreign-born population - Other Eastern Asia (%)
Place of birth for the foreign-born population - Afghanistan (%)
Place of birth for the foreign-born population - Bangladesh (%)
Place of birth for the foreign-born population - India (%)
Place of birth for the foreign-born population - Iran (%)
Place of birth for the foreign-born population - Kazakhstan (%)
Place of birth for the foreign-born population - Nepal (%)
Place of birth for the foreign-born population - Pakistan (%)
Place of birth for the foreign-born population - Sri Lanka (%)
Place of birth for the foreign-born population - Uzbekistan (%)
Place of birth for the foreign-born population - Other South Central Asia (%)
Place of birth for the foreign-born population - Burma (%)
Place of birth for the foreign-born population - Cambodia (%)
Place of birth for the foreign-born population - Indonesia (%)
Place of birth for the foreign-born population - Laos (%)
Place of birth for the foreign-born population - Malaysia (%)
Place of birth for the foreign-born population - Philippines (%)
Place of birth for the foreign-born population - Singapore (%)
Place of birth for the foreign-born population - Thailand (%)
Place of birth for the foreign-born population - Vietnam (%)
Place of birth for the foreign-born population - Other South Eastern Asia (%)
Place of birth for the foreign-born population - Armenia (%)
Place of birth for the foreign-born population - Iraq (%)
Place of birth for the foreign-born population - Israel (%)
Place of birth for the foreign-born population - Jordan (%)
Place of birth for the foreign-born population - Kuwait (%)
Place of birth for the foreign-born population - Lebanon (%)
Place of birth for the foreign-born population - Saudi Arabia (%)
Place of birth for the foreign-born population - Syria (%)
Place of birth for the foreign-born population - Turkey (%)
Place of birth for the foreign-born population - Yemen (%)
Place of birth for the foreign-born population - Other Western Asia (%)
Place of birth for the foreign-born population - Eritrea (%)
Place of birth for the foreign-born population - Ethiopia (%)
Place of birth for the foreign-born population - Kenya (%)
Place of birth for the foreign-born population - Somalia (%)
Place of birth for the foreign-born population - Uganda (%)
Place of birth for the foreign-born population - Zimbabwe (%)
Place of birth for the foreign-born population - Other Eastern Africa (%)
Place of birth for the foreign-born population - Cameroon (%)
Place of birth for the foreign-born population - Congo (%)
Place of birth for the foreign-born population - Democratic Republic of Congo (Zaire) (%)
Place of birth for the foreign-born population - Other Middle Africa (%)
Place of birth for the foreign-born population - Egypt (%)
Place of birth for the foreign-born population - Morocco (%)
Place of birth for the foreign-born population - Sudan (%)
Place of birth for the foreign-born population - Other Northern Africa (%)
Place of birth for the foreign-born population - South Africa (%)
Place of birth for the foreign-born population - Other Southern Africa (%)
Place of birth for the foreign-born population - Cabo Verde (%)
Place of birth for the foreign-born population - Ghana (%)
Place of birth for the foreign-born population - Liberia (%)
Place of birth for the foreign-born population - Nigeria (%)
Place of birth for the foreign-born population - Senegal (%)
Place of birth for the foreign-born population - Sierra Leone (%)
Place of birth for the foreign-born population - Other Western Africa (%)
Place of birth for the foreign-born population - Australia (%)
Place of birth for the foreign-born population - New Zealand (%)
Place of birth for the foreign-born population - Fiji (%)
Place of birth for the foreign-born population - Micronesia (%)
Place of birth for the foreign-born population - Bahamas (%)
Place of birth for the foreign-born population - Barbados (%)
Place of birth for the foreign-born population - Cuba (%)
Place of birth for the foreign-born population - Dominica (%)
Place of birth for the foreign-born population - Dominican Republic (%)
Place of birth for the foreign-born population - Grenada (%)
Place of birth for the foreign-born population - Haiti (%)
Place of birth for the foreign-born population - Jamaica (%)
Place of birth for the foreign-born population - St. Vincent and the Grenadines (%)
Place of birth for the foreign-born population - Trinidad and Tobago (%)
Place of birth for the foreign-born population - West Indies (%)
Place of birth for the foreign-born population - Other Caribbean (%)
Place of birth for the foreign-born population - Belize (%)
Place of birth for the foreign-born population - Costa Rica (%)
Place of birth for the foreign-born population - El Salvador (%)
Place of birth for the foreign-born population - Guatemala (%)
Place of birth for the foreign-born population - Honduras (%)
Place of birth for the foreign-born population - Mexico (%)
Place of birth for the foreign-born population - Nicaragua (%)
Place of birth for the foreign-born population - Panama (%)
Place of birth for the foreign-born population - Other Central America (%)
Place of birth for the foreign-born population - Argentina (%)
Place of birth for the foreign-born population - Bolivia (%)
Place of birth for the foreign-born population - Brazil (%)
Place of birth for the foreign-born population - Chile (%)
Place of birth for the foreign-born population - Colombia (%)
Place of birth for the foreign-born population - Ecuador (%)
Place of birth for the foreign-born population - Guyana (%)
Place of birth for the foreign-born population - Peru (%)
Place of birth for the foreign-born population - Uruguay (%)
Place of birth for the foreign-born population - Venezuela (%)
Place of birth for the foreign-born population - Other South America (%)
Place of birth for the foreign-born population - Canada (%)
Place of birth for the foreign-born population - Other Northern America (%)
Place of birth for the foreign-born population - Other (%)
Latest news about races in Portage, MI collected exclusively by city-data.com from local newspapers, TV, and radio stations
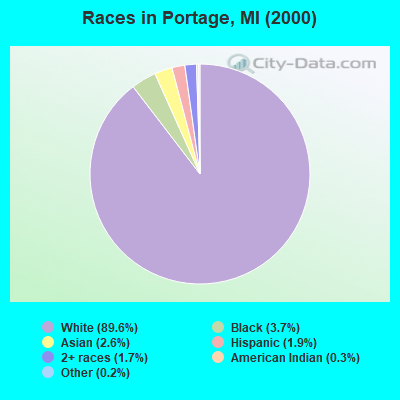
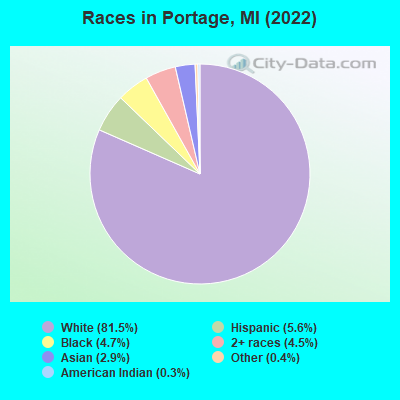
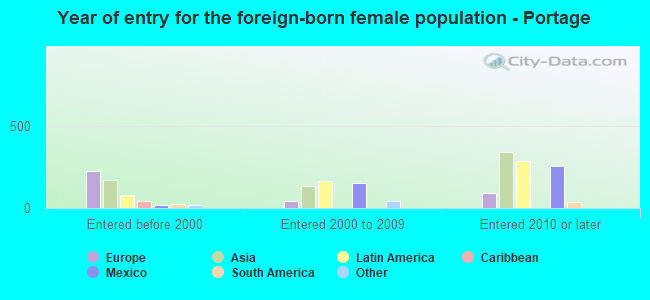
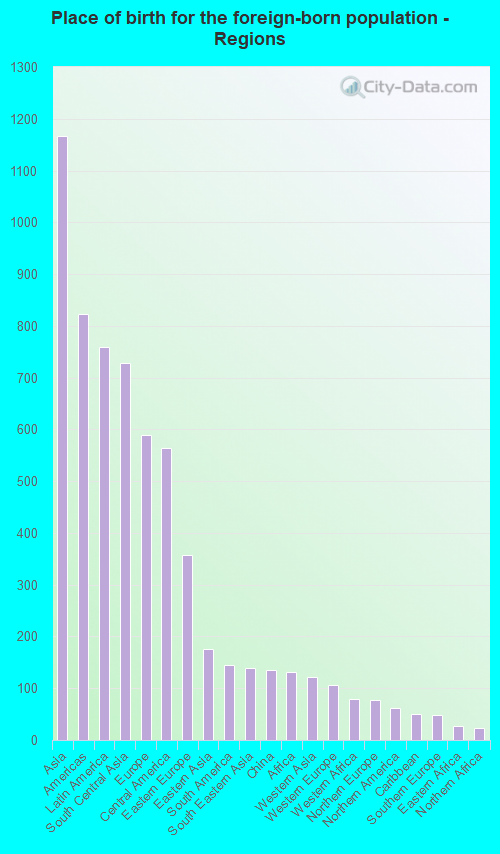
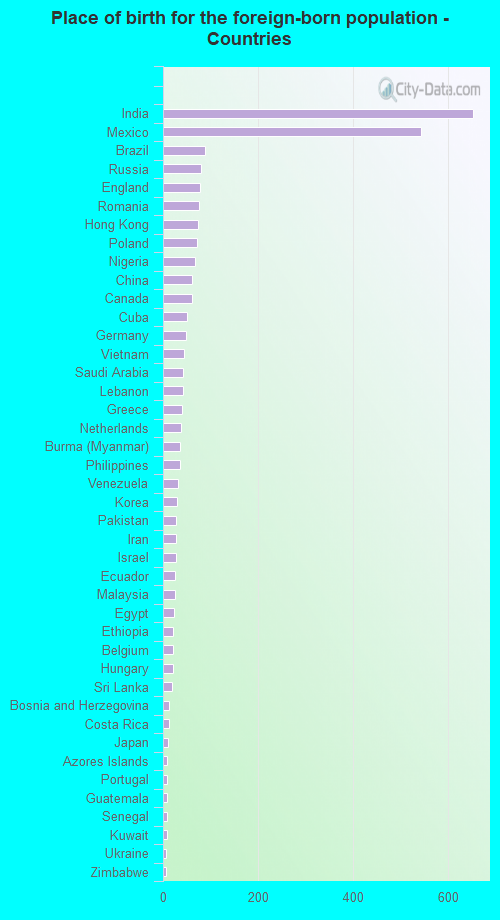
According to 2022 data, the most numerous races in Portage, MI are White alone (39,839 residents), Black alone (2,318 residents), and Hispanic (2,746 residents). 92.2% of Portage residents speak English at home. 5.5% of Portage, MI residents are foreign-born (2.4% born in Asia, 1.6% born in Latin America, 1.2% born in Europe), which is 8.2% less than the foreign-born rate of 6.0% across the entire state of Michigan.
Race distribution in Portage
2000 2022
7,806,691 78.6% White alone 1,402,047 14.1% Black alone 323,877 3.3% Hispanic 175,311 1.8% Asian alone 163,487 1.6% Two or more races 53,421 0.5% American Indian alone 11,465 0.1% Other race alone 2,145 0.02% Native Hawaiian and Other
7,289,051 72.6% White alone 1,310,464 13.1% Black alone 572,405 5.7% Hispanic 450,031 4.5% Two or more races 335,732 3.3% Asian alone 45,217 0.5% Other race alone 29,011 0.3% American Indian alone 2,207 0.02% Native Hawaiian and Other
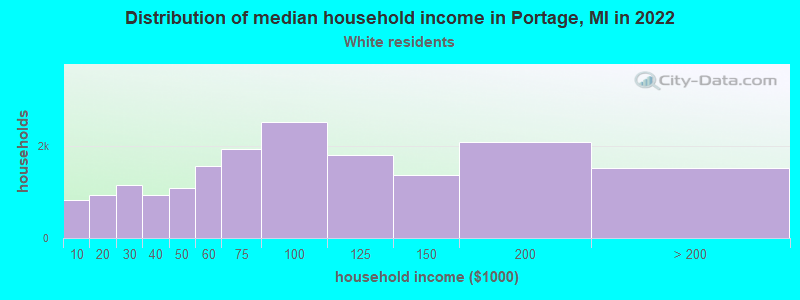
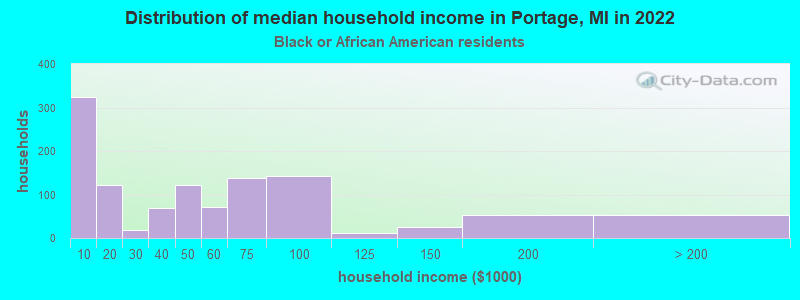
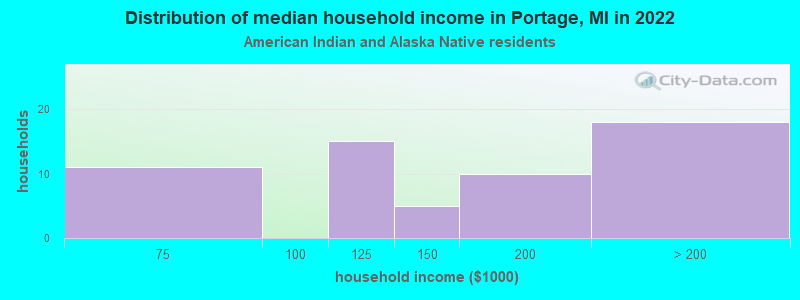
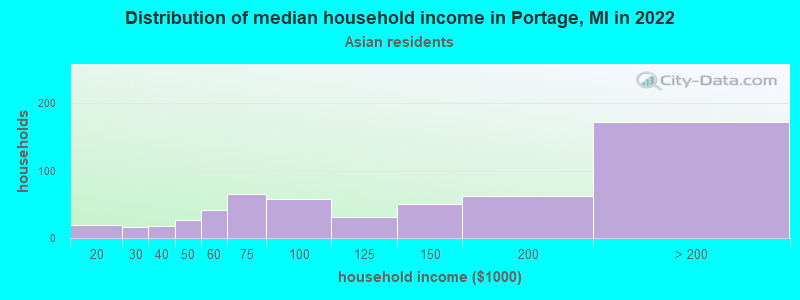
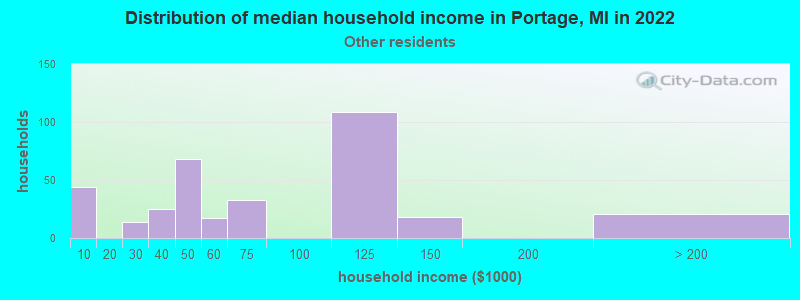
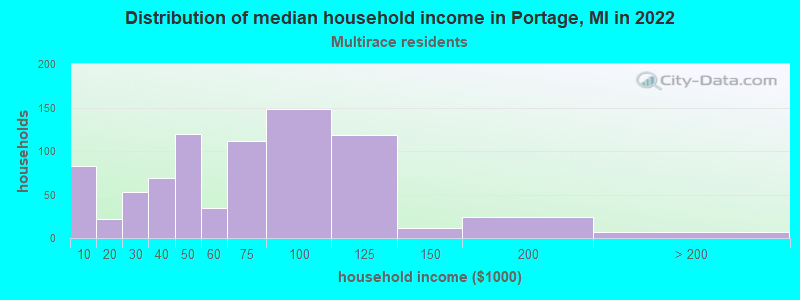
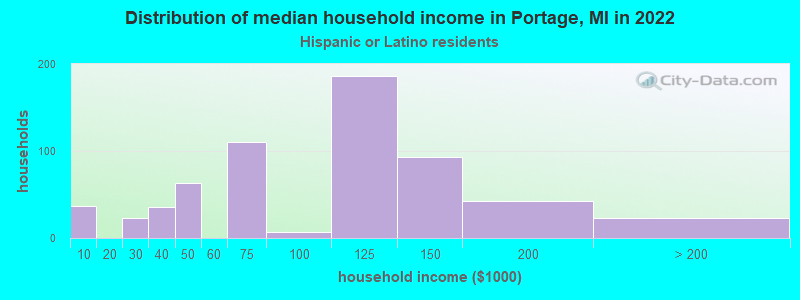
Income and house value in Portage Median household income in 2022 $77,219 White non-Hispanic householders$47,439 Black householders$122,713 American Indian and Alaska Native householders$147,682 Asian householders$56,687 Two or more races householders$118,033 Hispanic or Latino race householdersMedian 2022 house value $256,119 White Non-Hispanic householders$257,175 Black or African American householders$218,293 American Indian or Alaska Native householders $306,413 Asian householders$197,372 Some other race householders$205,613 Two or more races householders$218,293 Hispanic or Latino householders
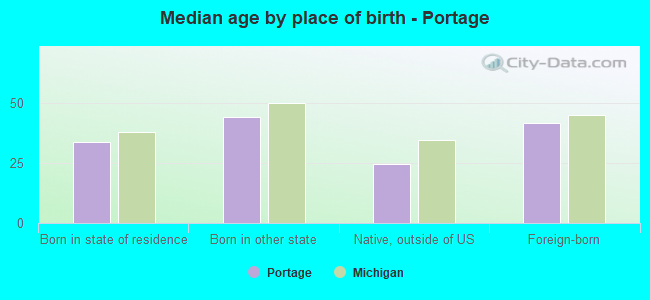
Median age by race in Portage
39.9 Median age for White residents38.7 42.0 24.3 Median age for Black or African American residents20.9 26.0 40.4 Median age for American Indian / Alaska Native residents42.7 45.0 38.8 Median age for Asian residents35.1 39.5 -670,531,400.3 Median age for Native Hawaiian / Pacific Islander residents-666,666,666.0 -699,588,476.7 33.1 Median age for Other race residents31.6 42.7 20.1 Median age for Two or more races residents24.6 15.8 40.8 Median age for White alone residents39.0 42.5 22.8 Median age for Hispanic or Latino residents22.1 24.7
Owner/renter occupied households by race in Portage
House owners and renters - White residents 12,367 69.5% Owner occupied5,428 30.5% Renter occupiedHouse owners and renters - Black or African American residents 300 25.6% Owner occupied874 74.4% Renter occupiedHouse owners and renters - American Indian / Alaska Native residents 29 55.0% Owner occupied23 45.0% Renter occupiedHouse owners and renters - Asian residents 330 57.4% Owner occupied244 42.6% Renter occupiedHouse owners and renters - Other race residents 172 50.2% Owner occupied171 49.8% Renter occupiedHouse owners and renters - Two or more races residents 367 48.6% Owner occupied389 51.4% Renter occupiedHouse owners and renters - White alone residents 12,292 69.8% Owner occupied5,306 30.2% Renter occupiedHouse owners and renters - Hispanic or Latino residents 281 47.8% Owner occupied308 52.2% Renter occupied
Language usage in Portage
English speakers - Total 92.2% of residents of Portage speak English at home.
3.0% of residents speak Spanish at home 1,039 74.6% Speak English very well354 25.4% Speak English less than very well4.9% of residents speak other language at home 2,025 89.0% Speak English very well251 11.0% Speak English less than very well
English speakers - Born in the United States 92.0% of residents of Portage speak English at home.
2.1% of residents speak Spanish at home 259 100.0% Speak English very well2.8% of residents speak other language at home 337 100.0% Speak English very well
English speakers - Native, born elsewhere 62.6% of residents of Portage speak English at home.
6.4% of residents speak Spanish at home 27 100.0% Speak English very well7.9% of residents speak other language at home 33 100.0% Speak English very well
English speakers - Foreign-born 23.6% of residents of Portage speak English at home.
17.8% of residents speak Spanish at home 202 43.4% Speak English very well263 56.6% Speak English less than very well59.3% of residents speak other language at home 1,297 83.6% Speak English very well255 16.4% Speak English less than very well
White (Caucasian) - Speak only English Native:
98.7% (37,505)Foreign-born:
47.5% (339)
White (Caucasian) - Speak another language Native:
1.3% (500)Foreign-born:
54.3% (388)
Black or African American - Speak only English Native:
92.0% (1,730)Foreign-born:
21.6% (58)
Black or African American - Speak another language Native:
2.0% (37)Foreign-born:
78.5% (209)
American Indian / Alaska Native - Speak another language Native:
24.5% (24)Foreign-born:
100.0% (93)
Asian - Speak only English Native:
39.7% (112)Foreign-born:
15.3% (152)
Asian - Speak another language Native:
64.4% (182)Foreign-born:
83.1% (825)
Other race - Speak another language Native:
53.6% (316)Foreign-born:
100.0% (204)
Two or more races - Speak only English Native:
88.9% (2,273)Foreign-born:
19.5% (49)
Two or more races - Speak another language Native:
6.4% (164)Foreign-born:
80.6% (203)
White alone - Speak only English Native:
99.0% (37,108)Foreign-born:
46.0% (250)
White alone - Speak another language Native:
0.9% (347)Foreign-born:
54.2% (295)
Hispanic or Latino - Speak only English Native:
65.9% (1,264)Foreign-born:
10.3% (58)
Hispanic or Latino - Speak another language Native:
34.6% (662)Foreign-born:
81.6% (462)
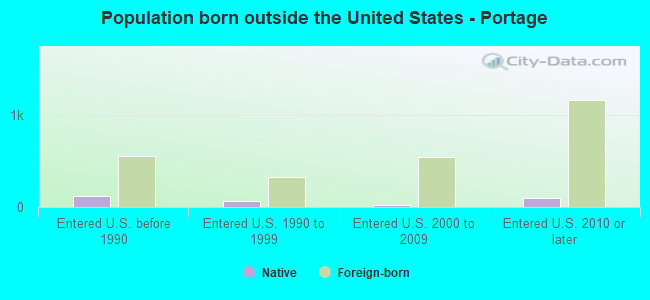
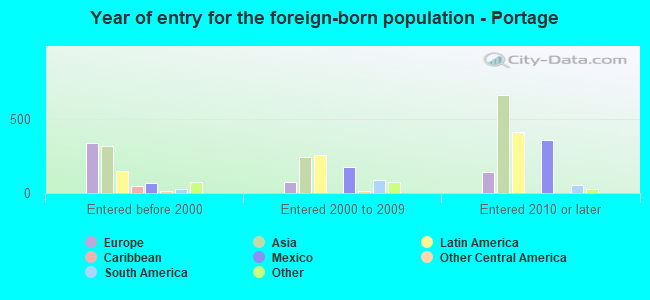
Foreign-born residents in Portage 2,710 residents are foreign born (2.4% Asia , 1.6% Latin America , 1.2% Europe ).
This city:
5.5%Michigan:
6.9%
Marital status for residents in Portage Marital status - White (Caucasian) population 15 years and over
Males 34.3% Never married53.3% Now married0.9% Separated2.5% Widowed9.0% DivorcedFemales 26.1% Never married52.5% Now married0.4% Separated8.0% Widowed13.0% DivorcedWomen who gave birth in the past 12 months Now married:
83.7% (346)Unmarried:
16.3% (67)
Women who did not give birth in the past 12 months Now married:
45.9% (4,089)Unmarried:
54.1% (4,825)
Marital status - Black or African American population 15 years and over
Males 51.8% Never married43.7% Now married0.0% Separated0.0% Widowed4.5% DivorcedFemales 64.2% Never married20.0% Now married5.1% Separated2.3% Widowed8.3% DivorcedWomen who did not give birth in the past 12 months Now married:
19.4% (147)Unmarried:
80.6% (613)
Marital status - American Indian / Alaska Native population 15 years and over
Males 9.6% Never married58.9% Now married12.3% Separated0.0% Widowed19.2% DivorcedFemales 16.2% Never married72.1% Now married0.0% Separated0.0% Widowed11.8% DivorcedWomen who did not give birth in the past 12 months Now married:
70.8% (47)Unmarried:
29.2% (20)
Marital status - Asian population 15 years and over
Males 23.6% Never married75.0% Now married0.0% Separated1.4% Widowed0.0% DivorcedFemales 16.1% Never married66.5% Now married0.0% Separated9.1% Widowed8.3% DivorcedWomen who gave birth in the past 12 months Now married:
100.0% (47)Unmarried:
0.0% (0)
Women who did not give birth in the past 12 months Now married:
70.2% (302)Unmarried:
29.8% (128)
Marital status - Other race population 15 years and over
Males 44.0% Never married50.7% Now married0.0% Separated0.0% Widowed5.3% DivorcedFemales 34.2% Never married36.9% Now married0.0% Separated7.8% Widowed21.0% DivorcedWomen who did not give birth in the past 12 months Now married:
41.2% (112)Unmarried:
58.8% (160)
Marital status - Two or more races population 15 years and over
Males 44.5% Never married54.9% Now married0.5% Separated0.0% Widowed0.1% DivorcedFemales 63.1% Never married27.4% Now married3.8% Separated2.0% Widowed3.8% DivorcedWomen who gave birth in the past 12 months Now married:
100.0% (35)Unmarried:
0.0% (0)
Women who did not give birth in the past 12 months Now married:
21.2% (158)Unmarried:
78.8% (586)
Marital status - White alone, not Hispanic / Latino population 15 years and over
Males 33.9% Never married53.6% Now married0.9% Separated2.6% Widowed9.0% DivorcedFemales 26.2% Never married52.3% Now married0.4% Separated8.1% Widowed13.0% DivorcedWomen who gave birth in the past 12 months Now married:
83.7% (346)Unmarried:
16.3% (67)
Women who did not give birth in the past 12 months Now married:
45.5% (3,968)Unmarried:
54.5% (4,758)
Marital status - Hispanic or Latino population 15 years and over
Males 40.5% Never married56.9% Now married0.0% Separated0.0% Widowed2.6% DivorcedFemales 28.7% Never married54.4% Now married0.0% Separated4.1% Widowed12.8% DivorcedWomen who gave birth in the past 12 months Now married:
100.0% (29)Unmarried:
0.0% (0)
Women who did not give birth in the past 12 months Now married:
55.4% (295)Unmarried:
44.6% (237)
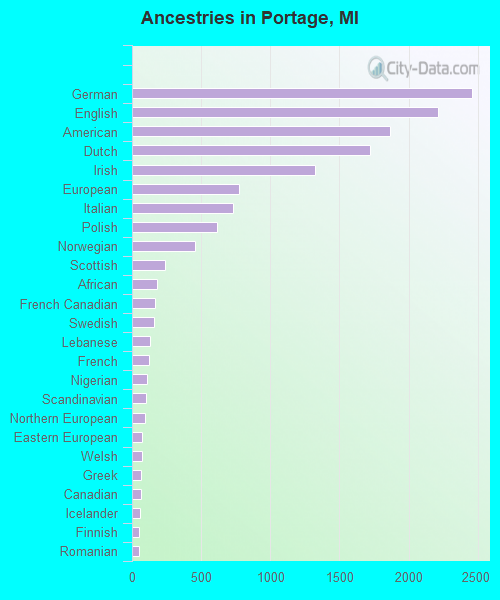
Ancestries in Portage
2,459 12.5% German2,212 11.3% English1,865 9.5% American1,723 8.8% Dutch1,322 6.7% Irish777 4.0% European727 3.7% Italian618 3.2% Polish458 2.3% Norwegian241 1.2% Scottish180 0.9% African165 0.8% French Canadian162 0.8% Swedish129 0.7% Lebanese123 0.6% French105 0.5% Nigerian99 0.5% Scandinavian91 0.5% Northern European75 0.4% Eastern European73 0.4% Welsh67 0.3% Greek65 0.3% Canadian61 0.3% Icelander54 0.3% Finnish52 0.3% Romanian51 0.3% Lithuanian50 0.3% Hungarian48 0.2% Scotch-Irish45 0.2% Egyptian39 0.2% British34 0.2% Iranian33 0.2% Brazilian24 0.1% Ethiopian21 0.1% Croatian20 0.1% Serbian19 0.10% Czechoslovakian18 0.09% Czech16 0.08% Danish16 0.08% Ukrainian12 0.06% Russian11 0.06% Portuguese11 0.06% Jamaican11 0.06% Trinidadian and Tobagonian10 0.05% Yugoslavian9 0.05% Belgian8 0.04% Latvian8 0.04% Zimbabwean6 0.03% Maltese5 0.03% Slovak
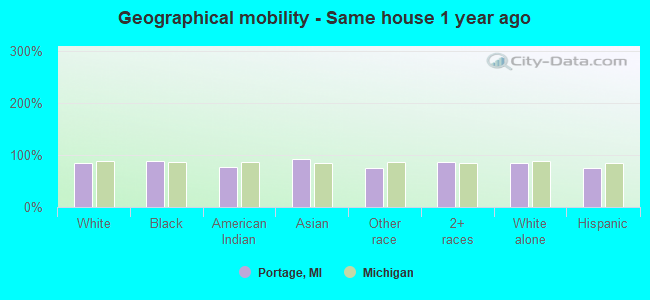
Geographical mobility in Portage Same house 1 year ago 34,652 85.7% White (Caucasian)2,186 89.3% Black or African American161 77.1% American Indian / Alaska Native1,228 92.5% Asian678 74.6% Other race2,759 86.4% Two or more races33,987 85.6% White alone, not Hispanic / Latino2,008 74.5% Hispanic or LatinoMoved within same county 2,908 7.2% White / Caucasian191 7.8% Black or African American18 8.4% American Indian / Alaska Native10 0.7% Asian218 24.0% Other race426 13.3% Two or more races2,954 7.4% White alone, not Hispanic / Latino474 17.6% Hispanic or LatinoMoved within same state 1,264 3.1% White / Caucasian43 1.7% Black or African American11 5.4% American Indian / Alaska Native48 3.7% Asian1,243 3.1% White alone, not Hispanic / Latino31 1.1% Hispanic or LatinoMoved from different state 1,332 3.3% White / Caucasian35 1.4% Black or African American13 6.1% American Indian / Alaska Native6 0.5% Asian51 1.6% Two or more races1,283 3.2% White alone, not Hispanic / Latino87 3.2% Hispanic or LatinoMoved from abroad 444 1.1% White58 4.4% Asian319 0.8% White alone, not Hispanic / Latino117 4.3% Hispanic or Latino
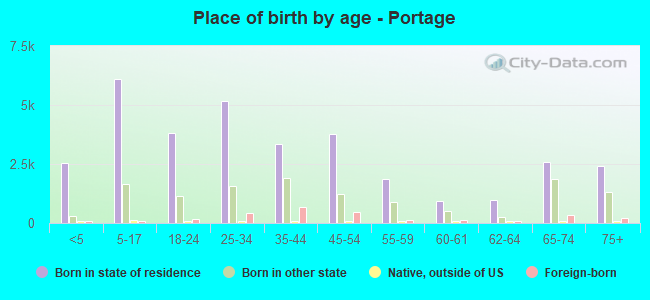
Children Nativity (place of birth) in Portage
Children under 6 years - Living with two parents Both parents native 2,306 100.0% NativeBoth parents foreign-born 264 84.4% Native49 15.6% Foreign-bornOne native, one foreign-born parent 225 100.0% NativeChildren under 6 years - Living with one parent Native parent 763 100.0% NativeChildren 6 to 17 years - Living with two parents Both parents native 5,035 100.0% NativeBoth parents foreign-born 199 62.0% Native122 38.0% Foreign-bornOne native, one foreign-born parent 260 70.2% Native110 29.8% Foreign-bornChildren 6 to 17 years - Living with one parent Native parent 1,396 100.0% NativeForeign-born parent 83 47.9% Native90 52.1% Foreign-born
Grandparents responsible for own grandchildren in Portage
Grandparents (30 to 59 years) White / Caucasian 70 59.6% Responsible for grandchildren48 40.4% Not responsible for grandchildrenBlack or African American 11 100.0% Not responsible for grandchildrenWhite alone, not Hispanic / Latino 70 59.6% Responsible for grandchildren48 40.4% Not responsible for grandchildrenGrandparents (60 years and over) White / Caucasian 137 55.9% Responsible for grandchildren108 44.1% Not responsible for grandchildrenWhite alone, not Hispanic / Latino 137 54.0% Responsible for grandchildren117 46.0% Not responsible for grandchildren