Races in Riverview, Michigan (MI) Detailed Stats
Ancestries, Foreign-born residents, place of birth
Settings
X


Recent posts about races in Riverview, Michigan on our local forum with over 2,400,000 registered users:
 | Where to live near Troy, Michigan :) (19 replies) |
| Renting a house vs. apartment in Downriver area (8 replies) |
| To Michigan from Vermont - advice (28 replies) |
| Moving to Livonia? Schools? (19 replies) |
| Trying to figure out Detroit suburbs... (93 replies) |
| South Warren: Livable for my situation? (5 replies) |
Latest news about races in Riverview, MI collected exclusively by city-data.com from local newspapers, TV, and radio stations
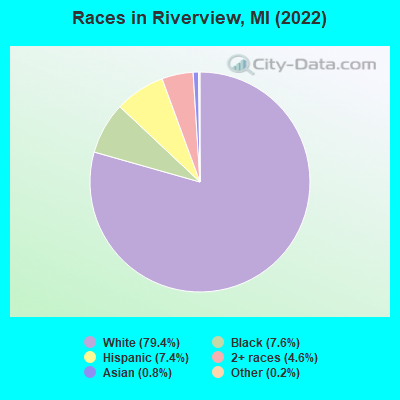
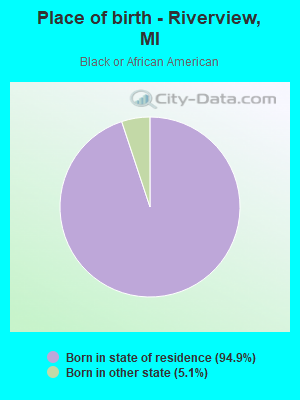
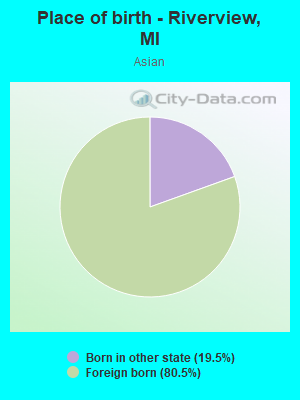
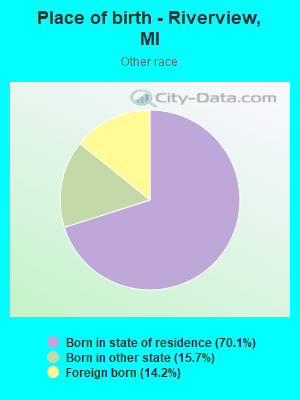
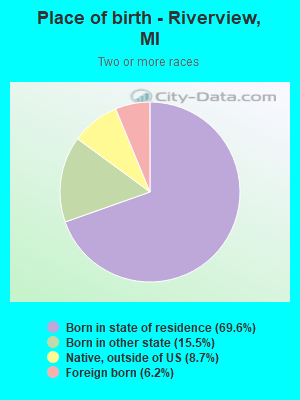
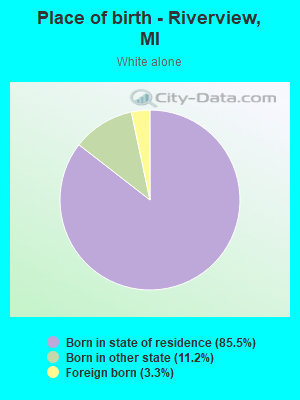
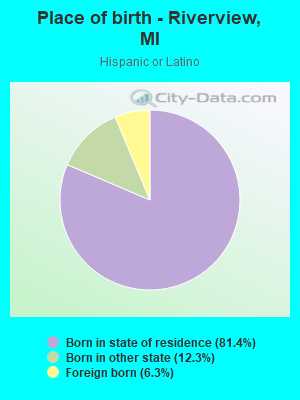
According to 2022 data, the most numerous races in Riverview, MI are White alone (9,706 residents), Black alone (923 residents), and Hispanic (909 residents). 94.1% of Riverview residents speak English at home. 3.8% of Riverview, MI residents are foreign-born (1.5% born in Europe, 1.5% born in Asia, 0.6% born in Latin America), which is 58.0% less than the foreign-born rate of 6.0% across the entire state of Michigan.
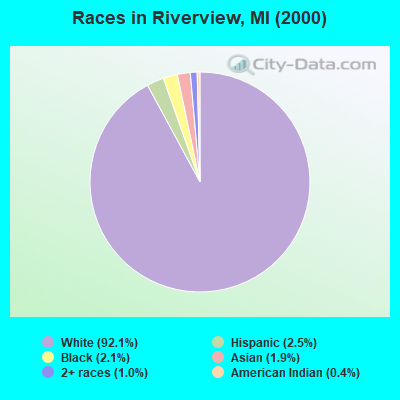
Race distribution in Riverview
2000
2022

- 12,22792.1%White alone
- 3272.5%Hispanic
- 2752.1%Black alone
- 2481.9%Asian alone
- 1271.0%Two or more races
- 530.4%American Indian alone
- 130.10%Other race alone
- 20.02%Native Hawaiian and Other
Pacific Islander alone
-
- 9,70679.4%White alone
- 9237.6%Black alone
- 9097.4%Hispanic
- 5634.6%Two or more races
- 1030.8%Asian alone
- 300.2%Other race alone
2000
2022
-
- 7,806,69178.6%White alone
- 1,402,04714.1%Black alone
- 323,8773.3%Hispanic
- 175,3111.8%Asian alone
- 163,4871.6%Two or more races
- 53,4210.5%American Indian alone
- 11,4650.1%Other race alone
- 2,1450.02%Native Hawaiian and Other
Pacific Islander alone

-
- 7,289,05172.6%White alone
- 1,310,46413.1%Black alone
- 572,4055.7%Hispanic
- 450,0314.5%Two or more races
- 335,7323.3%Asian alone
- 45,2170.5%Other race alone
- 29,0110.3%American Indian alone
- 2,2070.02%Native Hawaiian and Other
Pacific Islander alone

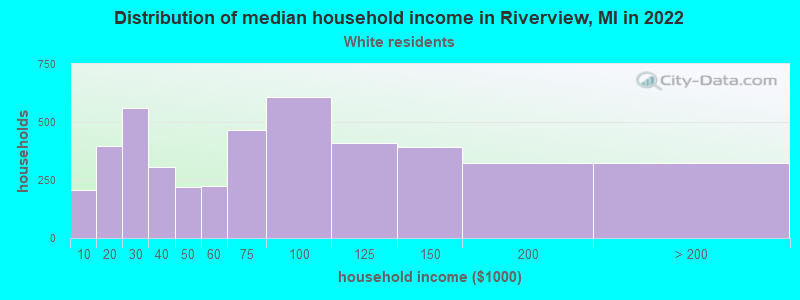
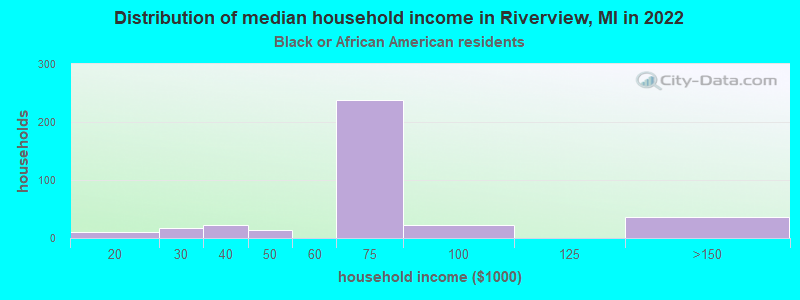
Income and house value in Riverview
- Median household income in 2022
- $68,283White non-Hispanic householders
- $67,804Black householders
- $80,701Some other race householders
- $80,692Hispanic or Latino race householders
- Median 2022 house value
- $208,369White Non-Hispanic householders
- $308,136Black or African American householders
- $49,598American Indian or Alaska Native householders
- $890,774Asian householders
- $106,892Some other race householders
- $26,366Two or more races householders
- $195,970Hispanic or Latino householders
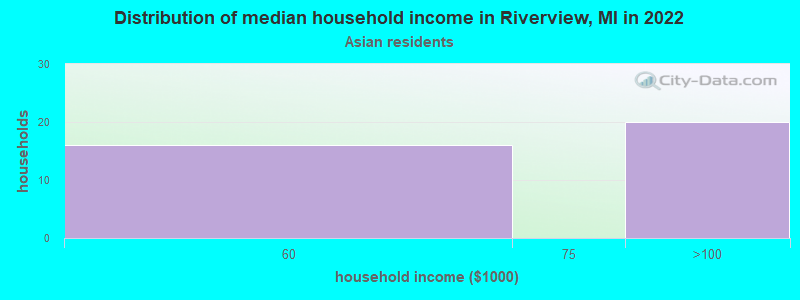
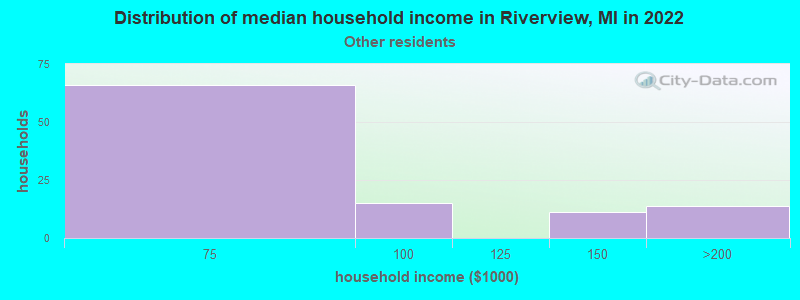
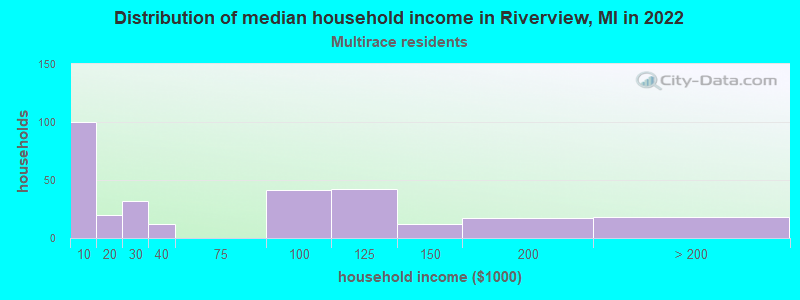
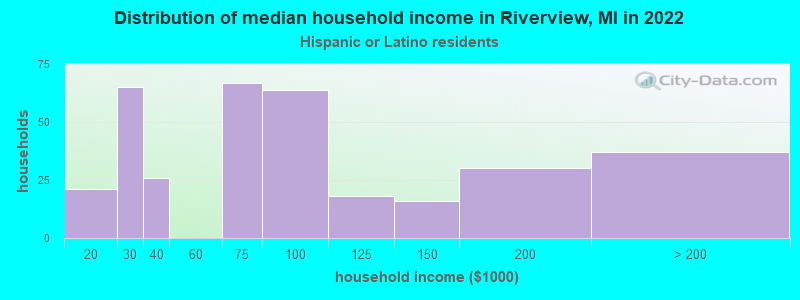
Household income for White non-Hispanic householders
Household income for Black householders
Household income for Asian householders
Household income for Some other race householders
Household income for Two or more races householders
Household income for Hispanic or Latino race householders
Median age by race in Riverview
- 44.4Median age for White residents
- 41.9Males
- 50.1Females
- 25.3Median age for Black or African American residents
- 25.4Males
- 46.6Females
- -738,693,466.6Median age for American Indian / Alaska Native residents
- -795,074,757.3Males
- -684,380,031.5Females
- 75.2Median age for Asian residents
- 74.8Males
- 38.1Females
- -934,108,526.2Median age for Native Hawaiian / Pacific Islander residents
- -674,772,035.8Males
- -699,588,476.7Females
- 47.7Median age for Other race residents
- 79.6Males
- 38.2Females
- 29.9Median age for Two or more races residents
- 27.7Males
- 31.9Females
- 44.6Median age for White alone residents
- 41.8Males
- 49.7Females
- 37.0Median age for Hispanic or Latino residents
- 31.8Males
- 44.3Females
Owner/renter occupied households by race in Riverview
- House owners and renters - White residents
- 2,96767.9%Owner occupied
- 1,40432.1%Renter occupied
- House owners and renters - Black or African American residents
- 318.8%Owner occupied
- 32391.2%Renter occupied
- House owners and renters - Asian residents
- 35100.0%Owner occupied
- House owners and renters - Other race residents
- 8880.2%Owner occupied
- 2219.8%Renter occupied
- House owners and renters - Two or more races residents
- 13139.9%Owner occupied
- 19860.1%Renter occupied
- House owners and renters - White alone residents
- 2,97268.5%Owner occupied
- 1,36831.5%Renter occupied
- House owners and renters - Hispanic or Latino residents
- 17050.2%Owner occupied
- 16849.8%Renter occupied
Language usage in Riverview
- English speakers - Total
- 94.1% of residents of Riverview speak English at home.
- 1.4% of residents speak Spanish at home
- 13984.8%Speak English very well
- 2515.2%Speak English less than very well
- 4.3% of residents speak other language at home
- 27154.5%Speak English very well
- 22645.5%Speak English less than very well
- English speakers - Born in the United States
- 92.4% of residents of Riverview speak English at home.
- 4.8% of residents speak Spanish at home
- 5076.9%Speak English very well
- 1523.1%Speak English less than very well
- 2.9% of residents speak other language at home
- 1743.6%Speak English very well
- 2256.4%Speak English less than very well
- English speakers - Native, born elsewhere
- 0.0% of residents of Riverview speak English at home.
- 70.7% of residents speak other language at home
- 29100.0%Speak English very well
- English speakers - Foreign-born
- 24.4% of residents of Riverview speak English at home.
- 12.4% of residents speak Spanish at home
- 4576.3%Speak English very well
- 1423.7%Speak English less than very well
- 64.4% of residents speak other language at home
- 10133.0%Speak English very well
- 20567.0%Speak English less than very well
White (Caucasian) - Speak only English
| Native: | 99.5% (8,830) |
| Foreign-born: | 35.2% (106) |
White (Caucasian) - Speak another language
| Native: | 1.5% (135) |
| Foreign-born: | 65.2% (197) |
Asian - Speak another language
| Native: | 100.0% (21) |
| Foreign-born: | 82.6% (68) |
Other race - Speak another language
| Native: | 21.1% (47) |
| Foreign-born: | 100.0% (36) |
Two or more races - Speak another language
| Native: | 17.9% (163) |
| Foreign-born: | 100.0% (62) |
White alone - Speak only English
| Native: | 98.9% (8,584) |
| Foreign-born: | 33.6% (108) |
White alone - Speak another language
| Native: | 1.6% (137) |
| Foreign-born: | 65.8% (212) |
Hispanic or Latino - Speak another language
| Native: | 12.7% (112) |
| Foreign-born: | 100.0% (58) |
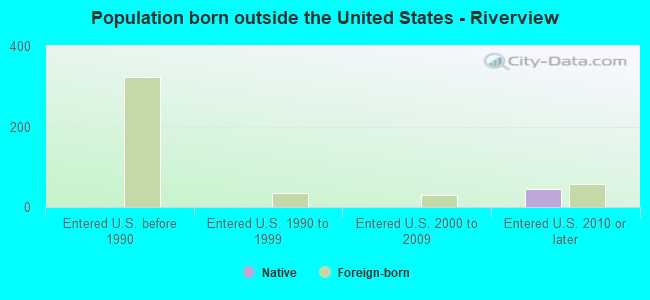
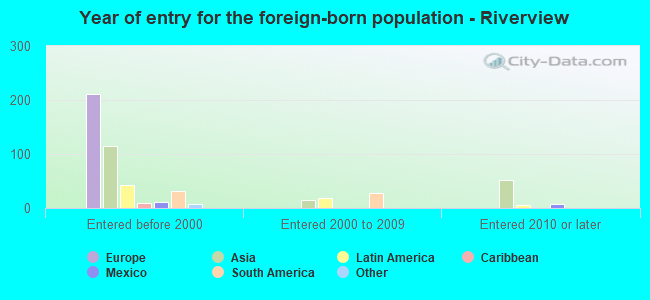
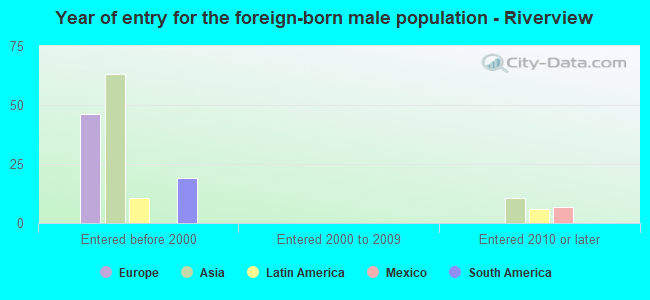
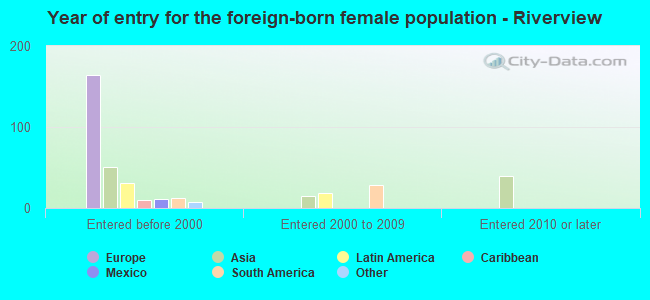
Foreign-born residents in Riverview
464 residents are foreign born (1.5% Europe, 1.5% Asia, 0.6% Latin America).
| This city: | 3.8% |
| Michigan: | 6.9% |

Marital status for residents in Riverview
Marital status - White (Caucasian) population 15 years and over
- Males
- 28.4%Never married
- 50.9%Now married
- 0.8%Separated
- 4.7%Widowed
- 15.3%Divorced
- Females
- 20.6%Never married
- 43.3%Now married
- 0.3%Separated
- 16.4%Widowed
- 19.4%Divorced
Women who gave birth in the past 12 months
| Now married: | 81.6% (38) |
| Unmarried: | 18.4% (8) |
Women who did not give birth in the past 12 months
| Now married: | 47.8% (826) |
| Unmarried: | 52.2% (904) |
Marital status - Black or African American population 15 years and over
- Males
- 89.3%Never married
- 8.3%Now married
- 0.4%Separated
- 0.0%Widowed
- 2.0%Divorced
- Females
- 26.6%Never married
- 25.5%Now married
- 0.0%Separated
- 28.6%Widowed
- 19.3%Divorced
Women who did not give birth in the past 12 months
| Now married: | 50.5% (47) |
| Unmarried: | 49.5% (46) |
Marital status - Asian population 15 years and over
- Males
- 0.0%Never married
- 100.0%Now married
- 0.0%Separated
- 0.0%Widowed
- 0.0%Divorced
- Females
- 32.8%Never married
- 67.2%Now married
- 0.0%Separated
- 0.0%Widowed
- 0.0%Divorced
Women who did not give birth in the past 12 months
| Now married: | 45.7% (16) |
| Unmarried: | 54.3% (19) |
Marital status - Other race population 15 years and over
- Males
- 0.0%Never married
- 86.2%Now married
- 0.0%Separated
- 0.0%Widowed
- 13.8%Divorced
- Females
- 33.7%Never married
- 39.4%Now married
- 0.0%Separated
- 0.0%Widowed
- 26.9%Divorced
Women who did not give birth in the past 12 months
| Now married: | 34.3% (25) |
| Unmarried: | 65.7% (47) |
Marital status - Two or more races population 15 years and over
- Males
- 73.9%Never married
- 13.5%Now married
- 2.0%Separated
- 0.0%Widowed
- 10.6%Divorced
- Females
- 41.5%Never married
- 16.8%Now married
- 0.0%Separated
- 12.5%Widowed
- 29.3%Divorced
Women who did not give birth in the past 12 months
| Now married: | 28.7% (87) |
| Unmarried: | 71.3% (215) |
Marital status - White alone, not Hispanic / Latino population 15 years and over
- Males
- 26.9%Never married
- 52.1%Now married
- 0.8%Separated
- 4.9%Widowed
- 15.3%Divorced
- Females
- 19.2%Never married
- 44.3%Now married
- 0.3%Separated
- 16.8%Widowed
- 19.4%Divorced
Women who gave birth in the past 12 months
| Now married: | 81.6% (39) |
| Unmarried: | 18.4% (9) |
Women who did not give birth in the past 12 months
| Now married: | 49.3% (844) |
| Unmarried: | 50.7% (869) |
Marital status - Hispanic or Latino population 15 years and over
- Males
- 46.6%Never married
- 40.2%Now married
- 0.0%Separated
- 0.0%Widowed
- 13.2%Divorced
- Females
- 57.9%Never married
- 14.7%Now married
- 0.0%Separated
- 8.8%Widowed
- 18.6%Divorced
Women who did not give birth in the past 12 months
| Now married: | 12.4% (29) |
| Unmarried: | 87.6% (204) |
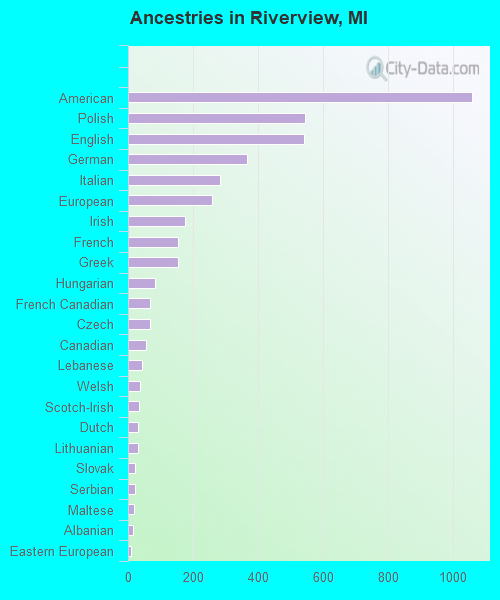
Ancestries in Riverview

- 1,05818.9%American
- 5459.8%Polish
- 5419.7%English
- 3666.5%German
- 2825.0%Italian
- 2594.6%European
- 1763.1%Irish
- 1552.8%French
- 1542.8%Greek
- 821.5%Hungarian
- 691.2%French Canadian
- 681.2%Czech
- 541.0%Canadian
- 440.8%Lebanese
- 380.7%Welsh
- 330.6%Scotch-Irish
- 310.6%Dutch
- 310.6%Lithuanian
- 230.4%Slovak
- 210.4%Serbian
- 190.3%Maltese
- 140.3%Albanian
- 100.2%Eastern European
- 80.1%Finnish
- 80.1%Russian
- 70.1%Scottish
- 60.1%Norwegian
- 40.07%British
- 20.04%Yugoslavian
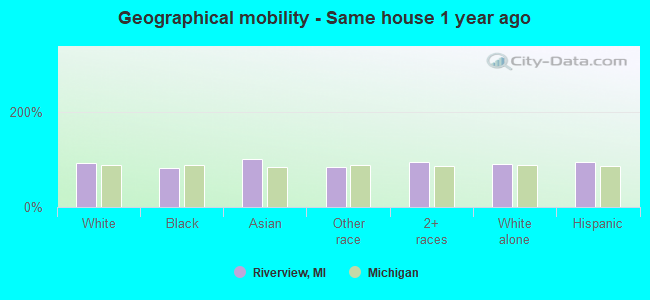
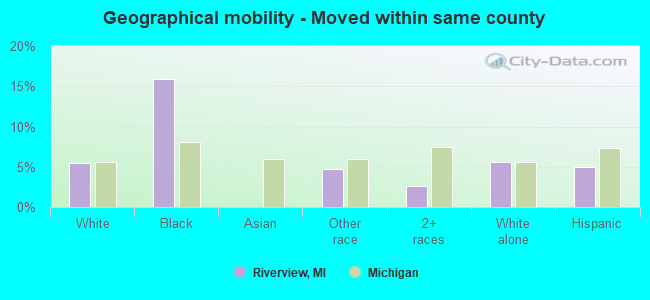
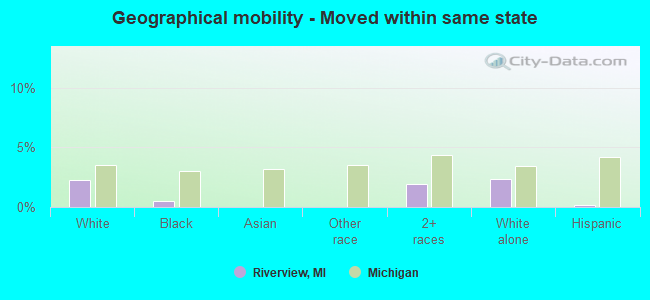
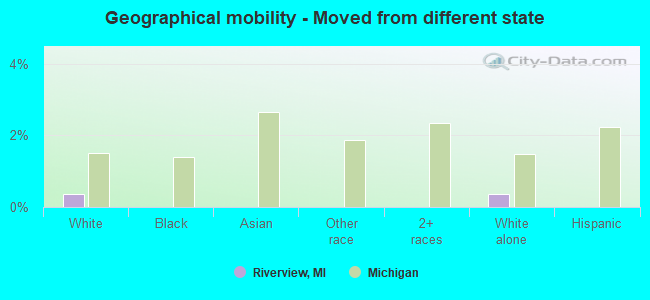
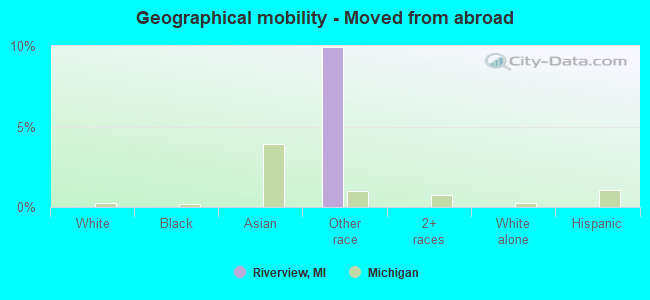
Geographical mobility in Riverview

- Same house 1 year ago
- 8,96491.6%White (Caucasian)
- 80382.4%Black or African American
- 107100.0%Asian
- 21383.8%Other race
- 94694.1%Two or more races
- 8,81991.4%White alone, not Hispanic / Latino
- 85593.6%Hispanic or Latino
-
- Moved within same county
- 5385.5%White / Caucasian
- 15616.0%Black or African American
- 124.7%Other race
- 272.7%Two or more races
- 5385.6%White alone, not Hispanic / Latino
- 465.0%Hispanic or Latino
-
- Moved within same state
- 2202.2%White / Caucasian
- 50.5%Black or African American
- 191.9%Two or more races
- 2242.3%White alone, not Hispanic / Latino
- 20.2%Hispanic or Latino
-
- Moved from different state
- 350.4%White / Caucasian
- 350.4%White alone, not Hispanic / Latino
-
- Moved from abroad
- 259.9%Other race
Children Nativity (place of birth) in Riverview
Place of birth for residents in Riverview
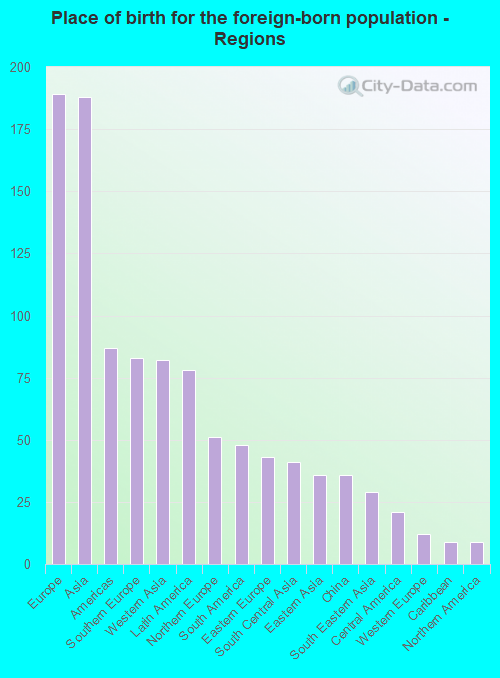
![Place of birth for the foreign-born population - Regions]()
- 189Europe
- 188Asia
- 87Americas
- 83Southern Europe
- 82Western Asia
- 78Latin America
- 51Northern Europe
- 48South America
- 43Eastern Europe
- 41South Central Asia
- 36Eastern Asia
- 36China
- 29South Eastern Asia
- 21Central America
- 12Western Europe
- 9Caribbean
- 9Northern America
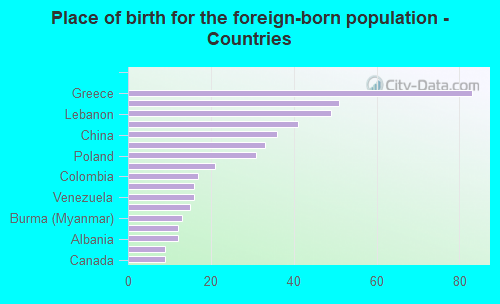
![Place of birth for the foreign-born population - Countries]()
- 83Greece
- 51England
- 49Lebanon
- 41India
- 36China
- 33Yemen
- 31Poland
- 21Mexico
- 17Colombia
- 16Philippines
- 16Venezuela
- 15Chile
- 13Burma (Myanmar)
- 12Germany
- 12Albania
- 9Cuba
- 9Canada
Zip codes: 48193.