Races in Sayville, New York (NY) Detailed Stats
Data:
Races - White alone (%)
Races - White alone (% change since 2000)
Races - Black alone (%)
Races - Black alone (% change since 2000)
Races - American Indian alone (%)
Races - American Indian alone (% change since 2000)
Races - Asian alone (%)
Races - Asian alone (% change since 2000)
Races - Hispanic (%)
Races - Hispanic (% change since 2000)
Races - Native Hawaiian and Other Pacific Islander alone (%)
Races - Native Hawaiian and Other Pacific Islander alone (% change since 2000)
Races - Two or more races(%)
Races - Two or more races(% change since 2000)
Races - Other race alone (%)
Races - Other race alone (% change since 2000)
Racial diversity
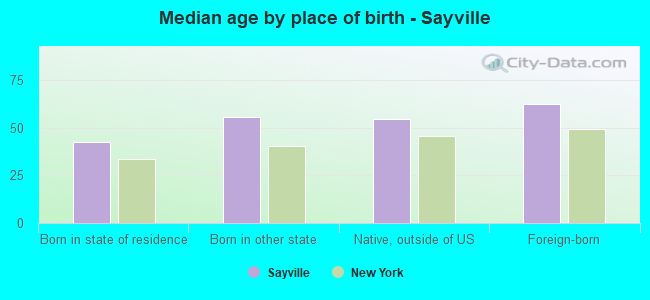
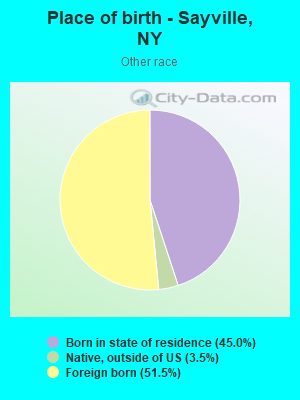
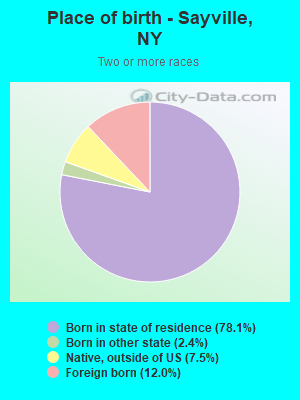
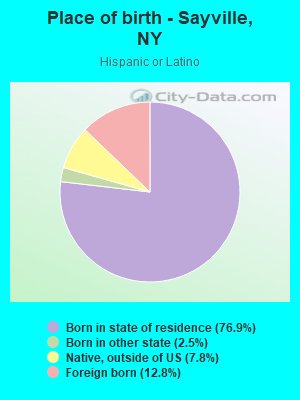
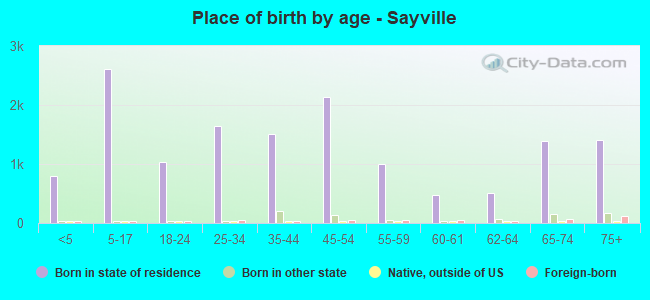
Place of birth - Born in state of residence (%)
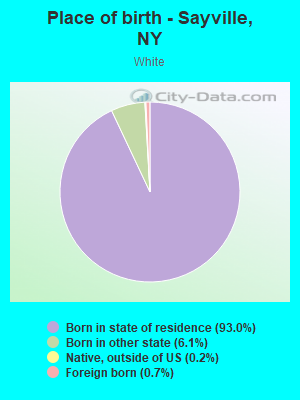
Place of birth - Born in state of residence (%) - White
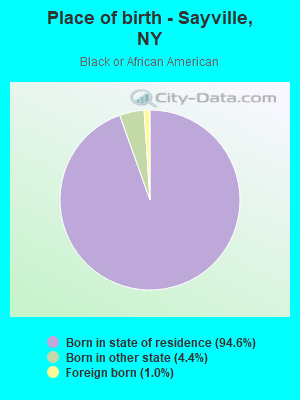
Place of birth - Born in state of residence (%) - Black or African American
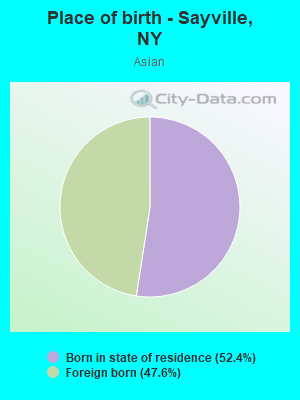
Place of birth - Born in state of residence (%) - Asian
Place of birth - Born in state of residence (%) - Hispanic or Latino
Place of birth - Born in state of residence (%) - American Indian and Alaska Native
Place of birth - Born in state of residence (%) - Multirace
Place of birth - Born in state of residence (%) - Other Race
Place of birth - Born in other state (%)
Place of birth - Born in other state (%) - White
Place of birth - Born in other state (%) - Black or African American
Place of birth - Born in other state (%) - Asian
Place of birth - Born in other state (%) - Hispanic or Latino
Place of birth - Born in other state (%) - American Indian and Alaska Native
Place of birth - Born in other state (%) - Multirace
Place of birth - Born in other state (%) - Other Race
Place of birth - Native, outside of US (%)
Place of birth - Native, outside of US (%) - White
Place of birth - Native, outside of US (%) - Black or African American
Place of birth - Native, outside of US (%) - Asian
Place of birth - Native, outside of US (%) - Hispanic or Latino
Place of birth - Native, outside of US (%) - American Indian and Alaska Native
Place of birth - Native, outside of US (%) - Multirace
Place of birth - Native, outside of US (%) - Other Race
Place of birth - Foreign born (%)
Place of birth - Foreign born (%) - White
Place of birth - Foreign born (%) - Black or African American
Place of birth - Foreign born (%) - Asian
Place of birth - Foreign born (%) - Hispanic or Latino
Place of birth - Foreign born (%) - American Indian and Alaska Native
Place of birth - Foreign born (%) - Multirace
Place of birth - Foreign born (%) - Other Race
Residents speaking English at home (%)
Residents speaking English at home - Born in the United States (%)
Residents speaking English at home - Native, born elsewhere (%)
Residents speaking English at home - Foreign born (%)
Residents speaking Spanish at home (%)
Residents speaking Spanish at home - Born in the United States (%)
Residents speaking Spanish at home - Native, born elsewhere (%)
Residents speaking Spanish at home - Foreign born (%)
Residents speaking other language at home (%)
Residents speaking other language at home - Born in the United States (%)
Residents speaking other language at home - Native, born elsewhere (%)
Residents speaking other language at home - Foreign born (%)
Marital status - Never married (%)
Marital status - Now married (%)
Marital status - Separated (%)
Marital status - Widowed (%)
Marital status - Divorced (%)
Ancestries Reported - Arab (%)
Ancestries Reported - Czech (%)
Ancestries Reported - Danish (%)
Ancestries Reported - Dutch (%)
Ancestries Reported - English (%)
Ancestries Reported - French (%)
Ancestries Reported - French Canadian (%)
Ancestries Reported - German (%)
Ancestries Reported - Greek (%)
Ancestries Reported - Hungarian (%)
Ancestries Reported - Irish (%)
Ancestries Reported - Italian (%)
Ancestries Reported - Lithuanian (%)
Ancestries Reported - Norwegian (%)
Ancestries Reported - Polish (%)
Ancestries Reported - Portuguese (%)
Ancestries Reported - Russian (%)
Ancestries Reported - Scotch-Irish (%)
Ancestries Reported - Scottish (%)
Ancestries Reported - Slovak (%)
Ancestries Reported - Subsaharan African (%)
Ancestries Reported - Swedish (%)
Ancestries Reported - Swiss (%)
Ancestries Reported - Ukrainian (%)
Ancestries Reported - United States (%)
Ancestries Reported - Welsh (%)
Ancestries Reported - West Indian (%)
Ancestries Reported - Other (%)
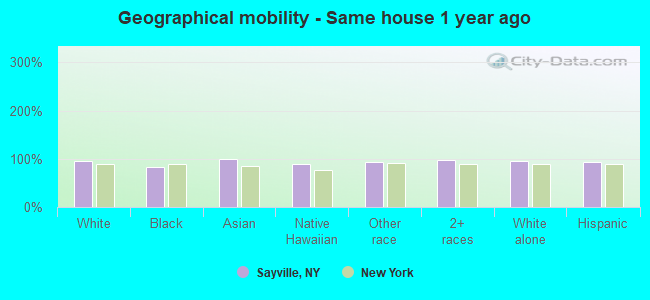
Geographical mobility - Same house 1 year ago (%)
Geographical mobility - Same house 1 year ago (%) - White
Geographical mobility - Same house 1 year ago (%) - Black or African American
Geographical mobility - Same house 1 year ago (%) - Asian
Geographical mobility - Same house 1 year ago (%) - Hispanic or Latino
Geographical mobility - Same house 1 year ago (%) - American Indian and Alaska Native
Geographical mobility - Same house 1 year ago (%) - Multirace
Geographical mobility - Same house 1 year ago (%) - Other Race
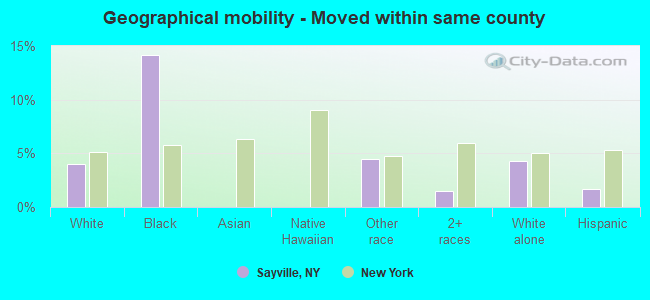
Geographical mobility - Moved within same county (%)
Geographical mobility - Moved within same county (%) - White
Geographical mobility - Moved within same county (%) - Black or African American
Geographical mobility - Moved within same county (%) - Asian
Geographical mobility - Moved within same county (%) - Hispanic or Latino
Geographical mobility - Moved within same county (%) - American Indian and Alaska Native
Geographical mobility - Moved within same county (%) - Multirace
Geographical mobility - Moved within same county (%) - Other Race
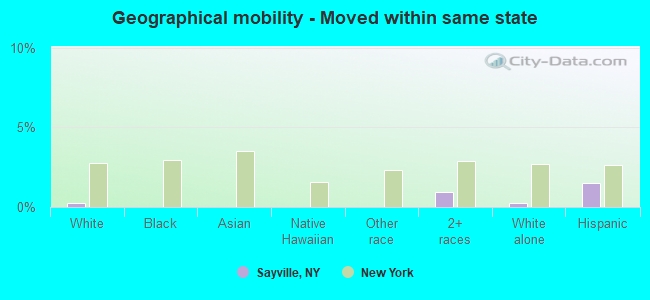
Geographical mobility - Moved from different county within same state (%)
Geographical mobility - Moved from different county within same state (%) - White
Geographical mobility - Moved from different county within same state (%) - Black or African American
Geographical mobility - Moved from different county within same state (%) - Asian
Geographical mobility - Moved from different county within same state (%) - Hispanic or Latino
Geographical mobility - Moved from different county within same state (%) - American Indian and Alaska Native
Geographical mobility - Moved from different county within same state (%) - Multirace
Geographical mobility - Moved from different county within same state (%) - Other Race
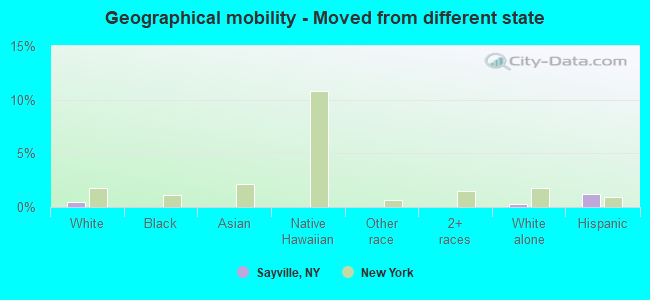
Geographical mobility - Moved from different state (%)
Geographical mobility - Moved from different state (%) - White
Geographical mobility - Moved from different state (%) - Black or African American
Geographical mobility - Moved from different state (%) - Asian
Geographical mobility - Moved from different state (%) - Hispanic or Latino
Geographical mobility - Moved from different state (%) - American Indian and Alaska Native
Geographical mobility - Moved from different state (%) - Multirace
Geographical mobility - Moved from different state (%) - Other Race
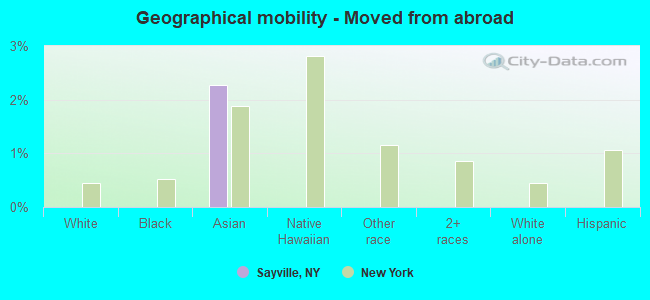
Geographical mobility - Moved from abroad (%)
Geographical mobility - Moved from abroad (%) - White
Geographical mobility - Moved from abroad (%) - Black or African American
Geographical mobility - Moved from abroad (%) - Asian
Geographical mobility - Moved from abroad (%) - Hispanic or Latino
Geographical mobility - Moved from abroad (%) - American Indian and Alaska Native
Geographical mobility - Moved from abroad (%) - Multirace
Geographical mobility - Moved from abroad (%) - Other Race
Place of birth for the foreign-born population - Ireland (%)
Place of birth for the foreign-born population - Denmark (%)
Place of birth for the foreign-born population - Norway (%)
Place of birth for the foreign-born population - Sweden (%)
Place of birth for the foreign-born population - United Kingdom (%)
Place of birth for the foreign-born population - England (%)
Place of birth for the foreign-born population - Scotland (%)
Place of birth for the foreign-born population - Other Northern Europe (%)
Place of birth for the foreign-born population - Austria (%)
Place of birth for the foreign-born population - Belgium (%)
Place of birth for the foreign-born population - France (%)
Place of birth for the foreign-born population - Germany (%)
Place of birth for the foreign-born population - Netherlands (%)
Place of birth for the foreign-born population - Switzerland (%)
Place of birth for the foreign-born population - Other Western Europe (%)
Place of birth for the foreign-born population - Greece (%)
Place of birth for the foreign-born population - Italy (%)
Place of birth for the foreign-born population - Portugal (%)
Place of birth for the foreign-born population - Spain (%)
Place of birth for the foreign-born population - Other Southern Europe (%)
Place of birth for the foreign-born population - Albania (%)
Place of birth for the foreign-born population - Belarus (%)
Place of birth for the foreign-born population - Bosnia and Herzegovina (%)
Place of birth for the foreign-born population - Bulgaria (%)
Place of birth for the foreign-born population - Croatia (%)
Place of birth for the foreign-born population - Czechoslovakia (%)
Place of birth for the foreign-born population - Hungary (%)
Place of birth for the foreign-born population - Latvia (%)
Place of birth for the foreign-born population - Lithuania (%)
Place of birth for the foreign-born population - North Macedonia (Macedonia) (%)
Place of birth for the foreign-born population - Moldova (%)
Place of birth for the foreign-born population - Poland (%)
Place of birth for the foreign-born population - Romania (%)
Place of birth for the foreign-born population - Russia (%)
Place of birth for the foreign-born population - Serbia (%)
Place of birth for the foreign-born population - Ukraine (%)
Place of birth for the foreign-born population - Other Eastern Europe (%)
Place of birth for the foreign-born population - China (%)
Place of birth for the foreign-born population - Hong Kong (%)
Place of birth for the foreign-born population - Taiwan (%)
Place of birth for the foreign-born population - Japan (%)
Place of birth for the foreign-born population - Korea (%)
Place of birth for the foreign-born population - Other Eastern Asia (%)
Place of birth for the foreign-born population - Afghanistan (%)
Place of birth for the foreign-born population - Bangladesh (%)
Place of birth for the foreign-born population - India (%)
Place of birth for the foreign-born population - Iran (%)
Place of birth for the foreign-born population - Kazakhstan (%)
Place of birth for the foreign-born population - Nepal (%)
Place of birth for the foreign-born population - Pakistan (%)
Place of birth for the foreign-born population - Sri Lanka (%)
Place of birth for the foreign-born population - Uzbekistan (%)
Place of birth for the foreign-born population - Other South Central Asia (%)
Place of birth for the foreign-born population - Burma (%)
Place of birth for the foreign-born population - Cambodia (%)
Place of birth for the foreign-born population - Indonesia (%)
Place of birth for the foreign-born population - Laos (%)
Place of birth for the foreign-born population - Malaysia (%)
Place of birth for the foreign-born population - Philippines (%)
Place of birth for the foreign-born population - Singapore (%)
Place of birth for the foreign-born population - Thailand (%)
Place of birth for the foreign-born population - Vietnam (%)
Place of birth for the foreign-born population - Other South Eastern Asia (%)
Place of birth for the foreign-born population - Armenia (%)
Place of birth for the foreign-born population - Iraq (%)
Place of birth for the foreign-born population - Israel (%)
Place of birth for the foreign-born population - Jordan (%)
Place of birth for the foreign-born population - Kuwait (%)
Place of birth for the foreign-born population - Lebanon (%)
Place of birth for the foreign-born population - Saudi Arabia (%)
Place of birth for the foreign-born population - Syria (%)
Place of birth for the foreign-born population - Turkey (%)
Place of birth for the foreign-born population - Yemen (%)
Place of birth for the foreign-born population - Other Western Asia (%)
Place of birth for the foreign-born population - Eritrea (%)
Place of birth for the foreign-born population - Ethiopia (%)
Place of birth for the foreign-born population - Kenya (%)
Place of birth for the foreign-born population - Somalia (%)
Place of birth for the foreign-born population - Uganda (%)
Place of birth for the foreign-born population - Zimbabwe (%)
Place of birth for the foreign-born population - Other Eastern Africa (%)
Place of birth for the foreign-born population - Cameroon (%)
Place of birth for the foreign-born population - Congo (%)
Place of birth for the foreign-born population - Democratic Republic of Congo (Zaire) (%)
Place of birth for the foreign-born population - Other Middle Africa (%)
Place of birth for the foreign-born population - Egypt (%)
Place of birth for the foreign-born population - Morocco (%)
Place of birth for the foreign-born population - Sudan (%)
Place of birth for the foreign-born population - Other Northern Africa (%)
Place of birth for the foreign-born population - South Africa (%)
Place of birth for the foreign-born population - Other Southern Africa (%)
Place of birth for the foreign-born population - Cabo Verde (%)
Place of birth for the foreign-born population - Ghana (%)
Place of birth for the foreign-born population - Liberia (%)
Place of birth for the foreign-born population - Nigeria (%)
Place of birth for the foreign-born population - Senegal (%)
Place of birth for the foreign-born population - Sierra Leone (%)
Place of birth for the foreign-born population - Other Western Africa (%)
Place of birth for the foreign-born population - Australia (%)
Place of birth for the foreign-born population - New Zealand (%)
Place of birth for the foreign-born population - Fiji (%)
Place of birth for the foreign-born population - Micronesia (%)
Place of birth for the foreign-born population - Bahamas (%)
Place of birth for the foreign-born population - Barbados (%)
Place of birth for the foreign-born population - Cuba (%)
Place of birth for the foreign-born population - Dominica (%)
Place of birth for the foreign-born population - Dominican Republic (%)
Place of birth for the foreign-born population - Grenada (%)
Place of birth for the foreign-born population - Haiti (%)
Place of birth for the foreign-born population - Jamaica (%)
Place of birth for the foreign-born population - St. Vincent and the Grenadines (%)
Place of birth for the foreign-born population - Trinidad and Tobago (%)
Place of birth for the foreign-born population - West Indies (%)
Place of birth for the foreign-born population - Other Caribbean (%)
Place of birth for the foreign-born population - Belize (%)
Place of birth for the foreign-born population - Costa Rica (%)
Place of birth for the foreign-born population - El Salvador (%)
Place of birth for the foreign-born population - Guatemala (%)
Place of birth for the foreign-born population - Honduras (%)
Place of birth for the foreign-born population - Mexico (%)
Place of birth for the foreign-born population - Nicaragua (%)
Place of birth for the foreign-born population - Panama (%)
Place of birth for the foreign-born population - Other Central America (%)
Place of birth for the foreign-born population - Argentina (%)
Place of birth for the foreign-born population - Bolivia (%)
Place of birth for the foreign-born population - Brazil (%)
Place of birth for the foreign-born population - Chile (%)
Place of birth for the foreign-born population - Colombia (%)
Place of birth for the foreign-born population - Ecuador (%)
Place of birth for the foreign-born population - Guyana (%)
Place of birth for the foreign-born population - Peru (%)
Place of birth for the foreign-born population - Uruguay (%)
Place of birth for the foreign-born population - Venezuela (%)
Place of birth for the foreign-born population - Other South America (%)
Place of birth for the foreign-born population - Canada (%)
Place of birth for the foreign-born population - Other Northern America (%)
Place of birth for the foreign-born population - Other (%)
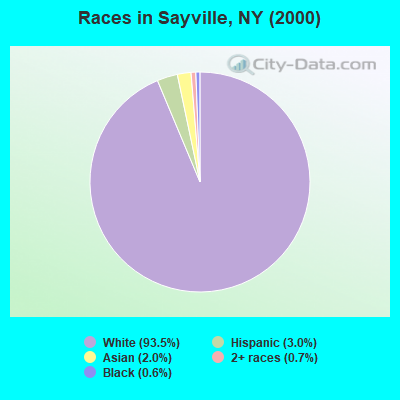
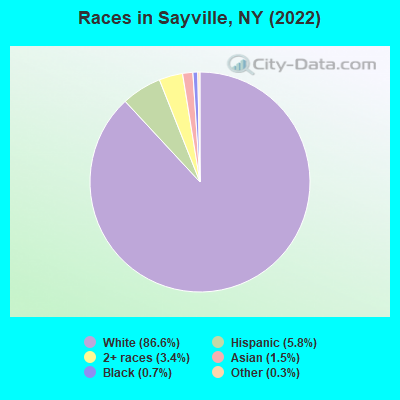
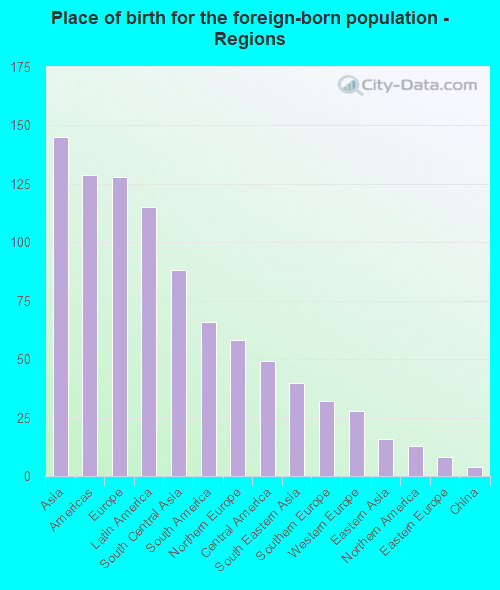
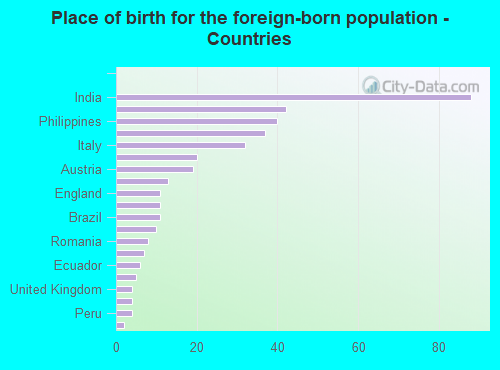
According to 2022 data, the most numerous races in Sayville, NY are White alone (13,984 residents), Hispanic (936 residents), and Black alone (106 residents). 94.3% of Sayville residents speak English at home. 2.5% of Sayville, NY residents are foreign-born (0.9% born in Asia, 0.8% born in Europe, 0.7% born in Latin America), which is 779.7% less than the foreign-born rate of 22.0% across the entire state of New York.
Race distribution in Sayville
2000 2022
11,760,981 62.0% White alone 2,867,583 15.1% Hispanic 2,812,623 14.8% Black alone 1,035,926 5.5% Asian alone 366,116 1.9% Two or more races 75,499 0.4% Other race alone 52,499 0.3% American Indian alone 5,230 0.03% Native Hawaiian and Other
10,408,933 52.9% White alone 3,867,299 19.7% Hispanic 2,633,840 13.4% Black alone 1,776,286 9.0% Asian alone 732,670 3.7% Two or more races 216,110 1.1% Other race alone 35,082 0.2% American Indian alone 6,931 0.04% Native Hawaiian and Other
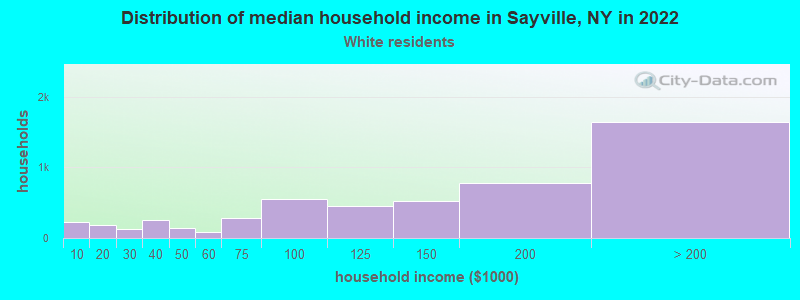
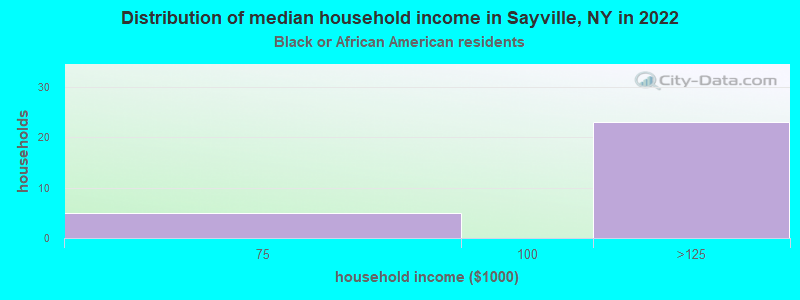
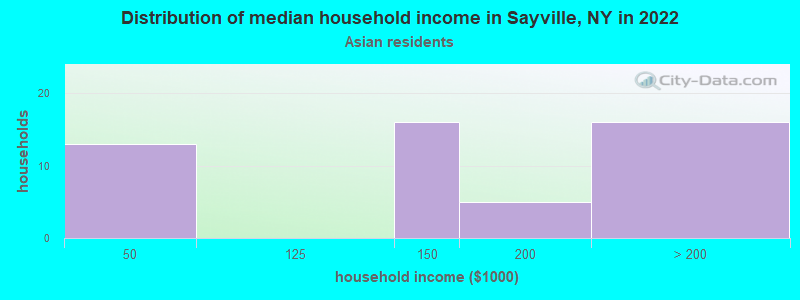
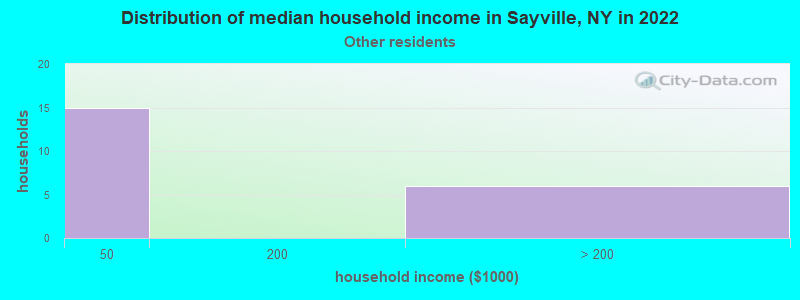
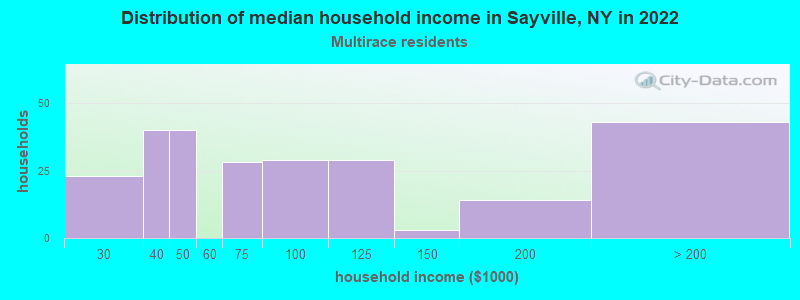
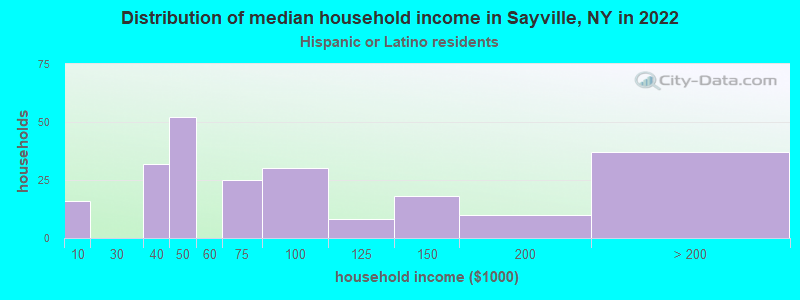
Income and house value in Sayville Median household income in 2022 $141,710 White non-Hispanic householders$134,132 Asian householders$72,213 Two or more races householders$71,534 Hispanic or Latino race householdersMedian 2022 house value $614,584 White Non-Hispanic householders$662,584 Black or African American householders$301,844 American Indian or Alaska Native householders $631,075 Asian householders$458,508 Two or more races householders$512,693 Hispanic or Latino householders
Median age by race in Sayville
47.4 Median age for White residents44.3 49.8 57.8 Median age for Black or African American residents65.0 27.6 -748,832,865.7 Median age for American Indian / Alaska Native residents-807,017,543.1 -513,692,161.9 34.2 Median age for Asian residents29.1 54.5 21.6 Median age for Native Hawaiian / Pacific Islander residents-831,187,409.8 20.1 59.6 Median age for Other race residents17.1 65.5 40.4 Median age for Two or more races residents29.9 49.0 46.4 Median age for White alone residents44.9 48.8 38.0 Median age for Hispanic or Latino residents31.7 43.5
Owner/renter occupied households by race in Sayville
House owners and renters - White residents 4,034 77.4% Owner occupied1,178 22.6% Renter occupiedHouse owners and renters - Black or African American residents 27 100.0% Renter occupiedHouse owners and renters - Asian residents 32 73.9% Owner occupied11 26.1% Renter occupiedHouse owners and renters - Native Hawaiian / Pacific Islander residents 11 100.0% Owner occupiedHouse owners and renters - Other race residents 6 24.2% Owner occupied20 75.8% Renter occupiedHouse owners and renters - Two or more races residents 132 48.4% Owner occupied141 51.6% Renter occupiedHouse owners and renters - White alone residents 4,128 76.8% Owner occupied1,247 23.2% Renter occupiedHouse owners and renters - Hispanic or Latino residents 105 43.0% Owner occupied139 57.0% Renter occupied
Language usage in Sayville
English speakers - Total 94.3% of residents of Sayville speak English at home.
1.5% of residents speak Spanish at home 181 78.4% Speak English very well50 21.6% Speak English less than very well2.6% of residents speak other language at home 350 88.8% Speak English very well44 11.2% Speak English less than very well
English speakers - Born in the United States 97.2% of residents of Sayville speak English at home.
3.7% of residents speak other language at home 33 100.0% Speak English very well
English speakers - Native, born elsewhere 54.2% of residents of Sayville speak English at home.
43.0% of residents speak Spanish at home 35 76.1% Speak English very well11 23.9% Speak English less than very well
English speakers - Foreign-born 41.7% of residents of Sayville speak English at home.
12.5% of residents speak Spanish at home 24 43.6% Speak English very well31 56.4% Speak English less than very well42.4% of residents speak other language at home 158 84.9% Speak English very well28 15.1% Speak English less than very well
White (Caucasian) - Speak only English Native:
100.0% (12,949)Foreign-born:
75.7% (75)
White (Caucasian) - Speak another language Native:
1.4% (176)Foreign-born:
38.3% (38)
Black or African American - Speak another language Native:
14.8% (15)Foreign-born:
89.3% (1)
Asian - Speak only English Native:
91.6% (117)Foreign-born:
22.6% (27)
Other race - Speak another language Native:
9.3% (5)Foreign-born:
100.0% (62)
Two or more races - Speak only English Native:
89.5% (898)Foreign-born:
48.9% (71)
Two or more races - Speak another language Native:
11.4% (114)Foreign-born:
46.2% (67)
White alone - Speak only English Native:
98.0% (12,918)Foreign-born:
61.9% (82)
White alone - Speak another language Native:
1.8% (242)Foreign-born:
38.2% (51)
Hispanic or Latino - Speak only English Native:
90.1% (702)Foreign-born:
47.1% (55)
Hispanic or Latino - Speak another language Native:
12.6% (98)Foreign-born:
48.9% (57)
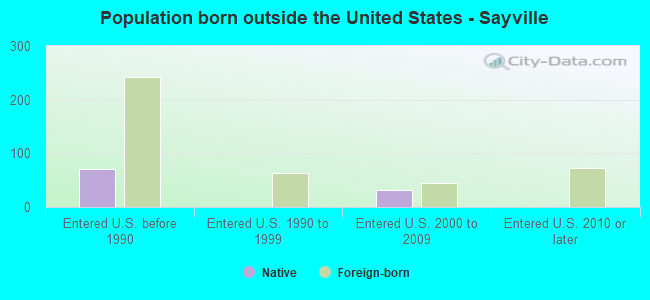
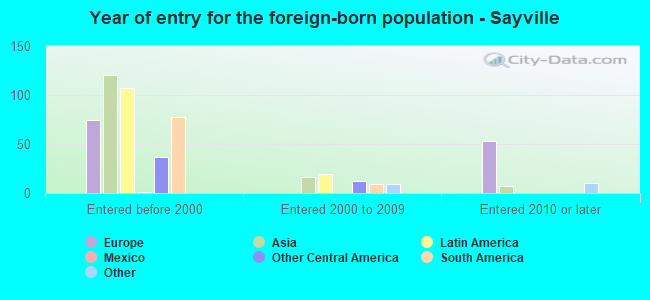
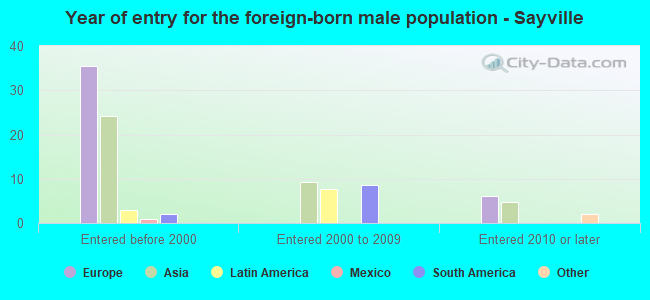
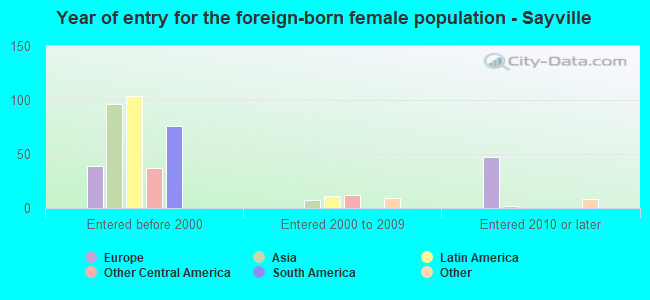
Foreign-born residents in Sayville 404 residents are foreign born (0.9% Asia , 0.8% Europe , 0.7% Latin America ).
This city:
2.5%New York:
22.6%
Marital status for residents in Sayville Marital status - White (Caucasian) population 15 years and over
Males 28.6% Never married60.4% Now married1.1% Separated3.3% Widowed6.6% DivorcedFemales 23.6% Never married53.7% Now married2.8% Separated10.5% Widowed9.4% DivorcedWomen who gave birth in the past 12 months Now married:
100.0% (188)Unmarried:
0.0% (0)
Women who did not give birth in the past 12 months Now married:
47.8% (1,106)Unmarried:
52.2% (1,210)
Marital status - Black or African American population 15 years and over
Males 14.6% Never married75.0% Now married0.0% Separated0.0% Widowed10.4% DivorcedFemales 74.5% Never married0.0% Now married0.0% Separated25.5% Widowed0.0% DivorcedWomen who did not give birth in the past 12 months Now married:
0.0% (0)Unmarried:
100.0% (27)
Marital status - Asian population 15 years and over
Males 73.0% Never married27.0% Now married0.0% Separated0.0% Widowed0.0% DivorcedFemales 27.5% Never married62.5% Now married0.0% Separated10.0% Widowed0.0% DivorcedWomen who gave birth in the past 12 months Now married:
100.0% (8)Unmarried:
0.0% (0)
Women who did not give birth in the past 12 months Now married:
29.8% (15)Unmarried:
70.2% (34)
Marital status - Native Hawaiian / Pacific Islander population 15 years and over
Males 47.8% Never married52.2% Now married0.0% Separated0.0% Widowed0.0% DivorcedFemales 70.6% Never married29.4% Now married0.0% Separated0.0% Widowed0.0% DivorcedWomen who did not give birth in the past 12 months Now married:
0.0% (0)Unmarried:
100.0% (25)
Marital status - Other race population 15 years and over
Males 59.1% Never married27.3% Now married0.0% Separated13.6% Widowed0.0% DivorcedFemales 31.5% Never married14.8% Now married0.0% Separated53.7% Widowed0.0% DivorcedWomen who did not give birth in the past 12 months Now married:
0.0% (0)Unmarried:
100.0% (6)
Marital status - Two or more races population 15 years and over
Males 54.4% Never married38.7% Now married0.0% Separated0.0% Widowed6.9% DivorcedFemales 34.6% Never married41.6% Now married0.0% Separated19.5% Widowed4.4% DivorcedWomen who did not give birth in the past 12 months Now married:
42.0% (157)Unmarried:
58.0% (217)
Marital status - White alone, not Hispanic / Latino population 15 years and over
Males 28.4% Never married60.7% Now married1.1% Separated3.3% Widowed6.5% DivorcedFemales 23.3% Never married53.5% Now married2.9% Separated10.7% Widowed9.6% DivorcedWomen who gave birth in the past 12 months Now married:
100.0% (204)Unmarried:
0.0% (0)
Women who did not give birth in the past 12 months Now married:
47.9% (1,162)Unmarried:
52.1% (1,263)
Marital status - Hispanic or Latino population 15 years and over
Males 45.6% Never married43.6% Now married0.0% Separated1.0% Widowed9.8% DivorcedFemales 47.6% Never married33.5% Now married0.0% Separated14.7% Widowed4.1% DivorcedWomen who did not give birth in the past 12 months Now married:
21.5% (60)Unmarried:
78.5% (219)
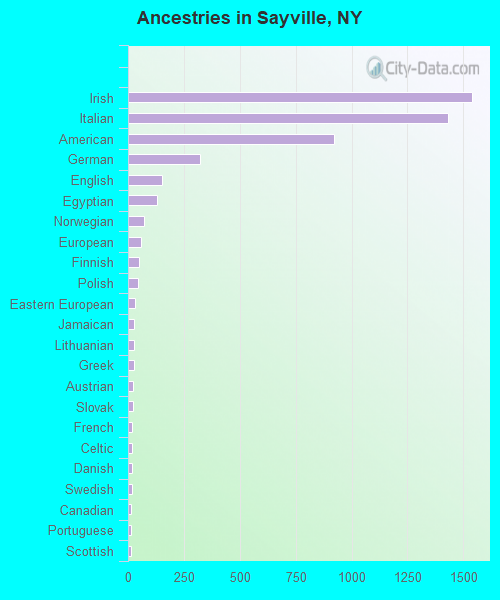
Ancestries in Sayville
1,538 25.1% Irish1,430 23.4% Italian923 15.1% American321 5.2% German154 2.5% English129 2.1% Egyptian73 1.2% Norwegian60 1.0% European48 0.8% Finnish46 0.8% Polish30 0.5% Eastern European29 0.5% Jamaican26 0.4% Lithuanian25 0.4% Greek24 0.4% Austrian22 0.4% Slovak18 0.3% French17 0.3% Celtic16 0.3% Danish16 0.3% Swedish15 0.2% Canadian15 0.2% Portuguese14 0.2% Scottish13 0.2% British13 0.2% Russian12 0.2% French Canadian11 0.2% Lebanese10 0.2% Dutch10 0.2% Scotch-Irish9 0.1% Syrian7 0.1% Pennsylvania German4 0.07% Armenian4 0.07% Romanian2 0.03% Czech2 0.03% Ghanaian
Children Nativity (place of birth) in Sayville
Children under 6 years - Living with two parents Both parents native 765 100.0% NativeOne native, one foreign-born parent 36 100.0% NativeChildren under 6 years - Living with one parent Native parent 47 100.0% NativeChildren 6 to 17 years - Living with two parents Both parents native 1,794 100.0% NativeOne native, one foreign-born parent 61 100.0% NativeChildren 6 to 17 years - Living with one parent Native parent 510 100.0% NativeForeign-born parent 12 51.5% Native12 48.5% Foreign-born