Races in South Shore, Washington (WA) Detailed Stats
Ancestries, Foreign-born residents, place of birth
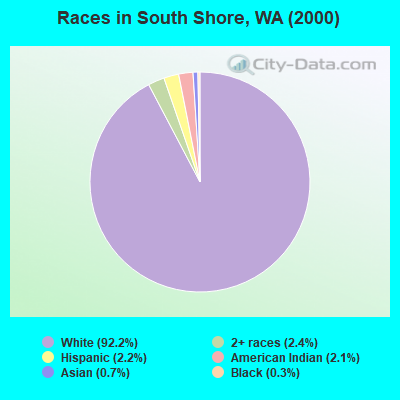
Race distribution in South Shore

- 4,22192.2%White alone
- 1092.4%Two or more races
- 1012.2%Hispanic
- 952.1%American Indian alone
- 300.7%Asian alone
- 160.3%Black alone
- 30.07%Other race alone
- 20.04%Native Hawaiian and Other
Pacific Islander alone
2000
2022
-
- 4,652,49078.9%White alone
- 441,5097.5%Hispanic
- 319,4015.4%Asian alone
- 184,6313.1%Black alone
- 175,9263.0%Two or more races
- 85,3961.4%American Indian alone
- 22,7790.4%Native Hawaiian and Other
Pacific Islander alone - 11,9890.2%Other race alone

-
- 4,941,45663.5%White alone
- 1,093,31314.0%Hispanic
- 755,8329.7%Asian alone
- 523,4486.7%Two or more races
- 299,5373.8%Black alone
- 69,0240.9%American Indian alone
- 52,2310.7%Native Hawaiian and Other
Pacific Islander alone - 50,9450.7%Other race alone

Income and house value in South Shore
- Median household income in 2022
- $57,721White non-Hispanic householders
- $92,642American Indian and Alaska Native householders
- $28,495Some other race householders
- $38,261Two or more races householders
- $33,319Hispanic or Latino race householders
- Median 2022 house value
- $354,290White Non-Hispanic householders
- $305,422Black or African American householders
- $435,307American Indian or Alaska Native householders
- $241,122Some other race householders
- $398,335Two or more races householders
- $241,122Hispanic or Latino householders
Household income for White non-Hispanic householders

Household income for Black householders

Household income for American Indian and Alaska Native householders

Household income for Native Hawaiian and other Pacific Islander householders

Household income for Two or more races householders

Household income for Hispanic or Latino race householders
