Races in Southeast, New York (NY) Detailed Stats
Ancestries, Foreign-born residents, place of birth
10.4% of Southeast, NY residents are foreign-born (5.5% born in Latin America, 3.4% born in Europe), which is 112.1% less than the foreign-born rate of 22.0% across the entire state of New York.
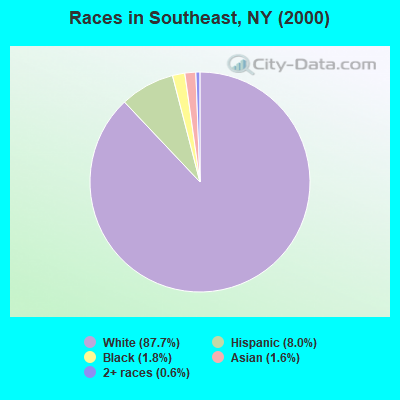
Race distribution in Southeast

- 15,19487.7%White alone
- 1,3938.0%Hispanic
- 3041.8%Black alone
- 2831.6%Asian alone
- 1110.6%Two or more races
- 140.08%American Indian alone
- 120.07%Other race alone
- 50.03%Native Hawaiian and Other
Pacific Islander alone
2000
2022
-
- 11,760,98162.0%White alone
- 2,867,58315.1%Hispanic
- 2,812,62314.8%Black alone
- 1,035,9265.5%Asian alone
- 366,1161.9%Two or more races
- 75,4990.4%Other race alone
- 52,4990.3%American Indian alone
- 5,2300.03%Native Hawaiian and Other
Pacific Islander alone

-
- 10,408,93352.9%White alone
- 3,867,29919.7%Hispanic
- 2,633,84013.4%Black alone
- 1,776,2869.0%Asian alone
- 732,6703.7%Two or more races
- 216,1101.1%Other race alone
- 35,0820.2%American Indian alone
- 6,9310.04%Native Hawaiian and Other
Pacific Islander alone

Income and house value in Southeast
- Median household income in 2022
- $107,647White non-Hispanic householders
- $69,511Black householders
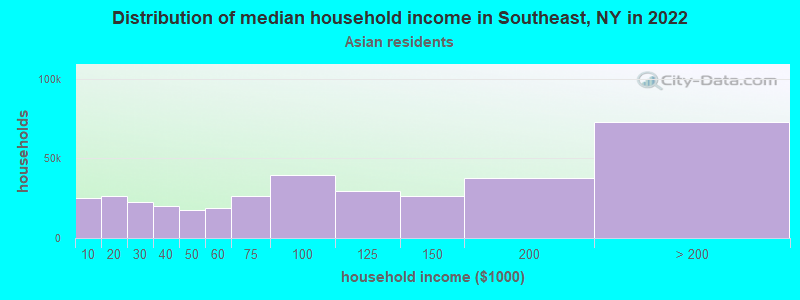
- $68,903Asian householders
- $71,499Some other race householders
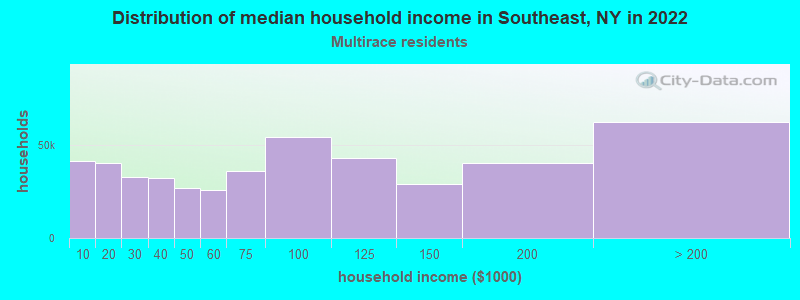
- $84,452Two or more races householders
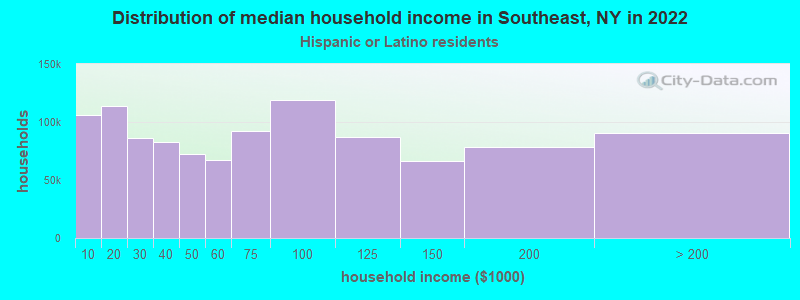
- $104,351Hispanic or Latino race householders
- Median 2022 house value
- $461,776White Non-Hispanic householders
- $353,235Black or African American householders
- $407,824Asian householders
- $411,648Some other race householders
- $497,886Two or more races householders
- $469,423Hispanic or Latino householders
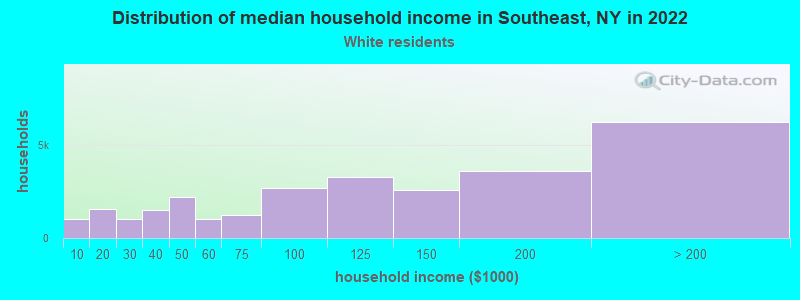
Household income for White non-Hispanic householders
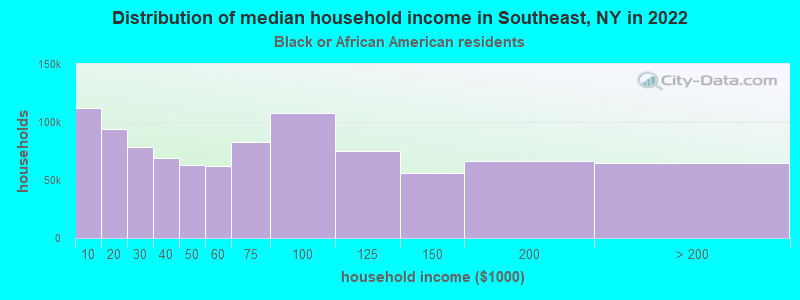
Household income for Black householders
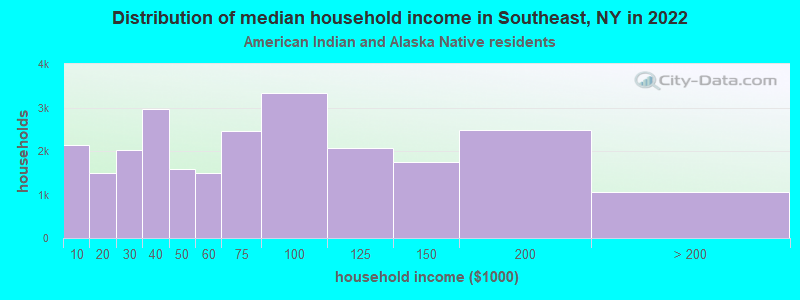
Household income for American Indian and Alaska Native householders
Household income for Asian householders
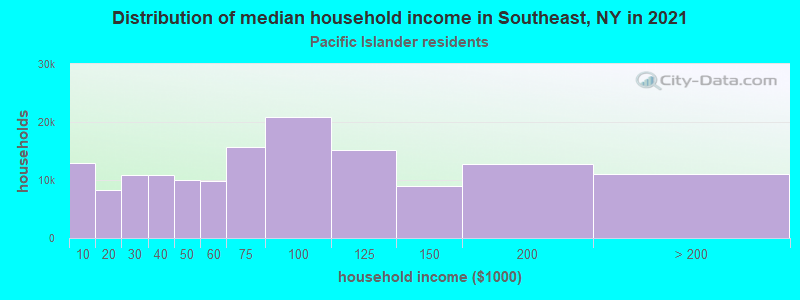
Household income for Native Hawaiian and other Pacific Islander householders
Household income for Two or more races householders
Household income for Hispanic or Latino race householders
Foreign-born residents in Southeast
1,796 residents are foreign born (5.5% Latin America, 3.4% Europe).
| This city: | 10.4% |
| New York: | 20.4% |
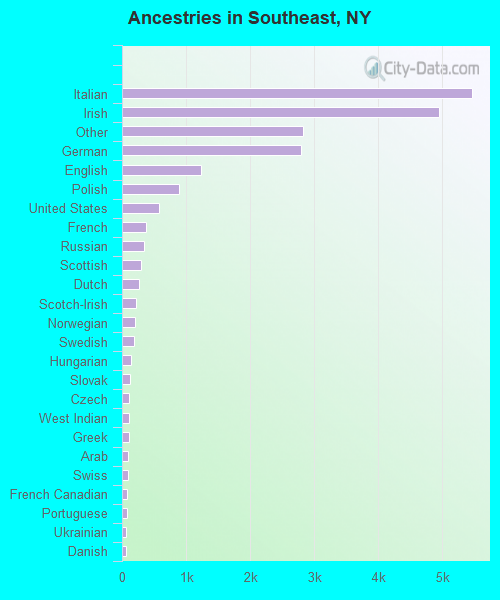
Ancestries in Southeast

- 5,45725.0%Italian
- 4,95522.7%Irish
- 2,83213.0%Other
- 2,78912.8%German
- 1,2395.7%English
- 8944.1%Polish
- 5772.6%United States
- 3681.7%French
- 3491.6%Russian
- 2941.3%Scottish
- 2711.2%Dutch
- 2211.0%Scotch-Irish
- 2060.9%Norwegian
- 1910.9%Swedish
- 1450.7%Hungarian
- 1220.6%Slovak
- 1160.5%Czech
- 1150.5%West Indian
- 1130.5%Greek
- 980.4%Arab
- 930.4%Swiss
- 830.4%French Canadian
- 770.4%Portuguese
- 600.3%Ukrainian
- 580.3%Danish
- 510.2%Lithuanian
- 250.1%Subsaharan African
- 150.07%Welsh
Zip codes: 10509.