Races in Springfield, Missouri (MO) Detailed Stats
Data:
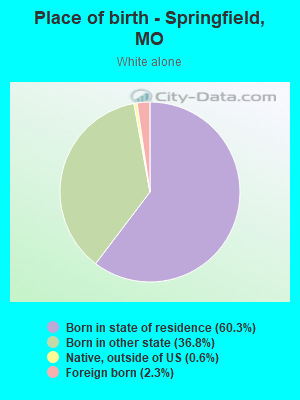
Races - White alone (%)
Races - White alone (% change since 2000)
Races - Black alone (%)
Races - Black alone (% change since 2000)
Races - American Indian alone (%)
Races - American Indian alone (% change since 2000)
Races - Asian alone (%)
Races - Asian alone (% change since 2000)
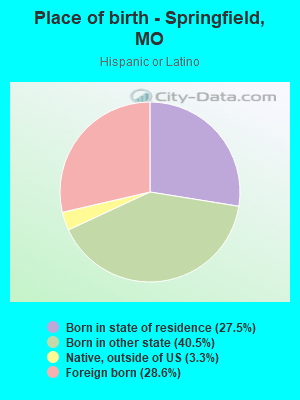
Races - Hispanic (%)
Races - Hispanic (% change since 2000)
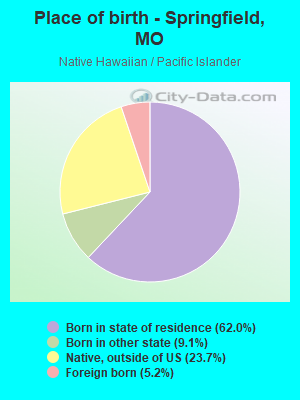
Races - Native Hawaiian and Other Pacific Islander alone (%)
Races - Native Hawaiian and Other Pacific Islander alone (% change since 2000)
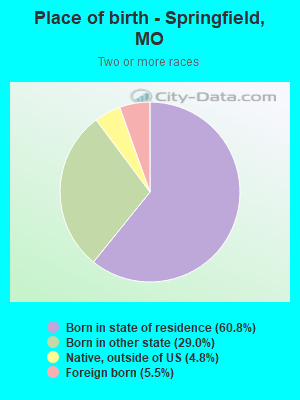
Races - Two or more races(%)
Races - Two or more races(% change since 2000)
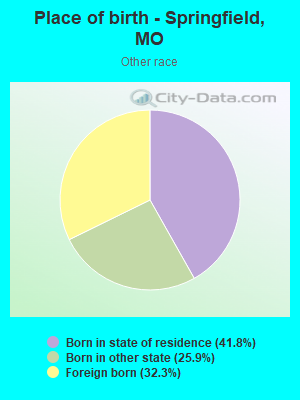
Races - Other race alone (%)
Races - Other race alone (% change since 2000)
Racial diversity
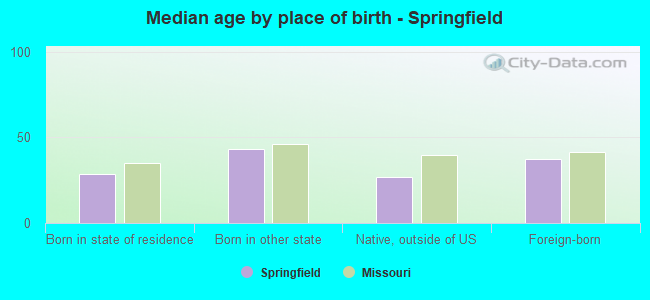
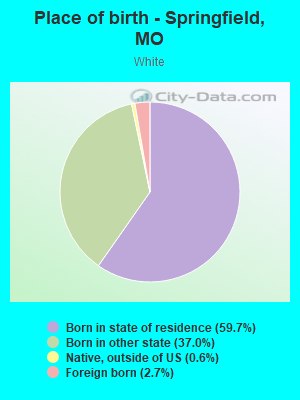
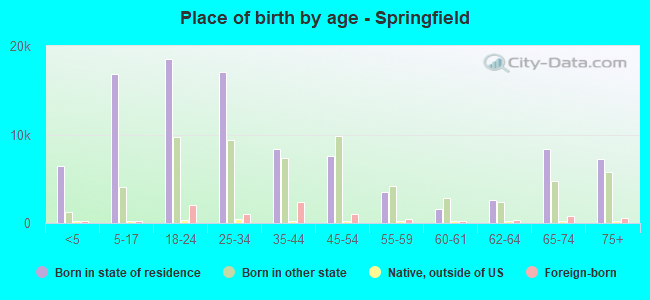
Place of birth - Born in state of residence (%)
Place of birth - Born in state of residence (%) - White
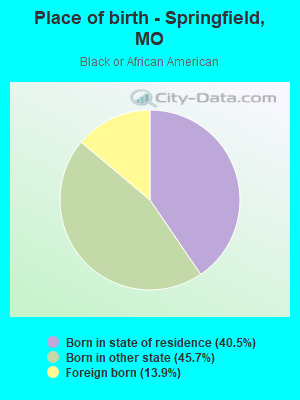
Place of birth - Born in state of residence (%) - Black or African American
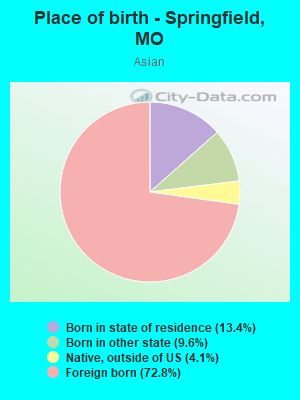
Place of birth - Born in state of residence (%) - Asian
Place of birth - Born in state of residence (%) - Hispanic or Latino
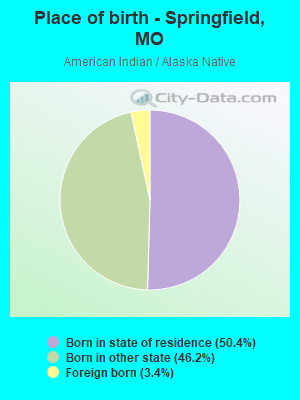
Place of birth - Born in state of residence (%) - American Indian and Alaska Native
Place of birth - Born in state of residence (%) - Multirace
Place of birth - Born in state of residence (%) - Other Race
Place of birth - Born in other state (%)
Place of birth - Born in other state (%) - White
Place of birth - Born in other state (%) - Black or African American
Place of birth - Born in other state (%) - Asian
Place of birth - Born in other state (%) - Hispanic or Latino
Place of birth - Born in other state (%) - American Indian and Alaska Native
Place of birth - Born in other state (%) - Multirace
Place of birth - Born in other state (%) - Other Race
Place of birth - Native, outside of US (%)
Place of birth - Native, outside of US (%) - White
Place of birth - Native, outside of US (%) - Black or African American
Place of birth - Native, outside of US (%) - Asian
Place of birth - Native, outside of US (%) - Hispanic or Latino
Place of birth - Native, outside of US (%) - American Indian and Alaska Native
Place of birth - Native, outside of US (%) - Multirace
Place of birth - Native, outside of US (%) - Other Race
Place of birth - Foreign born (%)
Place of birth - Foreign born (%) - White
Place of birth - Foreign born (%) - Black or African American
Place of birth - Foreign born (%) - Asian
Place of birth - Foreign born (%) - Hispanic or Latino
Place of birth - Foreign born (%) - American Indian and Alaska Native
Place of birth - Foreign born (%) - Multirace
Place of birth - Foreign born (%) - Other Race
Residents speaking English at home (%)
Residents speaking English at home - Born in the United States (%)
Residents speaking English at home - Native, born elsewhere (%)
Residents speaking English at home - Foreign born (%)
Residents speaking Spanish at home (%)
Residents speaking Spanish at home - Born in the United States (%)
Residents speaking Spanish at home - Native, born elsewhere (%)
Residents speaking Spanish at home - Foreign born (%)
Residents speaking other language at home (%)
Residents speaking other language at home - Born in the United States (%)
Residents speaking other language at home - Native, born elsewhere (%)
Residents speaking other language at home - Foreign born (%)
Marital status - Never married (%)
Marital status - Now married (%)
Marital status - Separated (%)
Marital status - Widowed (%)
Marital status - Divorced (%)
Ancestries Reported - Arab (%)
Ancestries Reported - Czech (%)
Ancestries Reported - Danish (%)
Ancestries Reported - Dutch (%)
Ancestries Reported - English (%)
Ancestries Reported - French (%)
Ancestries Reported - French Canadian (%)
Ancestries Reported - German (%)
Ancestries Reported - Greek (%)
Ancestries Reported - Hungarian (%)
Ancestries Reported - Irish (%)
Ancestries Reported - Italian (%)
Ancestries Reported - Lithuanian (%)
Ancestries Reported - Norwegian (%)
Ancestries Reported - Polish (%)
Ancestries Reported - Portuguese (%)
Ancestries Reported - Russian (%)
Ancestries Reported - Scotch-Irish (%)
Ancestries Reported - Scottish (%)
Ancestries Reported - Slovak (%)
Ancestries Reported - Subsaharan African (%)
Ancestries Reported - Swedish (%)
Ancestries Reported - Swiss (%)
Ancestries Reported - Ukrainian (%)
Ancestries Reported - United States (%)
Ancestries Reported - Welsh (%)
Ancestries Reported - West Indian (%)
Ancestries Reported - Other (%)
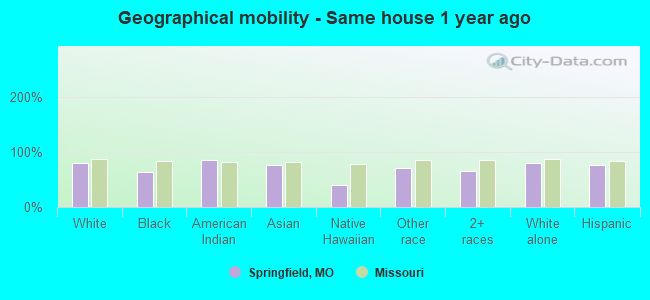
Geographical mobility - Same house 1 year ago (%)
Geographical mobility - Same house 1 year ago (%) - White
Geographical mobility - Same house 1 year ago (%) - Black or African American
Geographical mobility - Same house 1 year ago (%) - Asian
Geographical mobility - Same house 1 year ago (%) - Hispanic or Latino
Geographical mobility - Same house 1 year ago (%) - American Indian and Alaska Native
Geographical mobility - Same house 1 year ago (%) - Multirace
Geographical mobility - Same house 1 year ago (%) - Other Race
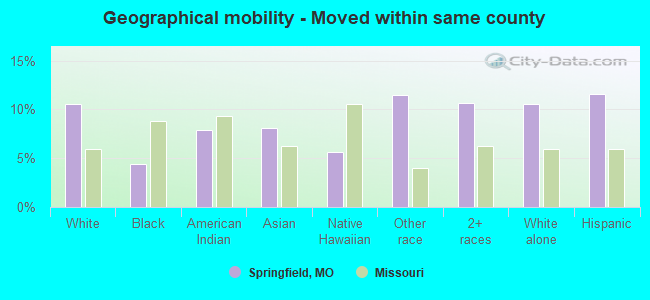
Geographical mobility - Moved within same county (%)
Geographical mobility - Moved within same county (%) - White
Geographical mobility - Moved within same county (%) - Black or African American
Geographical mobility - Moved within same county (%) - Asian
Geographical mobility - Moved within same county (%) - Hispanic or Latino
Geographical mobility - Moved within same county (%) - American Indian and Alaska Native
Geographical mobility - Moved within same county (%) - Multirace
Geographical mobility - Moved within same county (%) - Other Race
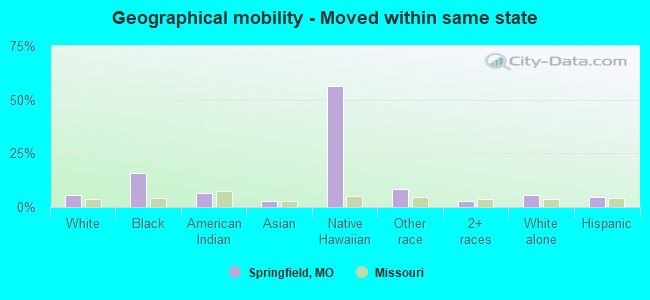
Geographical mobility - Moved from different county within same state (%)
Geographical mobility - Moved from different county within same state (%) - White
Geographical mobility - Moved from different county within same state (%) - Black or African American
Geographical mobility - Moved from different county within same state (%) - Asian
Geographical mobility - Moved from different county within same state (%) - Hispanic or Latino
Geographical mobility - Moved from different county within same state (%) - American Indian and Alaska Native
Geographical mobility - Moved from different county within same state (%) - Multirace
Geographical mobility - Moved from different county within same state (%) - Other Race
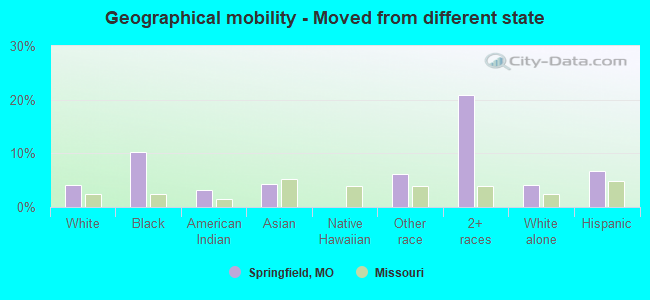
Geographical mobility - Moved from different state (%)
Geographical mobility - Moved from different state (%) - White
Geographical mobility - Moved from different state (%) - Black or African American
Geographical mobility - Moved from different state (%) - Asian
Geographical mobility - Moved from different state (%) - Hispanic or Latino
Geographical mobility - Moved from different state (%) - American Indian and Alaska Native
Geographical mobility - Moved from different state (%) - Multirace
Geographical mobility - Moved from different state (%) - Other Race
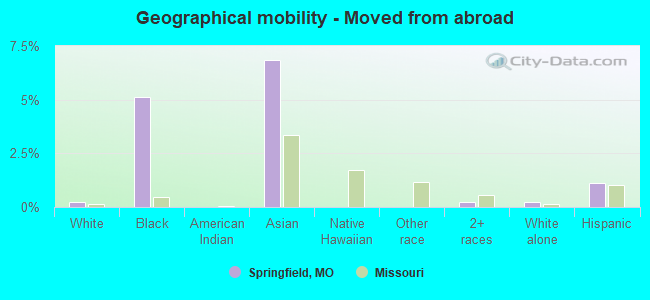
Geographical mobility - Moved from abroad (%)
Geographical mobility - Moved from abroad (%) - White
Geographical mobility - Moved from abroad (%) - Black or African American
Geographical mobility - Moved from abroad (%) - Asian
Geographical mobility - Moved from abroad (%) - Hispanic or Latino
Geographical mobility - Moved from abroad (%) - American Indian and Alaska Native
Geographical mobility - Moved from abroad (%) - Multirace
Geographical mobility - Moved from abroad (%) - Other Race
Place of birth for the foreign-born population - Ireland (%)
Place of birth for the foreign-born population - Denmark (%)
Place of birth for the foreign-born population - Norway (%)
Place of birth for the foreign-born population - Sweden (%)
Place of birth for the foreign-born population - United Kingdom (%)
Place of birth for the foreign-born population - England (%)
Place of birth for the foreign-born population - Scotland (%)
Place of birth for the foreign-born population - Other Northern Europe (%)
Place of birth for the foreign-born population - Austria (%)
Place of birth for the foreign-born population - Belgium (%)
Place of birth for the foreign-born population - France (%)
Place of birth for the foreign-born population - Germany (%)
Place of birth for the foreign-born population - Netherlands (%)
Place of birth for the foreign-born population - Switzerland (%)
Place of birth for the foreign-born population - Other Western Europe (%)
Place of birth for the foreign-born population - Greece (%)
Place of birth for the foreign-born population - Italy (%)
Place of birth for the foreign-born population - Portugal (%)
Place of birth for the foreign-born population - Spain (%)
Place of birth for the foreign-born population - Other Southern Europe (%)
Place of birth for the foreign-born population - Albania (%)
Place of birth for the foreign-born population - Belarus (%)
Place of birth for the foreign-born population - Bosnia and Herzegovina (%)
Place of birth for the foreign-born population - Bulgaria (%)
Place of birth for the foreign-born population - Croatia (%)
Place of birth for the foreign-born population - Czechoslovakia (%)
Place of birth for the foreign-born population - Hungary (%)
Place of birth for the foreign-born population - Latvia (%)
Place of birth for the foreign-born population - Lithuania (%)
Place of birth for the foreign-born population - North Macedonia (Macedonia) (%)
Place of birth for the foreign-born population - Moldova (%)
Place of birth for the foreign-born population - Poland (%)
Place of birth for the foreign-born population - Romania (%)
Place of birth for the foreign-born population - Russia (%)
Place of birth for the foreign-born population - Serbia (%)
Place of birth for the foreign-born population - Ukraine (%)
Place of birth for the foreign-born population - Other Eastern Europe (%)
Place of birth for the foreign-born population - China (%)
Place of birth for the foreign-born population - Hong Kong (%)
Place of birth for the foreign-born population - Taiwan (%)
Place of birth for the foreign-born population - Japan (%)
Place of birth for the foreign-born population - Korea (%)
Place of birth for the foreign-born population - Other Eastern Asia (%)
Place of birth for the foreign-born population - Afghanistan (%)
Place of birth for the foreign-born population - Bangladesh (%)
Place of birth for the foreign-born population - India (%)
Place of birth for the foreign-born population - Iran (%)
Place of birth for the foreign-born population - Kazakhstan (%)
Place of birth for the foreign-born population - Nepal (%)
Place of birth for the foreign-born population - Pakistan (%)
Place of birth for the foreign-born population - Sri Lanka (%)
Place of birth for the foreign-born population - Uzbekistan (%)
Place of birth for the foreign-born population - Other South Central Asia (%)
Place of birth for the foreign-born population - Burma (%)
Place of birth for the foreign-born population - Cambodia (%)
Place of birth for the foreign-born population - Indonesia (%)
Place of birth for the foreign-born population - Laos (%)
Place of birth for the foreign-born population - Malaysia (%)
Place of birth for the foreign-born population - Philippines (%)
Place of birth for the foreign-born population - Singapore (%)
Place of birth for the foreign-born population - Thailand (%)
Place of birth for the foreign-born population - Vietnam (%)
Place of birth for the foreign-born population - Other South Eastern Asia (%)
Place of birth for the foreign-born population - Armenia (%)
Place of birth for the foreign-born population - Iraq (%)
Place of birth for the foreign-born population - Israel (%)
Place of birth for the foreign-born population - Jordan (%)
Place of birth for the foreign-born population - Kuwait (%)
Place of birth for the foreign-born population - Lebanon (%)
Place of birth for the foreign-born population - Saudi Arabia (%)
Place of birth for the foreign-born population - Syria (%)
Place of birth for the foreign-born population - Turkey (%)
Place of birth for the foreign-born population - Yemen (%)
Place of birth for the foreign-born population - Other Western Asia (%)
Place of birth for the foreign-born population - Eritrea (%)
Place of birth for the foreign-born population - Ethiopia (%)
Place of birth for the foreign-born population - Kenya (%)
Place of birth for the foreign-born population - Somalia (%)
Place of birth for the foreign-born population - Uganda (%)
Place of birth for the foreign-born population - Zimbabwe (%)
Place of birth for the foreign-born population - Other Eastern Africa (%)
Place of birth for the foreign-born population - Cameroon (%)
Place of birth for the foreign-born population - Congo (%)
Place of birth for the foreign-born population - Democratic Republic of Congo (Zaire) (%)
Place of birth for the foreign-born population - Other Middle Africa (%)
Place of birth for the foreign-born population - Egypt (%)
Place of birth for the foreign-born population - Morocco (%)
Place of birth for the foreign-born population - Sudan (%)
Place of birth for the foreign-born population - Other Northern Africa (%)
Place of birth for the foreign-born population - South Africa (%)
Place of birth for the foreign-born population - Other Southern Africa (%)
Place of birth for the foreign-born population - Cabo Verde (%)
Place of birth for the foreign-born population - Ghana (%)
Place of birth for the foreign-born population - Liberia (%)
Place of birth for the foreign-born population - Nigeria (%)
Place of birth for the foreign-born population - Senegal (%)
Place of birth for the foreign-born population - Sierra Leone (%)
Place of birth for the foreign-born population - Other Western Africa (%)
Place of birth for the foreign-born population - Australia (%)
Place of birth for the foreign-born population - New Zealand (%)
Place of birth for the foreign-born population - Fiji (%)
Place of birth for the foreign-born population - Micronesia (%)
Place of birth for the foreign-born population - Bahamas (%)
Place of birth for the foreign-born population - Barbados (%)
Place of birth for the foreign-born population - Cuba (%)
Place of birth for the foreign-born population - Dominica (%)
Place of birth for the foreign-born population - Dominican Republic (%)
Place of birth for the foreign-born population - Grenada (%)
Place of birth for the foreign-born population - Haiti (%)
Place of birth for the foreign-born population - Jamaica (%)
Place of birth for the foreign-born population - St. Vincent and the Grenadines (%)
Place of birth for the foreign-born population - Trinidad and Tobago (%)
Place of birth for the foreign-born population - West Indies (%)
Place of birth for the foreign-born population - Other Caribbean (%)
Place of birth for the foreign-born population - Belize (%)
Place of birth for the foreign-born population - Costa Rica (%)
Place of birth for the foreign-born population - El Salvador (%)
Place of birth for the foreign-born population - Guatemala (%)
Place of birth for the foreign-born population - Honduras (%)
Place of birth for the foreign-born population - Mexico (%)
Place of birth for the foreign-born population - Nicaragua (%)
Place of birth for the foreign-born population - Panama (%)
Place of birth for the foreign-born population - Other Central America (%)
Place of birth for the foreign-born population - Argentina (%)
Place of birth for the foreign-born population - Bolivia (%)
Place of birth for the foreign-born population - Brazil (%)
Place of birth for the foreign-born population - Chile (%)
Place of birth for the foreign-born population - Colombia (%)
Place of birth for the foreign-born population - Ecuador (%)
Place of birth for the foreign-born population - Guyana (%)
Place of birth for the foreign-born population - Peru (%)
Place of birth for the foreign-born population - Uruguay (%)
Place of birth for the foreign-born population - Venezuela (%)
Place of birth for the foreign-born population - Other South America (%)
Place of birth for the foreign-born population - Canada (%)
Place of birth for the foreign-born population - Other Northern America (%)
Place of birth for the foreign-born population - Other (%)
Latest news about races in Springfield, MO collected exclusively by city-data.com from local newspapers, TV, and radio stations
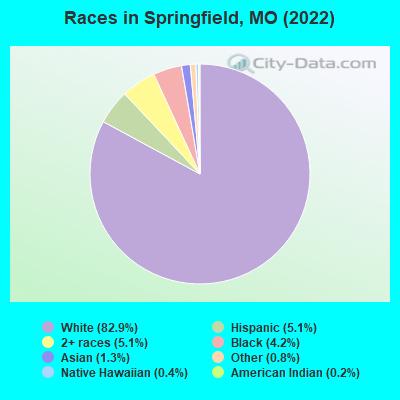
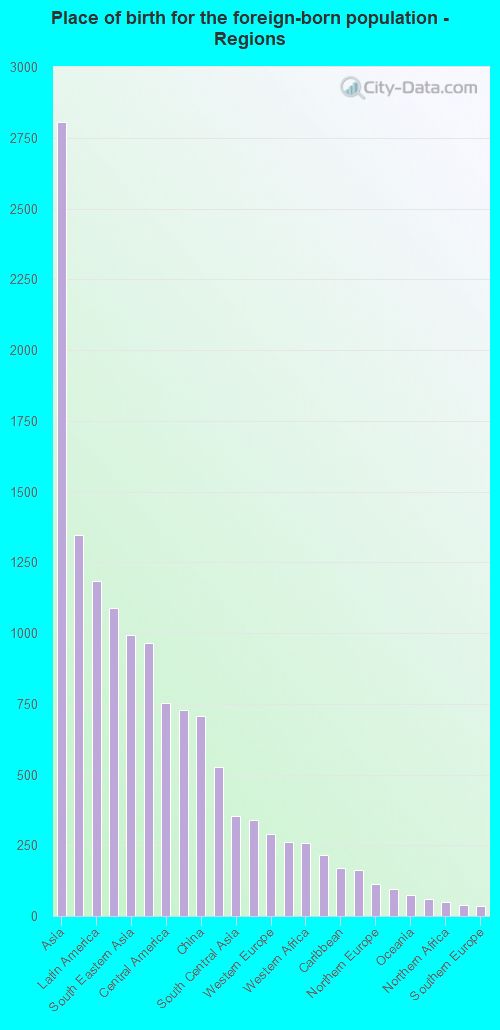
According to 2022 data, the most numerous races in Springfield, MO are White alone (141,018 residents), Black alone (7,096 residents), and Two or more races (8,624 residents). 92.8% of Springfield residents speak English at home. 3.5% of Springfield, MO residents are foreign-born (1.7% born in Asia, 0.7% born in Latin America, 0.6% born in Europe, 0.4% born in Africa), which is 15.6% less than the foreign-born rate of 4.0% across the entire state of Missouri.
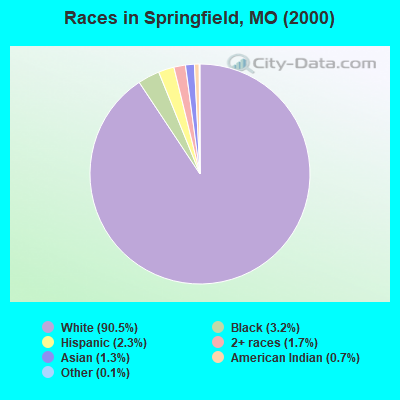
Race distribution in Springfield
2000 2022
137,140 90.5% White alone 4,863 3.2% Black alone 3,501 2.3% Hispanic 2,606 1.7% Two or more races 2,028 1.3% Asian alone 1,088 0.7% American Indian alone 225 0.1% Other race alone 129 0.09% Native Hawaiian and Other
141,018 82.9% White alone 8,624 5.1% Two or more races 8,725 5.1% Hispanic 7,096 4.2% Black alone 2,236 1.3% Asian alone 1,305 0.8% Other race alone 717 0.4% Native Hawaiian and Other 341 0.2% American Indian alone
2000 2022
4,686,474 83.8% White alone 625,667 11.2% Black alone 118,592 2.1% Hispanic 71,905 1.3% Two or more races 61,041 1.1% Asian alone 23,302 0.4% American Indian alone 5,291 0.09% Other race alone 2,939 0.05% Native Hawaiian and Other
4,733,411 76.6% White alone 656,739 10.6% Black alone 316,300 5.1% Two or more races 291,763 4.7% Hispanic 132,436 2.1% Asian alone 27,467 0.4% Other race alone 12,313 0.2% American Indian alone 7,528 0.1% Native Hawaiian and Other
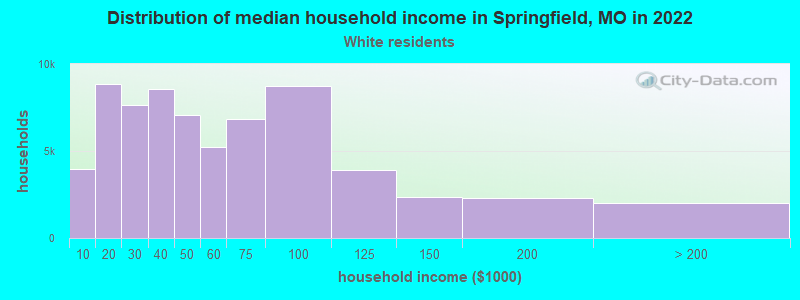
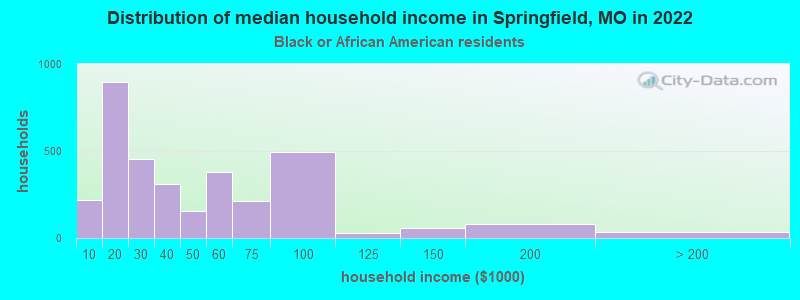
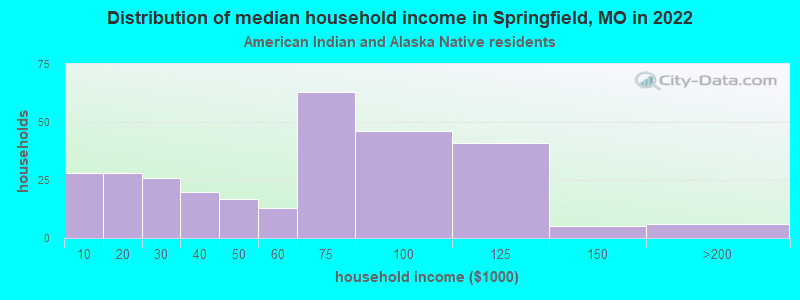
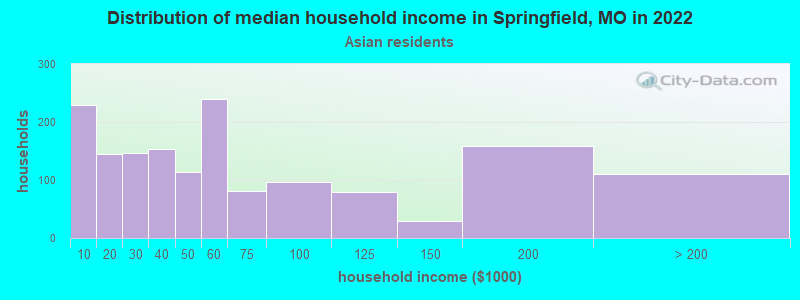
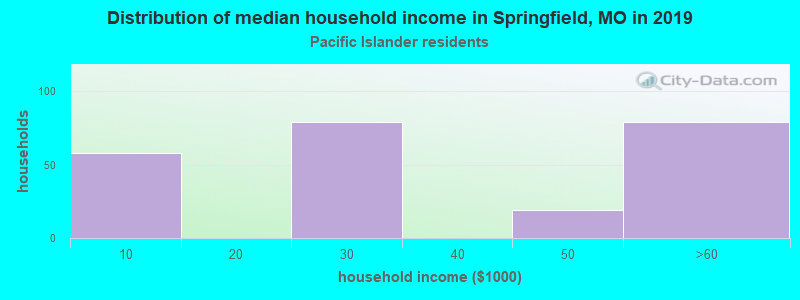
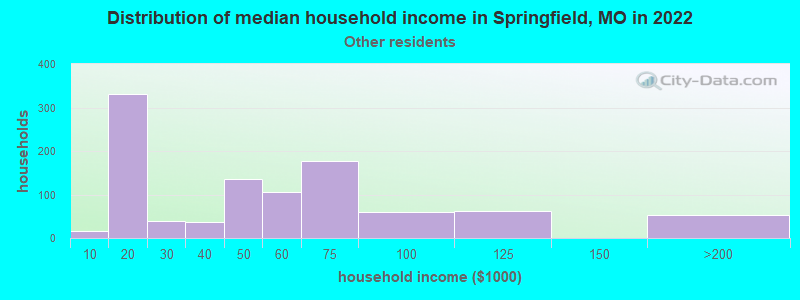
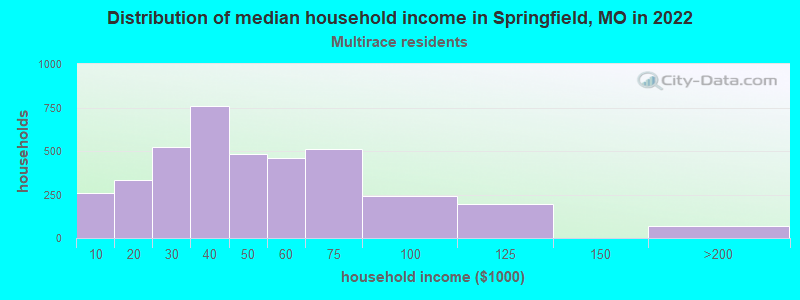
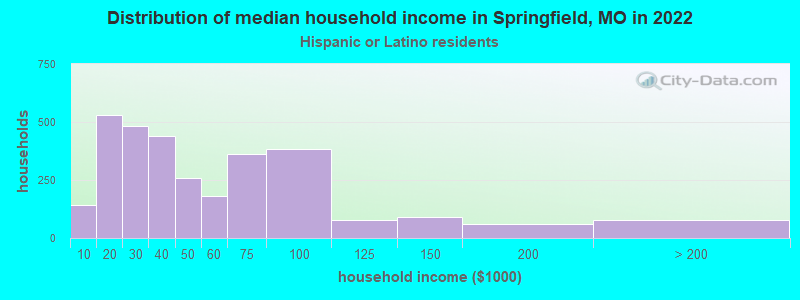
Income and house value in Springfield Median household income in 2022 $46,801 White non-Hispanic householders$31,952 Black householders$33,836 American Indian and Alaska Native householders$49,587 Asian householders$49,004 Some other race householders$40,521 Two or more races householders$34,193 Hispanic or Latino race householdersMedian 2022 house value $169,571 White Non-Hispanic householders$142,296 Black or African American householders$146,736 American Indian or Alaska Native householders $189,235 Asian householders$95,146 Native Hawaiian and other Pacific Islander householders$146,102 Some other race householders$132,781 Two or more races householders$142,084 Hispanic or Latino householders
Median age by race in Springfield
35.4 Median age for White residents33.1 38.0 27.0 Median age for Black or African American residents26.9 33.0 27.2 Median age for American Indian / Alaska Native residents26.5 31.1 38.6 Median age for Asian residents38.9 37.7 26.3 Median age for Native Hawaiian / Pacific Islander residents-666,666,666.0 -666,666,666.0 28.4 Median age for Other race residents30.8 28.3 22.8 Median age for Two or more races residents17.9 26.9 35.6 Median age for White alone residents33.2 38.2 24.5 Median age for Hispanic or Latino residents24.1 24.7
Owner/renter occupied households by race in Springfield
House owners and renters - White residents 28,673 42.5% Owner occupied38,828 57.5% Renter occupiedHouse owners and renters - Black or African American residents 294 12.1% Owner occupied2,139 87.9% Renter occupiedHouse owners and renters - American Indian / Alaska Native residents 61 21.6% Owner occupied222 78.4% Renter occupiedHouse owners and renters - Asian residents 360 33.4% Owner occupied718 66.6% Renter occupiedHouse owners and renters - Native Hawaiian / Pacific Islander residents 25 100.0% Renter occupiedHouse owners and renters - Other race residents 365 17.4% Owner occupied1,733 82.6% Renter occupiedHouse owners and renters - Two or more races residents 1,725 45.1% Owner occupied2,097 54.9% Renter occupiedHouse owners and renters - White alone residents 28,465 42.8% Owner occupied38,060 57.2% Renter occupiedHouse owners and renters - Hispanic or Latino residents 651 18.3% Owner occupied2,910 81.7% Renter occupied
Language usage in Springfield
English speakers - Total 92.8% of residents of Springfield speak English at home.
2.8% of residents speak Spanish at home 2,863 63.3% Speak English very well1,662 36.7% Speak English less than very well4.4% of residents speak other language at home 4,381 61.1% Speak English very well2,786 38.9% Speak English less than very well
English speakers - Born in the United States 97.3% of residents of Springfield speak English at home.
1.8% of residents speak Spanish at home 766 69.4% Speak English very well337 30.6% Speak English less than very well0.9% of residents speak other language at home 451 87.9% Speak English very well62 12.1% Speak English less than very well
English speakers - Native, born elsewhere 53.4% of residents of Springfield speak English at home.
8.7% of residents speak Spanish at home 64 47.1% Speak English very well72 52.9% Speak English less than very well37.9% of residents speak other language at home 502 84.2% Speak English very well94 15.8% Speak English less than very well
English speakers - Foreign-born 22.5% of residents of Springfield speak English at home.
22.0% of residents speak Spanish at home 921 46.9% Speak English very well1,043 53.1% Speak English less than very well55.5% of residents speak other language at home 2,375 48.0% Speak English very well2,575 52.0% Speak English less than very well
White (Caucasian) - Speak only English Native:
97.6% (130,294)Foreign-born:
30.7% (1,183)
White (Caucasian) - Speak another language Native:
2.4% (3,218)Foreign-born:
69.3% (2,665)
Black or African American - Speak only English Native:
91.8% (5,700)Foreign-born:
50.1% (343)
Black or African American - Speak another language Native:
10.7% (663)Foreign-born:
50.3% (344)
American Indian / Alaska Native - Speak only English Native:
84.3% (474)Foreign-born:
89.8% (18)
American Indian / Alaska Native - Speak another language Native:
12.3% (69)Foreign-born:
75.3% (15)
Asian - Speak only English Native:
99.1% (717)Foreign-born:
16.3% (341)
Asian - Speak another language Native:
14.5% (105)Foreign-born:
82.5% (1,728)
Native Hawaiian / Pacific Islander - Speak another language Native:
94.3% (137)Foreign-born:
94.6% (15)
Other race - Speak only English Native:
82.4% (1,454)Foreign-born:
16.0% (117)
Other race - Speak another language Native:
21.2% (373)Foreign-born:
84.5% (616)
Two or more races - Speak only English Native:
92.1% (8,773)Foreign-born:
22.1% (137)
Two or more races - Speak another language Native:
7.9% (751)Foreign-born:
77.9% (482)
White alone - Speak only English Native:
97.6% (128,836)Foreign-born:
22.8% (736)
White alone - Speak another language Native:
2.4% (3,142)Foreign-born:
77.2% (2,495)
Hispanic or Latino - Speak only English Native:
85.0% (4,275)Foreign-born:
23.4% (584)
Hispanic or Latino - Speak another language Native:
15.0% (755)Foreign-born:
76.6% (1,913)
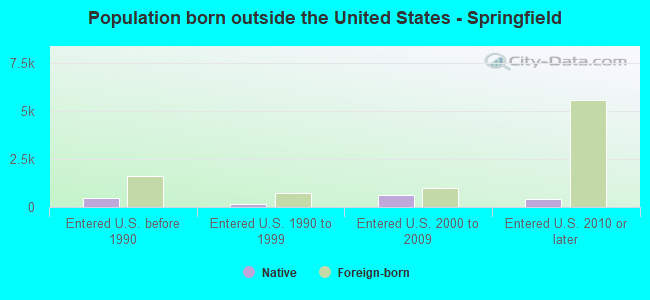
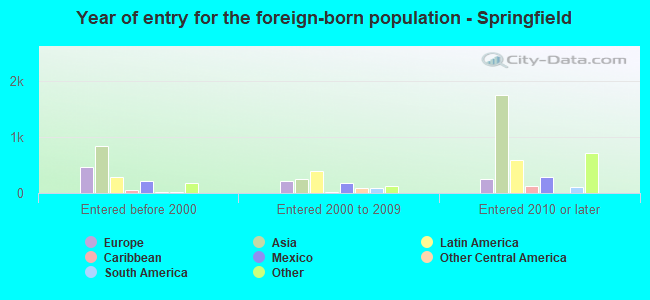
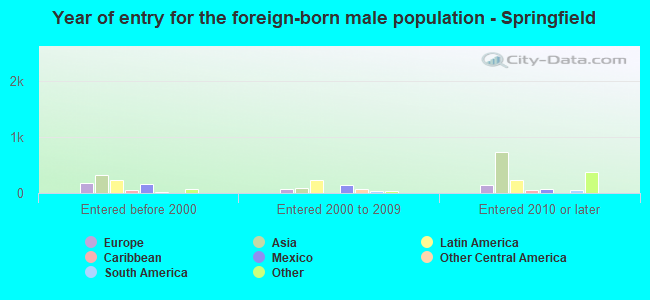
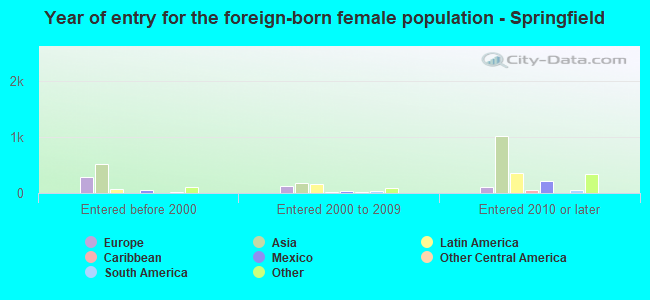
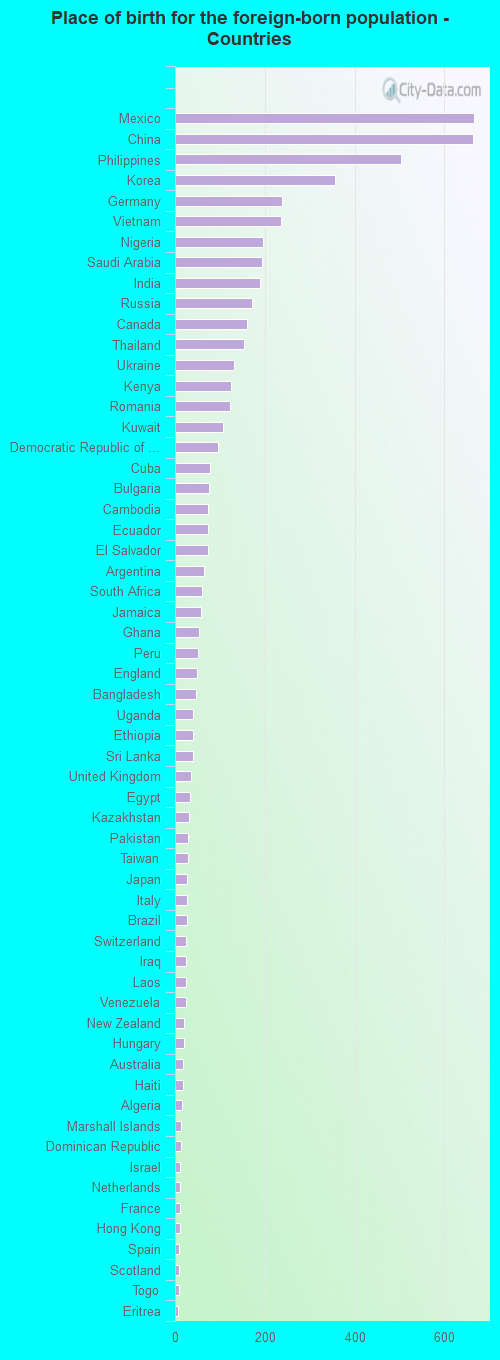
Foreign-born residents in Springfield 5,924 residents are foreign born (1.7% Asia , 0.7% Latin America , 0.6% Europe , 0.4% Africa ).
This city:
3.5%Missouri:
4.2%
Marital status for residents in Springfield Marital status - White (Caucasian) population 15 years and over
Males 44.1% Never married40.1% Now married1.6% Separated3.4% Widowed10.8% DivorcedFemales 36.0% Never married34.4% Now married1.8% Separated9.7% Widowed18.2% DivorcedWomen who gave birth in the past 12 months Now married:
76.4% (857)Unmarried:
23.6% (265)
Women who did not give birth in the past 12 months Now married:
29.8% (11,046)Unmarried:
70.2% (26,024)
Marital status - Black or African American population 15 years and over
Males 67.7% Never married18.0% Now married0.2% Separated2.0% Widowed12.2% DivorcedFemales 55.4% Never married17.1% Now married5.2% Separated4.5% Widowed17.8% DivorcedWomen who gave birth in the past 12 months Now married:
11.1% (19)Unmarried:
88.9% (148)
Women who did not give birth in the past 12 months Now married:
9.8% (193)Unmarried:
90.2% (1,782)
Marital status - American Indian / Alaska Native population 15 years and over
Males 54.4% Never married24.3% Now married2.6% Separated4.4% Widowed14.3% DivorcedFemales 38.5% Never married44.2% Now married1.4% Separated2.9% Widowed12.9% DivorcedWomen who did not give birth in the past 12 months Now married:
42.9% (100)Unmarried:
57.1% (133)
Marital status - Asian population 15 years and over
Males 41.0% Never married53.5% Now married3.8% Separated0.0% Widowed1.7% DivorcedFemales 42.7% Never married42.2% Now married2.3% Separated6.2% Widowed6.6% DivorcedWomen who gave birth in the past 12 months Now married:
100.0% (74)Unmarried:
0.0% (0)
Women who did not give birth in the past 12 months Now married:
35.1% (453)Unmarried:
64.9% (837)
Marital status - Native Hawaiian / Pacific Islander population 15 years and over
Males 26.7% Never married73.3% Now married0.0% Separated0.0% Widowed0.0% DivorcedFemales 8.5% Never married87.3% Now married0.0% Separated4.2% Widowed0.0% DivorcedWomen who did not give birth in the past 12 months Now married:
91.2% (100)Unmarried:
8.8% (10)
Marital status - Other race population 15 years and over
Males 46.0% Never married38.4% Now married2.5% Separated8.6% Widowed4.5% DivorcedFemales 50.5% Never married41.0% Now married4.9% Separated0.0% Widowed3.6% DivorcedWomen who gave birth in the past 12 months Now married:
100.0% (13)Unmarried:
0.0% (0)
Women who did not give birth in the past 12 months Now married:
37.9% (352)Unmarried:
62.1% (575)
Marital status - Two or more races population 15 years and over
Males 43.0% Never married32.9% Now married0.0% Separated10.0% Widowed14.2% DivorcedFemales 47.8% Never married32.0% Now married4.7% Separated11.1% Widowed4.5% DivorcedWomen who gave birth in the past 12 months Now married:
53.5% (90)Unmarried:
46.5% (78)
Women who did not give birth in the past 12 months Now married:
27.2% (591)Unmarried:
72.8% (1,580)
Marital status - White alone, not Hispanic / Latino population 15 years and over
Males 44.0% Never married40.0% Now married1.6% Separated3.5% Widowed11.0% DivorcedFemales 35.8% Never married34.4% Now married1.8% Separated9.8% Widowed18.3% DivorcedWomen who gave birth in the past 12 months Now married:
76.4% (857)Unmarried:
23.6% (265)
Women who did not give birth in the past 12 months Now married:
29.7% (10,833)Unmarried:
70.3% (25,590)
Marital status - Hispanic or Latino population 15 years and over
Males 45.5% Never married40.7% Now married1.3% Separated5.0% Widowed7.6% DivorcedFemales 40.5% Never married43.7% Now married2.7% Separated2.9% Widowed10.1% DivorcedWomen who gave birth in the past 12 months Now married:
78.8% (85)Unmarried:
21.2% (23)
Women who did not give birth in the past 12 months Now married:
40.9% (932)Unmarried:
59.1% (1,346)
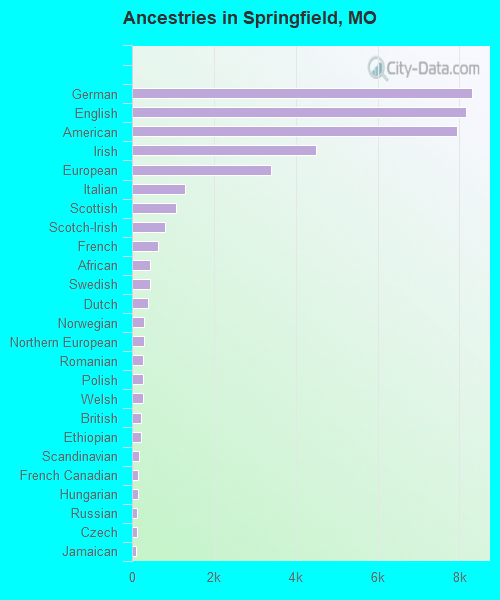
Ancestries in Springfield
8,308 10.7% German8,159 10.5% English7,953 10.2% American4,504 5.8% Irish3,403 4.4% European1,301 1.7% Italian1,075 1.4% Scottish798 1.0% Scotch-Irish633 0.8% French438 0.6% African429 0.6% Swedish400 0.5% Dutch305 0.4% Norwegian288 0.4% Northern European268 0.3% Romanian265 0.3% Polish265 0.3% Welsh218 0.3% British216 0.3% Ethiopian171 0.2% Scandinavian143 0.2% French Canadian138 0.2% Hungarian134 0.2% Russian117 0.2% Czech106 0.1% Jamaican98 0.1% Kenyan96 0.1% Nigerian93 0.1% Bulgarian89 0.1% Danish82 0.1% Yugoslavian79 0.1% Ukrainian78 0.1% Eastern European71 0.09% Arab68 0.09% Lithuanian63 0.08% South African61 0.08% Lebanese56 0.07% Greek54 0.07% Canadian52 0.07% Ghanaian49 0.06% Austrian44 0.06% Croatian40 0.05% New Zealander35 0.05% Portuguese33 0.04% Swiss33 0.04% Albanian31 0.04% Brazilian31 0.04% Icelander30 0.04% Czechoslovakian24 0.03% Slovak21 0.03% Haitian15 0.02% Iraqi15 0.02% Egyptian14 0.02% Ugandan10 0.01% Australian8 0.01% Finnish7 0.01% Celtic6 0.01% Pennsylvania German5 0.01% Iranian4 0.01% Armenian
Geographical mobility in Springfield Same house 1 year ago 113,263 79.6% White (Caucasian)4,612 64.5% Black or African American496 84.8% American Indian / Alaska Native2,530 77.0% Asian161 40.8% Native Hawaiian / Pacific Islander1,831 70.7% Other race7,440 65.7% Two or more races111,363 79.6% White alone, not Hispanic / Latino6,493 76.7% Hispanic or LatinoMoved within same county 14,990 10.5% White / Caucasian312 4.4% Black or African American46 7.9% American Indian / Alaska Native264 8.0% Asian22 5.6% Native Hawaiian / Pacific Islander298 11.5% Other race1,208 10.7% Two or more races14,815 10.6% White alone, not Hispanic / Latino980 11.6% Hispanic or LatinoMoved within same state 7,775 5.5% White / Caucasian1,127 15.8% Black or African American39 6.7% American Indian / Alaska Native93 2.8% Asian223 56.3% Native Hawaiian / Pacific Islander218 8.4% Other race291 2.6% Two or more races7,748 5.5% White alone, not Hispanic / Latino394 4.7% Hispanic or LatinoMoved from different state 5,887 4.1% White / Caucasian733 10.2% Black or African American19 3.2% American Indian / Alaska Native143 4.4% Asian160 6.2% Other race2,355 20.8% Two or more races5,735 4.1% White alone, not Hispanic / Latino572 6.8% Hispanic or LatinoMoved from abroad 307 0.2% White368 5.1% Black or African American225 6.9% Asian28 0.2% Two or more races307 0.2% White alone, not Hispanic / Latino93 1.1% Hispanic or Latino
Children Nativity (place of birth) in Springfield
Children under 6 years - Living with two parents Both parents native 4,904 99.2% Native40 0.8% Foreign-bornBoth parents foreign-born 78 100.0% NativeOne native, one foreign-born parent 336 96.3% Native13 3.7% Foreign-bornChildren under 6 years - Living with one parent Native parent 4,373 100.0% NativeForeign-born parent 259 100.0% NativeChildren 6 to 17 years - Living with two parents Both parents native 8,599 99.5% Native44 0.5% Foreign-bornBoth parents foreign-born 100 76.7% Native30 23.3% Foreign-bornOne native, one foreign-born parent 630 94.0% Native40 6.0% Foreign-bornChildren 6 to 17 years - Living with one parent Native parent 7,814 100.0% NativeForeign-born parent 809 59.6% Native549 40.4% Foreign-born
Grandparents responsible for own grandchildren in Springfield
Grandparents (30 to 59 years) White / Caucasian 583 47.9% Responsible for grandchildren635 52.1% Not responsible for grandchildrenBlack or African American 24 75.8% Responsible for grandchildren8 24.2% Not responsible for grandchildrenAsian 45 100.0% Responsible for grandchildrenOther race 42 100.0% Not responsible for grandchildrenTwo or more races 6 51.6% Responsible for grandchildren5 48.4% Not responsible for grandchildrenWhite alone, not Hispanic / Latino 583 47.9% Responsible for grandchildren635 52.1% Not responsible for grandchildrenHispanic or Latino 43 100.0% Not responsible for grandchildrenGrandparents (60 years and over) White / Caucasian 476 60.9% Responsible for grandchildren305 39.1% Not responsible for grandchildrenBlack or African American 17 46.7% Responsible for grandchildren19 53.3% Not responsible for grandchildrenAsian 14 100.0% Not responsible for grandchildrenOther race 4 100.0% Responsible for grandchildrenTwo or more races 24 12.5% Responsible for grandchildren169 87.5% Not responsible for grandchildrenWhite alone, not Hispanic / Latino 476 60.9% Responsible for grandchildren305 39.1% Not responsible for grandchildrenHispanic or Latino 35 26.6% Responsible for grandchildren97 73.4% Not responsible for grandchildren