Estimated zip code population in 2022: 7,408 Zip code population in 2010: 6,975 Zip code population in 2000: 5,862
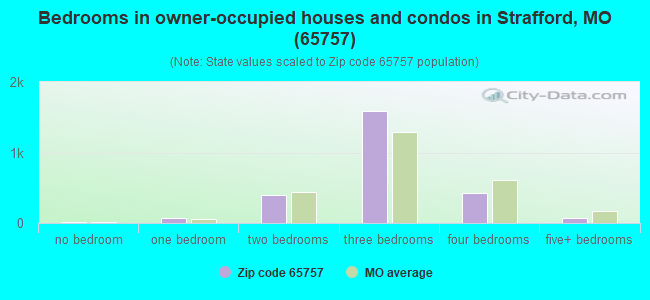
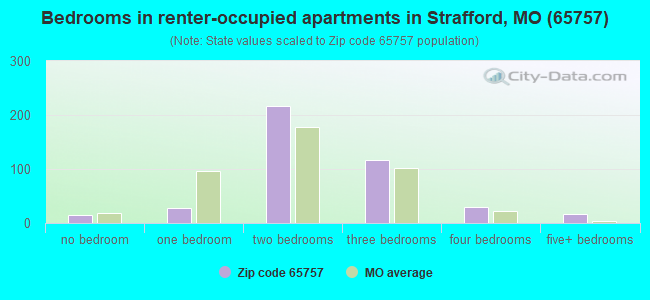
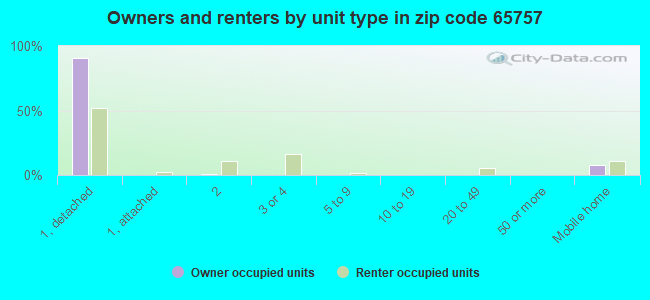
Houses and condos: 3,010 Renter-occupied apartments: 419
% of renters here:
14%
State:
32%
March 2022 cost of living index in zip code 65757: 78.0 (low, U.S. average is 100)
Land area: 82.3 sq. mi. Water area: 0.1 sq. mi.
Population density: 90 people per square mile
(very low).
OSM Map
General Map
Google Map
MSN Map
OSM Map
General Map
Google Map
MSN Map
OSM Map
General Map
Google Map
MSN Map
OSM Map
General Map
Google Map
MSN Map
Please wait while loading the map...
Real estate property taxes paid for housing units in 2022:
This zip code:
0.6% ($1,536)
Missouri:
0.8% ($1,810)
Median real estate property taxes paid for housing units with mortgages in 2022: $1,453 (0.6%) Median real estate property taxes paid for housing units with no mortgage in 2022: $1,697 (0.6%)
Averages for the 2020 tax year for zip code 65757, filed in 2021:
Average Adjusted Gross Income (AGI) in 2020: $66,883 (Individual Income Tax Returns)
Here:
$66,883
State:
$68,151
Salary/wage: $59,816 (reported on 80.8% of returns)
Here:
$59,816
State:
$56,131
(% of AGI for various income ranges: 1224.7% for AGIs below $25k, 3698.2% for AGIs $25k-50k, 6806.7% for AGIs $50k-75k, 9590.0% for AGIs $75k-100k, 18088.1% for AGIs $100k-200k, 79542.5% for AGIs over 200k)
Taxable interest for individuals: $1,210 (reported on 31.2% of returns)
This zip code:
$1,210
Missouri:
$1,586
(% of AGI for various income ranges: 18.6% for AGIs below $25k, 19.3% for AGIs $25k-50k, 34.1% for AGIs $50k-75k, 60.6% for AGIs $75k-100k, 101.3% for AGIs $100k-200k, 1215.0% for AGIs over 200k)
Ordinary dividends: $7,216 (reported on 15.4% of returns)
Here:
$7,216
State:
$10,947
(% of AGI for various income ranges: 27.4% for AGIs below $25k, 26.0% for AGIs $25k-50k, 74.1% for AGIs $50k-75k, 148.4% for AGIs $75k-100k, 233.9% for AGIs $100k-200k, 5642.5% for AGIs over 200k)
Net capital gain/loss in AGI: +$14,258 (reported on 16.0% of returns)
Here:
+$14,258
State:
+$18,453
(% of AGI for various income ranges: 12.1% for AGIs below $25k, 25.4% for AGIs $25k-50k, 107.2% for AGIs $50k-75k, 190.6% for AGIs $75k-100k, 709.7% for AGIs $100k-200k, 12352.5% for AGIs over 200k)
Profit/loss from business: +$12,489 (reported on 17.3% of returns)
Here:
+$12,489
State:
+$12,260
(% of AGI for various income ranges: 114.7% for AGIs below $25k, 274.9% for AGIs $25k-50k, 310.5% for AGIs $50k-75k, 340.3% for AGIs $75k-100k, 617.7% for AGIs $100k-200k, 2745.0% for AGIs over 200k)
Taxable individual retirement arrangement distribution: $15,209 (reported on 8.9% of returns)
65757:
$15,209
Missouri:
$19,719
(% of AGI for various income ranges: 64.3% for AGIs below $25k, 88.8% for AGIs $25k-50k, 274.9% for AGIs $50k-75k, 337.1% for AGIs $75k-100k, 586.5% for AGIs $100k-200k)
Total itemized deductions: $37,225 (reported on 5.4% of returns)
Here:
$37,225
State:
$36,651
(% of AGI for various income ranges: 80.9% for AGIs below $25k, 196.4% for AGIs $50k-75k, 251.3% for AGIs $75k-100k, 784.5% for AGIs $100k-200k, 7132.5% for AGIs over 200k)
Charity contributions: $13,741 (reported on 4.6% of returns)
Here:
$13,741
State:
$15,671
(% of AGI for various income ranges: 37.3% for AGIs $25k-50k, 59.0% for AGIs $75k-100k, 244.5% for AGIs $100k-200k, 2862.5% for AGIs over 200k)
Taxes paid: $7,250 (reported on 5.4% of returns)
65757:
$7,250
State:
$7,608
(% of AGI for various income ranges: 8.3% for AGIs below $25k, 30.3% for AGIs $50k-75k, 49.0% for AGIs $75k-100k, 194.2% for AGIs $100k-200k, 1287.5% for AGIs over 200k)
Earned income credit: $2,265 (reported on 15.4% of returns)
Here:
$2,265
State:
$2,315
(% of AGI for various income ranges: 93.4% for AGIs below $25k, 84.8% for AGIs $25k-50k, 3.3% for AGIs $50k-75k)
Percentage of individuals using paid preparers for their 2020 taxes: 94.6%
Here:
95%
State:
93%
(% for various income ranges: 95.5% for AGIs below $25k, 94.3% for AGIs $25k-50k, 94.7% for AGIs $50k-75k, 93.3% for AGIs $75k-100k, 92.7% for AGIs $100k-200k, 100.0% for AGIs over 200k)
Averages for the 2012 tax year for zip code 65757, filed in 2013:
Average Adjusted Gross Income (AGI) in 2012: $54,542 (Individual Income Tax Returns)
Here:
$54,542
State:
$55,896
Salary/wage: $45,659 (reported on 83.6% of returns)
Here:
$45,659
State:
$46,205
(% of AGI for various income ranges: 74.2% for AGIs below $25k, 77.7% for AGIs $25k-50k, 78.7% for AGIs $50k-75k, 77.0% for AGIs $75k-100k, 78.9% for AGIs $100k-200k, 39.2% for AGIs over 200k)
Taxable interest for individuals: $1,102 (reported on 40.8% of returns)
This zip code:
$1,102
Missouri:
$1,559
(% of AGI for various income ranges: 1.4% for AGIs below $25k, 0.6% for AGIs $25k-50k, 0.5% for AGIs $50k-75k, 0.5% for AGIs $75k-100k, 0.5% for AGIs $100k-200k, 1.7% for AGIs over 200k)
Ordinary dividends: $5,151 (reported on 17.4% of returns)
Here:
$5,151
State:
$7,410
(% of AGI for various income ranges: 1.0% for AGIs below $25k, 1.0% for AGIs $25k-50k, 0.9% for AGIs $50k-75k, 1.1% for AGIs $75k-100k, 1.0% for AGIs $100k-200k, 4.3% for AGIs over 200k)
Net capital gain/loss in AGI: +$10,012 (reported on 14.1% of returns)
Here:
+$10,012
State:
+$11,579
(% of AGI for various income ranges: 1.0% for AGIs $25k-50k, 1.0% for AGIs $50k-75k, 1.1% for AGIs $75k-100k, 1.6% for AGIs $100k-200k, 8.7% for AGIs over 200k)
Profit/loss from business: +$7,446 (reported on 17.1% of returns)
Here:
+$7,446
State:
+$11,688
(% of AGI for various income ranges: 6.0% for AGIs below $25k, 4.5% for AGIs $25k-50k, 2.4% for AGIs $50k-75k, 1.7% for AGIs $75k-100k, 1.7% for AGIs $100k-200k)
Taxable individual retirement arrangement distribution: $13,409 (reported on 10.5% of returns)
65757:
$13,409
Missouri:
$14,773
(% of AGI for various income ranges: 3.2% for AGIs below $25k, 2.9% for AGIs $25k-50k, 2.2% for AGIs $50k-75k, 3.6% for AGIs $75k-100k, 4.3% for AGIs $100k-200k)
Total itemized deductions: $21,727 (20% of AGI, reported on 27.6% of returns)
Here:
$21,727
State:
$22,730
Here:
19.8% of AGI
State:
19.2% of AGI
(% of AGI for various income ranges: 8.3% for AGIs below $25k, 8.4% for AGIs $25k-50k, 8.6% for AGIs $50k-75k, 11.6% for AGIs $75k-100k, 14.1% for AGIs $100k-200k, 13.1% for AGIs over 200k)
Charity contributions: $5,502 (reported on 20.7% of returns)
Here:
$5,502
State:
$4,745
(% of AGI for various income ranges: 0.9% for AGIs below $25k, 1.4% for AGIs $25k-50k, 1.5% for AGIs $50k-75k, 2.1% for AGIs $75k-100k, 2.8% for AGIs $100k-200k, 3.2% for AGIs over 200k)
Taxes paid: $6,988 (reported on 27.6% of returns)
65757:
$6,988
State:
$8,399
(% of AGI for various income ranges: 0.9% for AGIs below $25k, 1.6% for AGIs $25k-50k, 2.0% for AGIs $50k-75k, 3.4% for AGIs $75k-100k, 5.1% for AGIs $100k-200k, 6.3% for AGIs over 200k)
Earned income credit: $2,266 (reported on 17.4% of returns)
Here:
$2,266
State:
$2,288
(% of AGI for various income ranges: 6.1% for AGIs below $25k, 1.2% for AGIs $25k-50k)
Percentage of individuals using paid preparers for their 2012 taxes: 58.2%
Here:
58%
State:
55%
(% for various income ranges: 50.0% for AGIs below $25k, 63.5% for AGIs $25k-50k, 59.6% for AGIs $50k-75k, 61.3% for AGIs $75k-100k, 68.0% for AGIs $100k-200k, 83.3% for AGIs over 200k)
Averages for the 2004 tax year for zip code 65757, filed in 2005:
Average Adjusted Gross Income (AGI) in 2004: $40,973 (Individual Income Tax Returns)
Here:
$40,973
State:
$44,591
Salary/wage: $37,140 (reported on 85.7% of returns)
Here:
$37,140
State:
$38,941
(% of AGI for various income ranges: 135.7% for AGIs below $10k, 79.7% for AGIs $10k-25k, 84.1% for AGIs $25k-50k, 83.4% for AGIs $50k-75k, 84.1% for AGIs $75k-100k, 56.9% for AGIs over 100k)
Taxable interest for individuals: $1,213 (reported on 44.6% of returns)
This zip code:
$1,213
Missouri:
$1,801
(% of AGI for various income ranges: 10.6% for AGIs below $10k, 2.3% for AGIs $10k-25k, 1.2% for AGIs $25k-50k, 0.9% for AGIs $50k-75k, 0.8% for AGIs $75k-100k, 1.2% for AGIs over 100k)
Taxable dividends: $1,780 (reported on 17.5% of returns)
Here:
$1,780
State:
$3,677
(% of AGI for various income ranges: 2.7% for AGIs below $10k, 0.4% for AGIs $10k-25k, 0.3% for AGIs $25k-50k, 0.5% for AGIs $50k-75k, 0.6% for AGIs $75k-100k, 1.6% for AGIs over 100k)
Net capital gain/loss: +$10,264 (reported on 15.0% of returns)
Here:
+$10,264
State:
+$8,915
(% of AGI for various income ranges: -1.1% for AGIs below $10k, 1.0% for AGIs $10k-25k, 0.7% for AGIs $25k-50k, 0.9% for AGIs $50k-75k, 4.2% for AGIs $75k-100k, 11.4% for AGIs over 100k)
Profit/loss from business: +$7,889 (reported on 19.1% of returns)
Here:
+$7,889
State:
+$9,793
(% of AGI for various income ranges: 8.4% for AGIs below $10k, 5.9% for AGIs $10k-25k, 4.4% for AGIs $25k-50k, 2.9% for AGIs $50k-75k, 1.5% for AGIs $75k-100k, 3.8% for AGIs over 100k)
IRA payment deduction: $3,128 (reported on 3.3% of returns)
65757:
$3,128
Missouri:
$2,972
(% of AGI for various income ranges: 0.2% for AGIs $10k-25k, 0.4% for AGIs $25k-50k, 0.2% for AGIs $50k-75k, 0.5% for AGIs $75k-100k)
Total itemized deductions: $16,182 (22% of AGI, reported on 28.9% of returns)
Here:
$16,182
State:
$18,261
Here:
21.8% of AGI
State:
20.5% of AGI
(% of AGI for various income ranges: 21.7% for AGIs below $10k, 7.6% for AGIs $10k-25k, 9.9% for AGIs $25k-50k, 12.2% for AGIs $50k-75k, 13.1% for AGIs $75k-100k, 12.2% for AGIs over 100k)
Charity contributions deductions: $3,668 (5% of AGI, reported on 23.3% of returns)
Here:
$3,668
State:
$3,665
Here:
4.6% of AGI
State:
3.9% of AGI
(% of AGI for various income ranges: 0.7% for AGIs below $10k, 0.7% for AGIs $10k-25k, 1.6% for AGIs $25k-50k, 2.1% for AGIs $50k-75k, 2.6% for AGIs $75k-100k, 3.1% for AGIs over 100k)
Total tax: $5,345 (reported on 76.3% of returns)
65757:
$5,345
State:
$6,999
(% of AGI for various income ranges: 6.0% for AGIs below $10k, 4.1% for AGIs $10k-25k, 6.2% for AGIs $25k-50k, 8.2% for AGIs $50k-75k, 10.0% for AGIs $75k-100k, 18.6% for AGIs over 100k)
Earned income credit: $1,687 (reported on 16.2% of returns)
Here:
$1,687
State:
$1,728
Percentage of individuals using paid preparers for their 2004 taxes: 65.5%
Here:
66%
State:
62%
(% for various income ranges: 58.1% for AGIs below $10k, 65.0% for AGIs $10k-25k, 67.7% for AGIs $25k-50k, 65.1% for AGIs $50k-75k, 73.3% for AGIs $75k-100k, 73.9% for AGIs over 100k)
Household received Food Stamps/SNAP in the past 12 months: 243 Household did not receive Food Stamps/SNAP in the past 12 months: 2,754
Women who had a birth in the past 12 months: 29 (27 now married, 0 unmarried) Women who did not have a birth in the past 12 months: 1,463 (807 now married, 650 unmarried)
Housing units in zip code 65757 with a mortgage: 1,412 (91 second mortgage, 82 both second mortgage and home equity loan) Houses without a mortgage: 16
Median monthly owner costs for units with a mortgage: $1,234 Median monthly owner costs for units without a mortgage: $461
Residents with income below the poverty level in 2022:
This zip code:
9.0%
Whole state:
13.2%
Residents with income below 50% of the poverty level in 2022:
This zip code:
6.8%
Whole state:
6.8%
Median number of rooms in houses and condos:
Here:
6.2
State:
6.4
Median number of rooms in apartments:
Here:
4.9
State:
4.4
Notable locations in this zip code not listed on our city pages
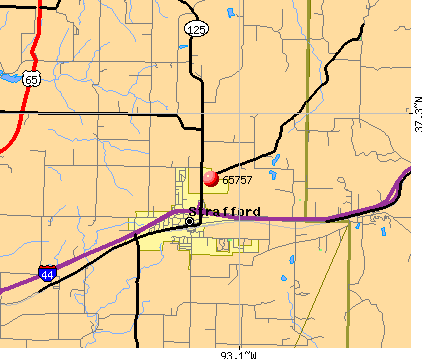
Notable locations in zip code 65757: Happy Hollow Camp (A), Buena Vista Track (B), Locust Prairie Community Center (C), Strafford Fire Protection District Station 4 (D), Strafford Fire Protection District Station 1 (E), Strafford Fire Protection District Station 3 (F). Display/hide their locations on the map
Churches in zip code 65757 include: North Star Church (A), Potter Church (B), Mount Calvary Church (C), Mount Pisgah Church (D), Danforth Church (E). Display/hide their locations on the map
Cemeteries: Dishman Cemetery (1), Mullinax Cemetery (2), Potter Cemetery (3), Welch Cemetery (4), Willis Cemetery (5), Caldwell Cemetery (6). Display/hide their locations on the map
Reservoirs: Hardeke Lake (A), Jones Lake (B), Ford Lake (C), Lake James (D), Hilliard Estates Lake (E), Mueller Lake (F), Barnard Lake (G), Salisbury Lake (H). Display/hide their locations on the map
Streams, rivers, and creeks: North Fork Pomme de Terre River (A), Broad Creek (B), South Fork Pomme de Terre River (C), Spring Creek (D), North Carolina Creek (E), Jarrett Branch (F), Grier Branch (G), Polk Spring Branch (H). Display/hide their locations on the map
In group quarters: 103 (-1 institutionalized population)
Size of family households: 1,129 2-persons, 457 3-persons, 199 4-persons, 218 5-persons, 110 6-persons, 23 7-or-more-persons
Size of nonfamily households: 720 1-person, 142 2-persons, 6 3-persons
1,391 married couples with children.
258 single-parent households (98 men, 160 women).
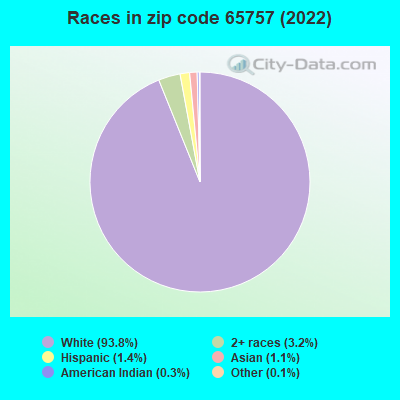
97.8% of residents of 65757 zip code speak English at home.
0.6% of residents speak Spanish at home (88% very well, 12% not well).
1.2% of residents speak other Indo-European language at home (73% very well, 27% well).
0.6% of residents speak Asian or Pacific Island language at home (100% very well).
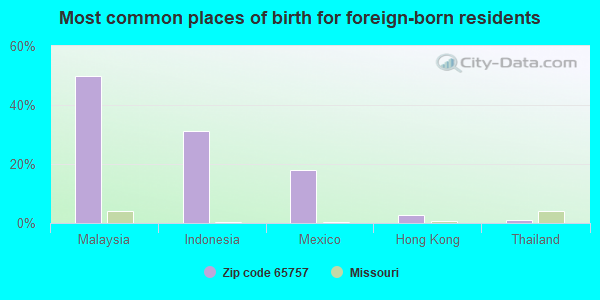
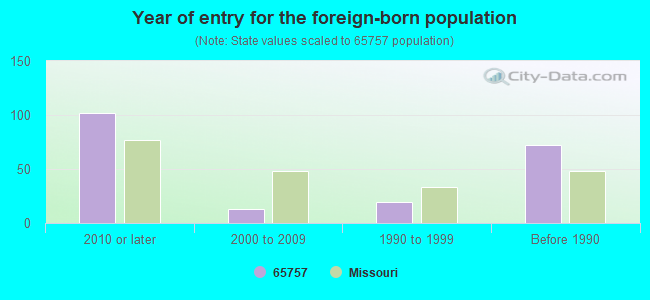
Foreign born population: 106 (1.4%) (58.1% of them are naturalized citizens)
This zip code:
1.4%
Whole state:
4.1%
50%Malaysia
31%Indonesia
18%Mexico
3%Hong Kong
1%Thailand
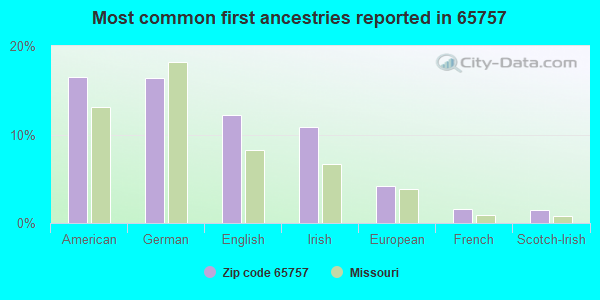
16%American
16%German
12%English
11%Irish
4%European
2%French
1%Scotch-Irish
Year of entry for the foreign-born population
1022010 or later
132000 to 2009
191990 to 1999
72Before 1990
Facilities with environmental interests located in this zip code:
GIT N GO #86 (325 E EVERGREEN in STRAFFORD, MO)
STATE MASTER (Missouri monitoring and compilance) - RCRAINFO-MOP000028431, NOT IN A UNIVERSE, RCRAINFO-MOP000032623, (Resource Conservation and Recovery Act (tracking hazardous waste)) Organizations: GIT N GO INC (CONTACT/OWNER)
, GIT N GO CONVENIENCE STORES (CONTACT/OWNER)
Alternative names: TRAVEL CENTERS OF THE OZARKS
ROADWAY EXPRESS (5575 EAST HIGHWAY 00 in STRAFFORD, MO)
STATE MASTER (Missouri monitoring and compilance) - PCS-MO0113476, NPDES NON-MAJOR, RCRAINFO-MOD030701197, LQG National Pollutant Discharge Elimination System NON-MAJOR (Tracking pollutant discharge elimination systems) - permit Conditionally Exempt Small Quantity Generators, less than 100 kg/month of hazardous waste (Resource Conservation and Recovery Act (tracking hazardous waste)) Business SIC classification: TRUCKING, EXCEPT LOCAL; TERMINAL AND JOINT TERMINAL MAINTENANCE FACILITIES FOR MOTOR FREIGHT TRANSPORTATION Organizations: ROADWAY EXPRESS INC (CONTACT/OPERATOR)
OVERNITE TRANSPORTATION (5401 EAST STATE HIGHWAY OO in STRAFFORD, MO)
STATE MASTER (Missouri monitoring and compilance) - RCRAINFO-MOR000021121, SQG, PCS-MOR401146, NPDES NON-MAJOR, PCS-MOR80C237, Small Quantity Generators, between 100 kg and 1000 kg of hazardous waste/month (Resource Conservation and Recovery Act (tracking hazardous waste)) - notification Business SIC classification: TERMINAL AND JOINT TERMINAL MAINTENANCE FACILITIES FOR MOTOR FREIGHT TRANSPORTATION; TRANSPORTATION SERVICES; GASOLINE SERVICE STATIONS Organizations: TRANSPORT DELIVERY INC (CONTACT/OWNER)
, OVERNITE TRANSPORATION CO (CONTACT/OWNER)
Alternative names: OVERNIGHT TRANSPORTATION
PETERBILT OF SPRINGFIELD (EVERGREEN in STRAFFORD, MO)
STATE MASTER (Missouri monitoring and compilance) - PCS-MOR105795, NPDES NON-MAJOR National Pollutant Discharge Elimination System NON-MAJOR (Tracking pollutant discharge elimination systems) - permit Business SIC classification: HEAVY CONSTRUCTION
CHURCHILL TRUCK LINES INC (SERVICE RD BTW HWY 00 AND I44 in STRAFFORD, MO)
STATE MASTER (Missouri monitoring and compilance) - RCRAINFO-MOD985806793, CESQG (Resource Conservation and Recovery Act (tracking hazardous waste)) Organizations: KENNETH CHURCHILL (CONTACT/OWNER)
EXOTIC ANIMAL PARADISE (124 JUNGLE DRIVE in STRAFFORD, MO)
STATE MASTER (Missouri monitoring and compilance) - PCS-MO0125849, NPDES NON-MAJOR National Pollutant Discharge Elimination System NON-MAJOR (Tracking pollutant discharge elimination systems) - permit Business SIC classification: AMUSEMENT AND RECREATION SERVICES; ARBORETA AND BOTANICAL OR ZOOLOGICAL GARDENS Organizations: OAK OAK INC (CONTACT/OWNER)
FIRE MASTER FIRE APPARATUS INC (HWY OO W OF WASHINGTON ST in STRAFFORD, MO)
STATE MASTER (Missouri monitoring and compilance) - RCRAINFO-MOD985796325, CESQG (Resource Conservation and Recovery Act (tracking hazardous waste)) Organizations: SHELTON GEROLD (CONTACT/OWNER)
GIT N GO #64 (125 S INTERCHANGE EXPWY in STRAFFORD, MO)
STATE MASTER (Missouri monitoring and compilance) - RCRAINFO-MOR000032763, SQG (Resource Conservation and Recovery Act (tracking hazardous waste)) Business SIC classification: GROCERY STORES Organizations: GIT N GO INC (CONTACT/OWNER)
GOFF FEED STORE (303 WASHINGTON AVE in STRAFFORD, MO)
STATE MASTER (Missouri monitoring and compilance) - RCRAINFO-MOP000025023, NOT IN A UNIVERSE (Resource Conservation and Recovery Act (tracking hazardous waste))
NORTHVIEW SMELTING & SCRAP (STRAFFORD in STRAFFORD, MO)
AIR MINOR (AIRS/AFS) STATE MASTER (Missouri monitoring and compilance) - AIRS/AFS-MO0887030, AIR MINOR
PETERBILT OF SPRINGFIELD INC (3026 N MULROY RD in STRAFFORD, MO)
STATE MASTER (Missouri monitoring and compilance) - RCRAINFO-MOR000504209, SQG Small Quantity Generators, between 100 kg and 1000 kg of hazardous waste/month (Resource Conservation and Recovery Act (tracking hazardous waste)) Organizations: GLENN LARSON (CONTACT/OWNER)
RLR INVESTMENTS LLC (5403 EAST STATE HWY OO in STRAFFORD, MO)
National Pollutant Discharge Elimination System NON-MAJOR (Tracking pollutant discharge elimination systems) - permit Business SIC classification: HEAVY CONSTRUCTION Alternative names: R & L CARRIERS
CHRISTONSON TRANSPORT (2001 W OLD ROUTE 66 in STRAFFORD, MO)
National Pollutant Discharge Elimination System NON-MAJOR (Tracking pollutant discharge elimination systems) - permit Business SIC classification: HEAVY CONSTRUCTION Organizations: J M & M INVESTMENTS (CONTACT/OWNER)
Alternative names: J M & M INVESTMENTS
Housing units lacking complete plumbing facilities: 0.4% Housing units lacking complete kitchen facilities: 0.4%
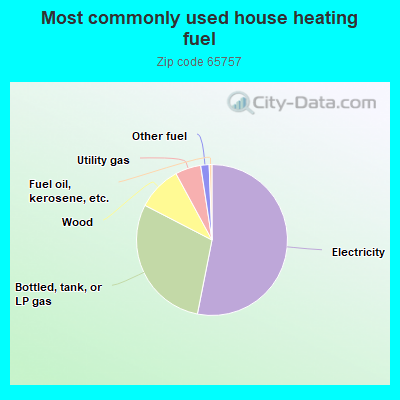
53.1%Electricity
29.5%Bottled, tank, or LP gas
9.5%Wood
5.5%Utility gas
1.8%Other fuel
0.6%Fuel oil, kerosene, etc.
Population in 1990: 3,226. Population change in the 1990s: +2,636 (+81.7%).
Place of birth for U.S.-born residents:
This state: 5,069
Northeast: 105
Midwest: 673
South: 638
West: 731
53% of the 65757 zip code residents lived in the same house 5 years ago. Out of people who lived in different houses, 56% lived in this county. Out of people who lived in different counties, 50% lived in Missouri.
94% of the 65757 zip code residents lived in the same house 1 year ago. Out of people who lived in different houses, 72% moved from this county. Out of people who lived in different houses, 25% moved from different county within same state. Out of people who lived in different houses, 3% moved from different state.
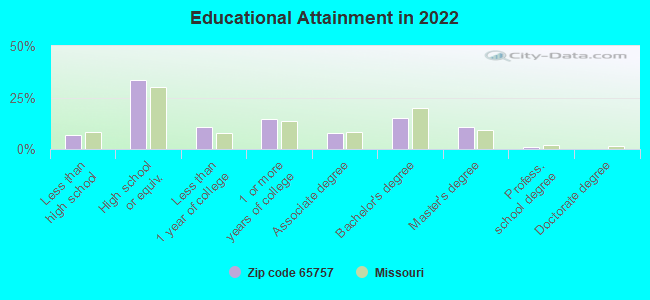
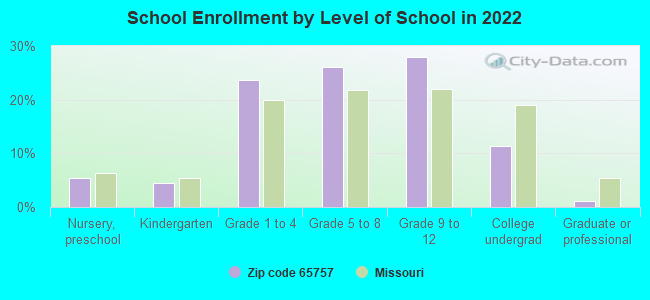
Private vs. public school enrollment:
Students in private schools in grades 1 to 8 (elementary and middle school): 33
Here:
3.9%
Missouri:
15.4%
Students in private schools in grades 9 to 12 (high school): 84
Here:
17.4%
Missouri:
13.9%
Students in private undergraduate colleges: 29
Here:
15.0%
Missouri:
22.6%
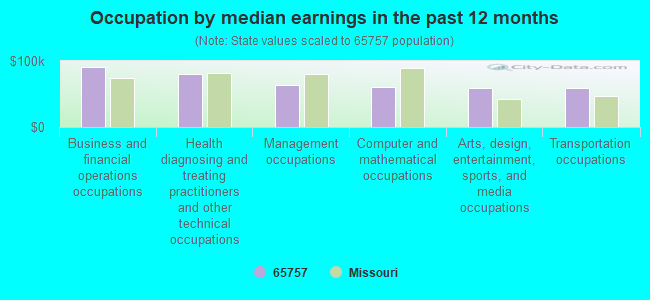
Occupation by median earnings in the past 12 months ($)
91,626Business and financial operations occupations
80,623Health diagnosing and treating practitioners and other technical occupations
63,963Management occupations
60,040Computer and mathematical occupations
59,785Arts, design, entertainment, sports, and media occupations
59,111Transportation occupations
Top industries in this zip code by the number of employees in 2005:
Wholesale Trade: Automobile and Other Motor Vehicle Merchant Wholesalers (100-249 employees: 1 establishment, 20-49 employees: 1 establishment)
Other Services (except Public Administration): Automotive Body, Paint, and Interior Repair and Maintenance (20-49: 1, 1-4: 2)
People in group quarters in 2010:
70 people in nursing facilities/skilled-nursing facilities
17 people in group homes for juveniles (non-correctional)
17 people in workers' group living quarters and job corps centers
People in group quarters in 2000:
56 people in nursing homes
21 people in homes or halfway houses for drug/alcohol abuse
Fatal accident statistics in 2014:
Fatal accident count: 1
Vehicles involved in fatal accidents: 2
Fatal accidents caused by drunken drivers: 1
Fatalities: 1
Persons involved in fatal accidents: 2
Pedestrians involved in fatal accidents: 0
Fatal accident statistics in 2013:
Fatal accident count: 2
Vehicles involved in fatal accidents: 3
Fatal accidents caused by drunken drivers: 0
Fatalities: 2
Persons involved in fatal accidents: 5
Pedestrians involved in fatal accidents: 1
Home Mortgage Disclosure Act Aggregated Statistics For Year 2009 (Based on 4 partial tracts)
A) FHA, FSA/RHS & VA Home Purchase Loans
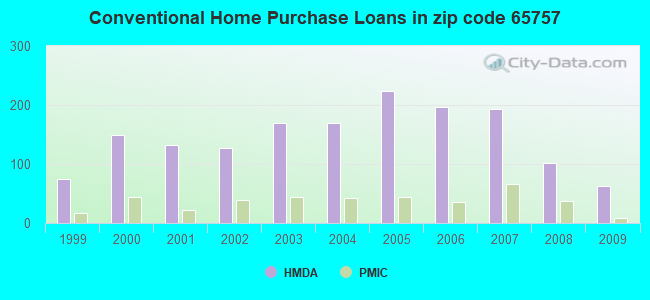
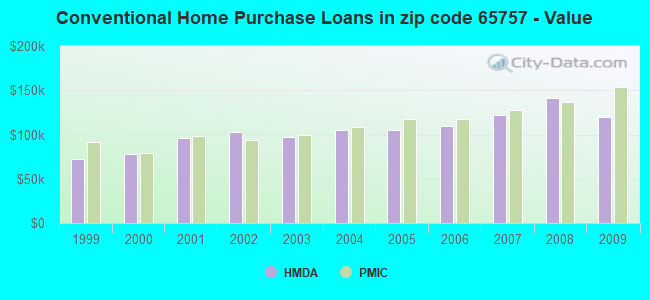
B) Conventional Home Purchase Loans
C) Refinancings
D) Home Improvement Loans
F) Non-occupant Loans on < 5 Family Dwellings (A B C & D)
G) Loans On Manufactured Home Dwelling (A B C & D)
Number
Average Value
Number
Average Value
Number
Average Value
Number
Average Value
Number
Average Value
Number
Average Value
LOANS ORIGINATED
48
$112,469
62
$119,309
305
$146,446
13
$25,765
24
$100,399
9
$21,942
APPLICATIONS APPROVED, NOT ACCEPTED
3
$114,097
2
$55,585
27
$144,061
2
$11,085
2
$44,040
1
$59,360
APPLICATIONS DENIED
14
$90,790
12
$79,786
113
$134,307
3
$16,493
3
$88,860
2
$86,765
APPLICATIONS WITHDRAWN
7
$165,634
10
$179,060
74
$143,335
3
$53,913
2
$49,840
1
$37,610
FILES CLOSED FOR INCOMPLETENESS
1
$136,660
1
$175,530
9
$114,770
0
$0
0
$0
0
$0
Aggregated Statistics For Year 2008 (Based on 4 partial tracts)
A) FHA, FSA/RHS & VA Home Purchase Loans
B) Conventional Home Purchase Loans
C) Refinancings
D) Home Improvement Loans
F) Non-occupant Loans on < 5 Family Dwellings (A B C & D)
G) Loans On Manufactured Home Dwelling (A B C & D)
Number
Average Value
Number
Average Value
Number
Average Value
Number
Average Value
Number
Average Value
Number
Average Value
LOANS ORIGINATED
42
$114,758
101
$141,002
249
$147,006
23
$46,524
37
$104,452
22
$55,154
APPLICATIONS APPROVED, NOT ACCEPTED
3
$88,183
7
$97,507
33
$146,237
3
$47,227
5
$118,304
2
$27,810
APPLICATIONS DENIED
8
$94,819
16
$121,279
151
$132,724
13
$102,456
7
$77,830
10
$66,201
APPLICATIONS WITHDRAWN
4
$99,342
8
$155,010
57
$133,908
8
$97,250
1
$81,500
4
$96,230
FILES CLOSED FOR INCOMPLETENESS
4
$116,918
0
$0
9
$138,341
0
$0
1
$190,620
0
$0
Aggregated Statistics For Year 2007 (Based on 4 partial tracts)
A) FHA, FSA/RHS & VA Home Purchase Loans
B) Conventional Home Purchase Loans
C) Refinancings
D) Home Improvement Loans
F) Non-occupant Loans on < 5 Family Dwellings (A B C & D)
G) Loans On Manufactured Home Dwelling (A B C & D)
Number
Average Value
Number
Average Value
Number
Average Value
Number
Average Value
Number
Average Value
Number
Average Value
LOANS ORIGINATED
37
$117,446
193
$122,294
239
$138,437
35
$31,112
39
$100,457
18
$54,666
APPLICATIONS APPROVED, NOT ACCEPTED
2
$71,190
10
$138,931
40
$161,638
9
$54,891
0
$0
4
$91,215
APPLICATIONS DENIED
3
$137,753
36
$100,999
185
$136,824
36
$54,940
5
$51,930
14
$86,154
APPLICATIONS WITHDRAWN
3
$122,453
23
$140,844
69
$150,861
10
$57,912
3
$110,680
4
$104,065
FILES CLOSED FOR INCOMPLETENESS
0
$0
5
$105,908
18
$158,376
0
$0
0
$0
0
$0
Aggregated Statistics For Year 2006 (Based on 4 partial tracts)
A) FHA, FSA/RHS & VA Home Purchase Loans
B) Conventional Home Purchase Loans
C) Refinancings
D) Home Improvement Loans
E) Loans on Dwellings For 5+ Families
F) Non-occupant Loans on < 5 Family Dwellings (A B C & D)
G) Loans On Manufactured Home Dwelling (A B C & D)
Number
Average Value
Number
Average Value
Number
Average Value
Number
Average Value
Number
Average Value
Number
Average Value
Number
Average Value
LOANS ORIGINATED
31
$98,121
197
$109,129
255
$128,217
44
$36,785
3
$236,133
46
$80,935
23
$45,862
APPLICATIONS APPROVED, NOT ACCEPTED
1
$87,770
36
$98,091
44
$113,574
3
$34,313
0
$0
1
$54,090
8
$49,211
APPLICATIONS DENIED
5
$108,154
74
$102,482
173
$122,181
26
$64,623
0
$0
9
$88,538
26
$80,061
APPLICATIONS WITHDRAWN
3
$124,817
29
$102,845
85
$116,210
11
$82,574
0
$0
3
$69,377
5
$70,038
FILES CLOSED FOR INCOMPLETENESS
0
$0
10
$114,658
26
$113,004
0
$0
0
$0
0
$0
0
$0
Aggregated Statistics For Year 2005 (Based on 4 partial tracts)
A) FHA, FSA/RHS & VA Home Purchase Loans
B) Conventional Home Purchase Loans
C) Refinancings
D) Home Improvement Loans
E) Loans on Dwellings For 5+ Families
F) Non-occupant Loans on < 5 Family Dwellings (A B C & D)
G) Loans On Manufactured Home Dwelling (A B C & D)
Number
Average Value
Number
Average Value
Number
Average Value
Number
Average Value
Number
Average Value
Number
Average Value
Number
Average Value
LOANS ORIGINATED
23
$102,073
224
$104,767
251
$119,071
44
$40,396
1
$626,900
59
$82,172
15
$50,560
APPLICATIONS APPROVED, NOT ACCEPTED
1
$176,790
20
$75,921
37
$119,349
5
$15,548
0
$0
6
$94,787
8
$62,944
APPLICATIONS DENIED
6
$143,978
62
$83,227
218
$107,551
29
$38,600
0
$0
14
$80,361
37
$53,162
APPLICATIONS WITHDRAWN
3
$76,483
23
$108,067
100
$121,167
13
$140,168
0
$0
5
$83,932
3
$62,817
FILES CLOSED FOR INCOMPLETENESS
0
$0
5
$126,196
21
$127,248
0
$0
0
$0
0
$0
0
$0
Aggregated Statistics For Year 2004 (Based on 4 partial tracts)
A) FHA, FSA/RHS & VA Home Purchase Loans
B) Conventional Home Purchase Loans
C) Refinancings
D) Home Improvement Loans
E) Loans on Dwellings For 5+ Families
F) Non-occupant Loans on < 5 Family Dwellings (A B C & D)
G) Loans On Manufactured Home Dwelling (A B C & D)
Number
Average Value
Number
Average Value
Number
Average Value
Number
Average Value
Number
Average Value
Number
Average Value
Number
Average Value
LOANS ORIGINATED
39
$98,536
170
$104,548
334
$112,183
21
$44,236
1
$413,750
39
$86,039
12
$69,578
APPLICATIONS APPROVED, NOT ACCEPTED
3
$61,017
16
$71,701
45
$133,130
3
$25,913
0
$0
6
$123,425
8
$54,792
APPLICATIONS DENIED
7
$108,929
41
$77,007
181
$105,750
18
$25,756
0
$0
2
$49,520
29
$67,551
APPLICATIONS WITHDRAWN
3
$78,040
17
$89,418
99
$94,943
5
$57,568
0
$0
3
$120,897
4
$67,605
FILES CLOSED FOR INCOMPLETENESS
0
$0
0
$0
10
$100,284
0
$0
0
$0
0
$0
0
$0
Aggregated Statistics For Year 2003 (Based on 4 partial tracts)
A) FHA, FSA/RHS & VA Home Purchase Loans
B) Conventional Home Purchase Loans
C) Refinancings
D) Home Improvement Loans
E) Loans on Dwellings For 5+ Families
F) Non-occupant Loans on < 5 Family Dwellings (A B C & D)
Number
Average Value
Number
Average Value
Number
Average Value
Number
Average Value
Number
Average Value
Number
Average Value
LOANS ORIGINATED
43
$103,274
170
$96,881
663
$111,092
15
$20,443
1
$789,890
62
$86,762
APPLICATIONS APPROVED, NOT ACCEPTED
2
$83,255
17
$98,739
51
$118,898
3
$64,557
0
$0
0
$0
APPLICATIONS DENIED
7
$75,006
54
$70,791
171
$107,715
19
$19,814
0
$0
4
$93,192
APPLICATIONS WITHDRAWN
2
$108,905
32
$92,068
120
$110,268
4
$7,570
0
$0
4
$69,895
FILES CLOSED FOR INCOMPLETENESS
2
$63,405
3
$92,363
18
$131,096
0
$0
0
$0
0
$0
Aggregated Statistics For Year 2002 (Based on 4 partial tracts)
A) FHA, FSA/RHS & VA Home Purchase Loans
B) Conventional Home Purchase Loans
C) Refinancings
D) Home Improvement Loans
F) Non-occupant Loans on < 5 Family Dwellings (A B C & D)
Number
Average Value
Number
Average Value
Number
Average Value
Number
Average Value
Number
Average Value
LOANS ORIGINATED
34
$88,064
127
$102,873
410
$105,616
22
$24,312
31
$87,898
APPLICATIONS APPROVED, NOT ACCEPTED
1
$92,780
10
$73,181
50
$101,172
4
$19,778
1
$37,600
APPLICATIONS DENIED
4
$73,348
35
$74,282
144
$107,288
11
$21,973
6
$161,218
APPLICATIONS WITHDRAWN
2
$66,115
13
$96,447
111
$102,336
7
$94,891
3
$46,257
FILES CLOSED FOR INCOMPLETENESS
0
$0
4
$162,368
25
$96,733
0
$0
0
$0
Aggregated Statistics For Year 2001 (Based on 4 partial tracts)
A) FHA, FSA/RHS & VA Home Purchase Loans
B) Conventional Home Purchase Loans
C) Refinancings
D) Home Improvement Loans
F) Non-occupant Loans on < 5 Family Dwellings (A B C & D)
Number
Average Value
Number
Average Value
Number
Average Value
Number
Average Value
Number
Average Value
LOANS ORIGINATED
51
$87,539
133
$96,410
426
$104,194
30
$24,915
29
$82,817
APPLICATIONS APPROVED, NOT ACCEPTED
0
$0
16
$68,883
37
$95,168
4
$8,975
0
$0
APPLICATIONS DENIED
9
$77,170
37
$59,981
128
$79,474
18
$8,846
5
$48,648
APPLICATIONS WITHDRAWN
3
$93,200
14
$79,360
85
$75,904
4
$7,192
1
$55,170
FILES CLOSED FOR INCOMPLETENESS
0
$0
0
$0
12
$113,410
0
$0
0
$0
Aggregated Statistics For Year 2000 (Based on 4 partial tracts)
A) FHA, FSA/RHS & VA Home Purchase Loans
B) Conventional Home Purchase Loans
C) Refinancings
D) Home Improvement Loans
E) Loans on Dwellings For 5+ Families
F) Non-occupant Loans on < 5 Family Dwellings (A B C & D)
Number
Average Value
Number
Average Value
Number
Average Value
Number
Average Value
Number
Average Value
Number
Average Value
LOANS ORIGINATED
37
$81,182
150
$77,830
161
$82,114
37
$27,816
1
$341,030
31
$54,209
APPLICATIONS APPROVED, NOT ACCEPTED
5
$54,546
24
$57,259
54
$67,314
5
$20,470
0
$0
3
$70,630
APPLICATIONS DENIED
6
$48,898
83
$53,345
127
$76,051
12
$16,536
0
$0
3
$59,763
APPLICATIONS WITHDRAWN
5
$87,014
24
$89,358
56
$71,103
0
$0
0
$0
3
$35,567
FILES CLOSED FOR INCOMPLETENESS
0
$0
11
$114,266
10
$68,092
0
$0
0
$0
0
$0
Aggregated Statistics For Year 1999 (Based on 2 partial tracts)
A) FHA, FSA/RHS & VA Home Purchase Loans
B) Conventional Home Purchase Loans
C) Refinancings
D) Home Improvement Loans
F) Non-occupant Loans on < 5 Family Dwellings (A B C & D)
Detailed PMIC statistics for the following Tracts:0046.00
, 0047.00
2002 - 2018 National Fire Incident Reporting System (NFIRS) incidents
Based on the data from the years 2002 - 2018 the average number of fires per year is 69. The highest number of reported fire incidents - 117 took place in 2014, and the least - 20 in 2010. The data has a rising trend.
When looking into fire subcategories, the most reports belonged to: Outside Fires (47.6%), and Structure Fires (39.4%).
Fire incident types reported to NFIRS in Zip Code 65757

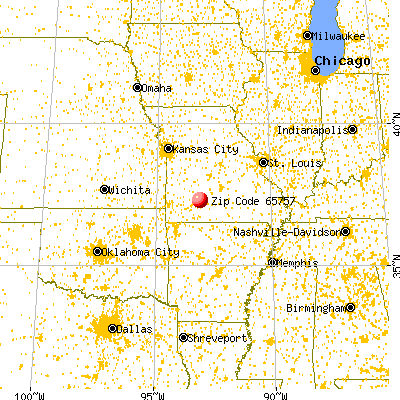


 Nearest zip codes: 65809, 65648, 65742, 65803, 65804, 65706.
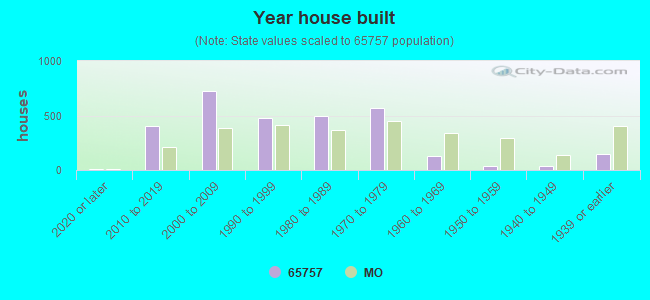


 Based on the data from the years 2002 - 2018 the average number of fires per year is 69. The highest number of reported fire incidents - 117 took place in 2014, and the least - 20 in 2010. The data has a rising trend.
 When looking into fire subcategories, the most reports belonged to: Outside Fires (47.6%), and Structure Fires (39.4%).