Races in St. John, Indiana (IN) Detailed Stats
Data:
Races - White alone (%)
Races - White alone (% change since 2000)
Races - Black alone (%)
Races - Black alone (% change since 2000)
Races - American Indian alone (%)
Races - American Indian alone (% change since 2000)
Races - Asian alone (%)
Races - Asian alone (% change since 2000)
Races - Hispanic (%)
Races - Hispanic (% change since 2000)
Races - Native Hawaiian and Other Pacific Islander alone (%)
Races - Native Hawaiian and Other Pacific Islander alone (% change since 2000)
Races - Two or more races(%)
Races - Two or more races(% change since 2000)
Races - Other race alone (%)
Races - Other race alone (% change since 2000)
Racial diversity
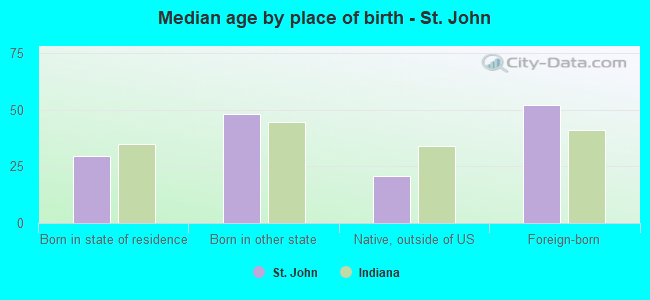
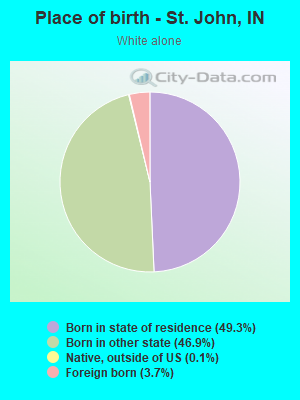
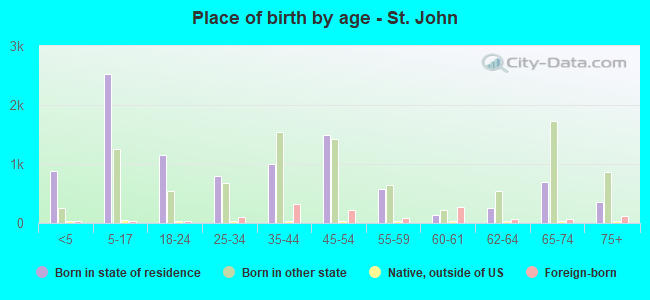
Place of birth - Born in state of residence (%)
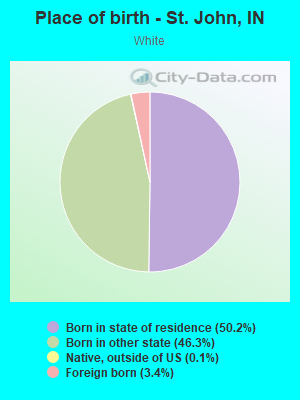
Place of birth - Born in state of residence (%) - White
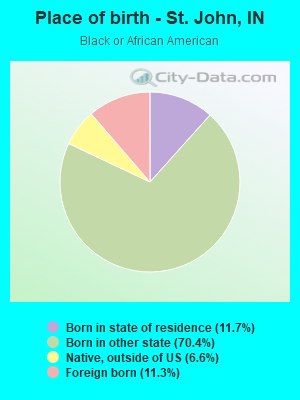
Place of birth - Born in state of residence (%) - Black or African American
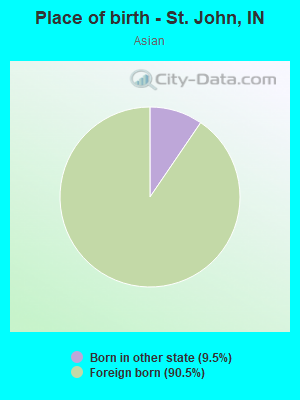
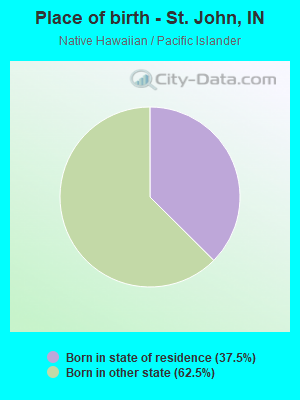
Place of birth - Born in state of residence (%) - Asian
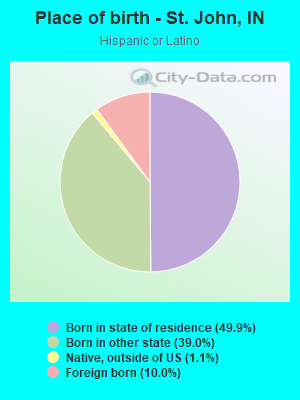
Place of birth - Born in state of residence (%) - Hispanic or Latino
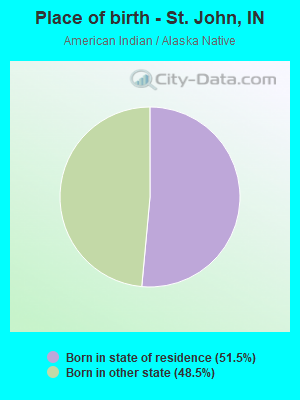
Place of birth - Born in state of residence (%) - American Indian and Alaska Native
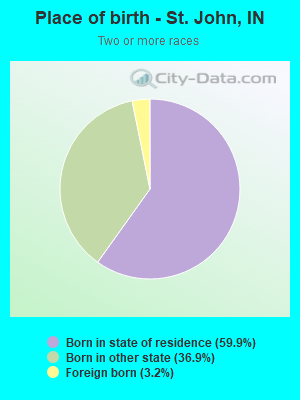
Place of birth - Born in state of residence (%) - Multirace
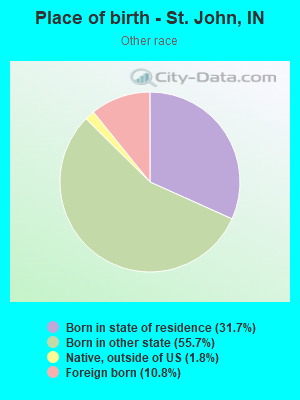
Place of birth - Born in state of residence (%) - Other Race
Place of birth - Born in other state (%)
Place of birth - Born in other state (%) - White
Place of birth - Born in other state (%) - Black or African American
Place of birth - Born in other state (%) - Asian
Place of birth - Born in other state (%) - Hispanic or Latino
Place of birth - Born in other state (%) - American Indian and Alaska Native
Place of birth - Born in other state (%) - Multirace
Place of birth - Born in other state (%) - Other Race
Place of birth - Native, outside of US (%)
Place of birth - Native, outside of US (%) - White
Place of birth - Native, outside of US (%) - Black or African American
Place of birth - Native, outside of US (%) - Asian
Place of birth - Native, outside of US (%) - Hispanic or Latino
Place of birth - Native, outside of US (%) - American Indian and Alaska Native
Place of birth - Native, outside of US (%) - Multirace
Place of birth - Native, outside of US (%) - Other Race
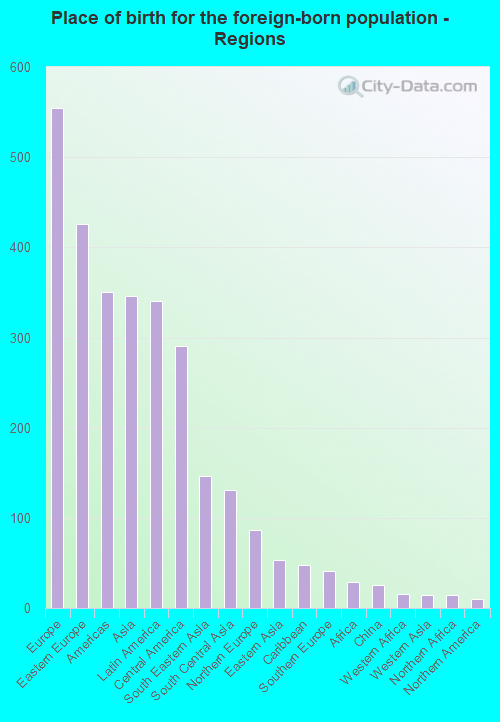
Place of birth - Foreign born (%)
Place of birth - Foreign born (%) - White
Place of birth - Foreign born (%) - Black or African American
Place of birth - Foreign born (%) - Asian
Place of birth - Foreign born (%) - Hispanic or Latino
Place of birth - Foreign born (%) - American Indian and Alaska Native
Place of birth - Foreign born (%) - Multirace
Place of birth - Foreign born (%) - Other Race
Residents speaking English at home (%)
Residents speaking English at home - Born in the United States (%)
Residents speaking English at home - Native, born elsewhere (%)
Residents speaking English at home - Foreign born (%)
Residents speaking Spanish at home (%)
Residents speaking Spanish at home - Born in the United States (%)
Residents speaking Spanish at home - Native, born elsewhere (%)
Residents speaking Spanish at home - Foreign born (%)
Residents speaking other language at home (%)
Residents speaking other language at home - Born in the United States (%)
Residents speaking other language at home - Native, born elsewhere (%)
Residents speaking other language at home - Foreign born (%)
Marital status - Never married (%)
Marital status - Now married (%)
Marital status - Separated (%)
Marital status - Widowed (%)
Marital status - Divorced (%)
Ancestries Reported - Arab (%)
Ancestries Reported - Czech (%)
Ancestries Reported - Danish (%)
Ancestries Reported - Dutch (%)
Ancestries Reported - English (%)
Ancestries Reported - French (%)
Ancestries Reported - French Canadian (%)
Ancestries Reported - German (%)
Ancestries Reported - Greek (%)
Ancestries Reported - Hungarian (%)
Ancestries Reported - Irish (%)
Ancestries Reported - Italian (%)
Ancestries Reported - Lithuanian (%)
Ancestries Reported - Norwegian (%)
Ancestries Reported - Polish (%)
Ancestries Reported - Portuguese (%)
Ancestries Reported - Russian (%)
Ancestries Reported - Scotch-Irish (%)
Ancestries Reported - Scottish (%)
Ancestries Reported - Slovak (%)
Ancestries Reported - Subsaharan African (%)
Ancestries Reported - Swedish (%)
Ancestries Reported - Swiss (%)
Ancestries Reported - Ukrainian (%)
Ancestries Reported - United States (%)
Ancestries Reported - Welsh (%)
Ancestries Reported - West Indian (%)
Ancestries Reported - Other (%)
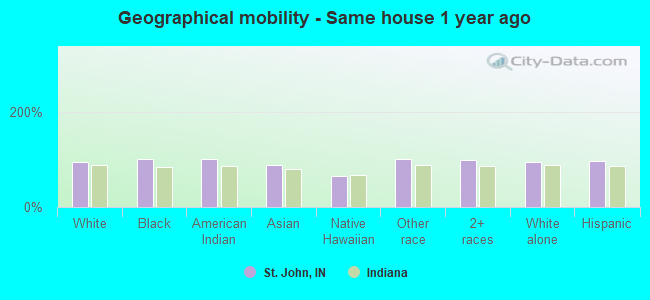
Geographical mobility - Same house 1 year ago (%)
Geographical mobility - Same house 1 year ago (%) - White
Geographical mobility - Same house 1 year ago (%) - Black or African American
Geographical mobility - Same house 1 year ago (%) - Asian
Geographical mobility - Same house 1 year ago (%) - Hispanic or Latino
Geographical mobility - Same house 1 year ago (%) - American Indian and Alaska Native
Geographical mobility - Same house 1 year ago (%) - Multirace
Geographical mobility - Same house 1 year ago (%) - Other Race
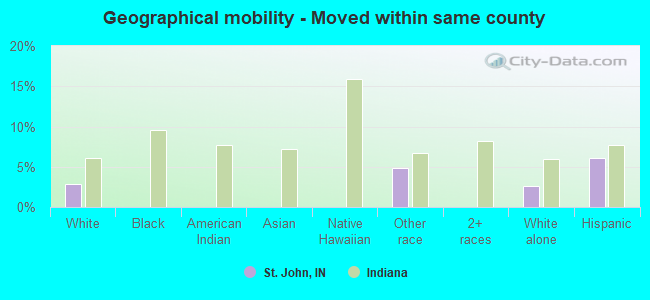
Geographical mobility - Moved within same county (%)
Geographical mobility - Moved within same county (%) - White
Geographical mobility - Moved within same county (%) - Black or African American
Geographical mobility - Moved within same county (%) - Asian
Geographical mobility - Moved within same county (%) - Hispanic or Latino
Geographical mobility - Moved within same county (%) - American Indian and Alaska Native
Geographical mobility - Moved within same county (%) - Multirace
Geographical mobility - Moved within same county (%) - Other Race
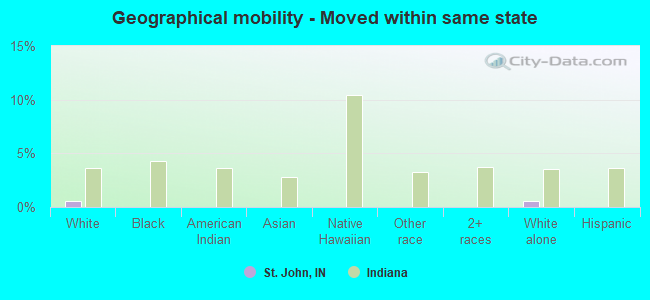
Geographical mobility - Moved from different county within same state (%)
Geographical mobility - Moved from different county within same state (%) - White
Geographical mobility - Moved from different county within same state (%) - Black or African American
Geographical mobility - Moved from different county within same state (%) - Asian
Geographical mobility - Moved from different county within same state (%) - Hispanic or Latino
Geographical mobility - Moved from different county within same state (%) - American Indian and Alaska Native
Geographical mobility - Moved from different county within same state (%) - Multirace
Geographical mobility - Moved from different county within same state (%) - Other Race
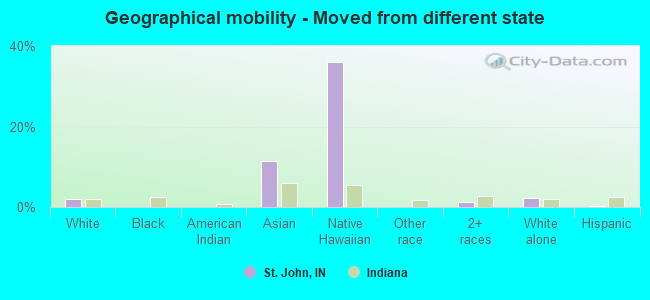
Geographical mobility - Moved from different state (%)
Geographical mobility - Moved from different state (%) - White
Geographical mobility - Moved from different state (%) - Black or African American
Geographical mobility - Moved from different state (%) - Asian
Geographical mobility - Moved from different state (%) - Hispanic or Latino
Geographical mobility - Moved from different state (%) - American Indian and Alaska Native
Geographical mobility - Moved from different state (%) - Multirace
Geographical mobility - Moved from different state (%) - Other Race
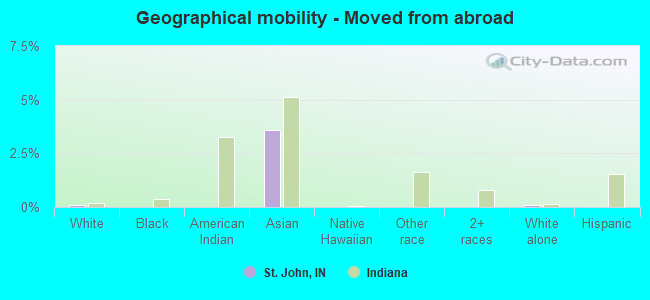
Geographical mobility - Moved from abroad (%)
Geographical mobility - Moved from abroad (%) - White
Geographical mobility - Moved from abroad (%) - Black or African American
Geographical mobility - Moved from abroad (%) - Asian
Geographical mobility - Moved from abroad (%) - Hispanic or Latino
Geographical mobility - Moved from abroad (%) - American Indian and Alaska Native
Geographical mobility - Moved from abroad (%) - Multirace
Geographical mobility - Moved from abroad (%) - Other Race
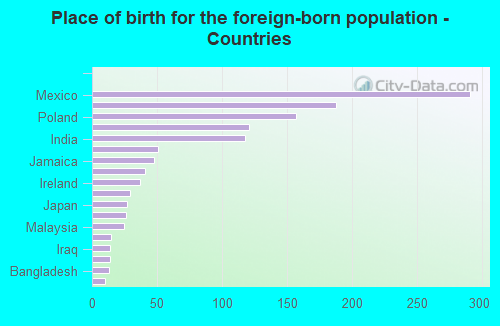
Place of birth for the foreign-born population - Ireland (%)
Place of birth for the foreign-born population - Denmark (%)
Place of birth for the foreign-born population - Norway (%)
Place of birth for the foreign-born population - Sweden (%)
Place of birth for the foreign-born population - United Kingdom (%)
Place of birth for the foreign-born population - England (%)
Place of birth for the foreign-born population - Scotland (%)
Place of birth for the foreign-born population - Other Northern Europe (%)
Place of birth for the foreign-born population - Austria (%)
Place of birth for the foreign-born population - Belgium (%)
Place of birth for the foreign-born population - France (%)
Place of birth for the foreign-born population - Germany (%)
Place of birth for the foreign-born population - Netherlands (%)
Place of birth for the foreign-born population - Switzerland (%)
Place of birth for the foreign-born population - Other Western Europe (%)
Place of birth for the foreign-born population - Greece (%)
Place of birth for the foreign-born population - Italy (%)
Place of birth for the foreign-born population - Portugal (%)
Place of birth for the foreign-born population - Spain (%)
Place of birth for the foreign-born population - Other Southern Europe (%)
Place of birth for the foreign-born population - Albania (%)
Place of birth for the foreign-born population - Belarus (%)
Place of birth for the foreign-born population - Bosnia and Herzegovina (%)
Place of birth for the foreign-born population - Bulgaria (%)
Place of birth for the foreign-born population - Croatia (%)
Place of birth for the foreign-born population - Czechoslovakia (%)
Place of birth for the foreign-born population - Hungary (%)
Place of birth for the foreign-born population - Latvia (%)
Place of birth for the foreign-born population - Lithuania (%)
Place of birth for the foreign-born population - North Macedonia (Macedonia) (%)
Place of birth for the foreign-born population - Moldova (%)
Place of birth for the foreign-born population - Poland (%)
Place of birth for the foreign-born population - Romania (%)
Place of birth for the foreign-born population - Russia (%)
Place of birth for the foreign-born population - Serbia (%)
Place of birth for the foreign-born population - Ukraine (%)
Place of birth for the foreign-born population - Other Eastern Europe (%)
Place of birth for the foreign-born population - China (%)
Place of birth for the foreign-born population - Hong Kong (%)
Place of birth for the foreign-born population - Taiwan (%)
Place of birth for the foreign-born population - Japan (%)
Place of birth for the foreign-born population - Korea (%)
Place of birth for the foreign-born population - Other Eastern Asia (%)
Place of birth for the foreign-born population - Afghanistan (%)
Place of birth for the foreign-born population - Bangladesh (%)
Place of birth for the foreign-born population - India (%)
Place of birth for the foreign-born population - Iran (%)
Place of birth for the foreign-born population - Kazakhstan (%)
Place of birth for the foreign-born population - Nepal (%)
Place of birth for the foreign-born population - Pakistan (%)
Place of birth for the foreign-born population - Sri Lanka (%)
Place of birth for the foreign-born population - Uzbekistan (%)
Place of birth for the foreign-born population - Other South Central Asia (%)
Place of birth for the foreign-born population - Burma (%)
Place of birth for the foreign-born population - Cambodia (%)
Place of birth for the foreign-born population - Indonesia (%)
Place of birth for the foreign-born population - Laos (%)
Place of birth for the foreign-born population - Malaysia (%)
Place of birth for the foreign-born population - Philippines (%)
Place of birth for the foreign-born population - Singapore (%)
Place of birth for the foreign-born population - Thailand (%)
Place of birth for the foreign-born population - Vietnam (%)
Place of birth for the foreign-born population - Other South Eastern Asia (%)
Place of birth for the foreign-born population - Armenia (%)
Place of birth for the foreign-born population - Iraq (%)
Place of birth for the foreign-born population - Israel (%)
Place of birth for the foreign-born population - Jordan (%)
Place of birth for the foreign-born population - Kuwait (%)
Place of birth for the foreign-born population - Lebanon (%)
Place of birth for the foreign-born population - Saudi Arabia (%)
Place of birth for the foreign-born population - Syria (%)
Place of birth for the foreign-born population - Turkey (%)
Place of birth for the foreign-born population - Yemen (%)
Place of birth for the foreign-born population - Other Western Asia (%)
Place of birth for the foreign-born population - Eritrea (%)
Place of birth for the foreign-born population - Ethiopia (%)
Place of birth for the foreign-born population - Kenya (%)
Place of birth for the foreign-born population - Somalia (%)
Place of birth for the foreign-born population - Uganda (%)
Place of birth for the foreign-born population - Zimbabwe (%)
Place of birth for the foreign-born population - Other Eastern Africa (%)
Place of birth for the foreign-born population - Cameroon (%)
Place of birth for the foreign-born population - Congo (%)
Place of birth for the foreign-born population - Democratic Republic of Congo (Zaire) (%)
Place of birth for the foreign-born population - Other Middle Africa (%)
Place of birth for the foreign-born population - Egypt (%)
Place of birth for the foreign-born population - Morocco (%)
Place of birth for the foreign-born population - Sudan (%)
Place of birth for the foreign-born population - Other Northern Africa (%)
Place of birth for the foreign-born population - South Africa (%)
Place of birth for the foreign-born population - Other Southern Africa (%)
Place of birth for the foreign-born population - Cabo Verde (%)
Place of birth for the foreign-born population - Ghana (%)
Place of birth for the foreign-born population - Liberia (%)
Place of birth for the foreign-born population - Nigeria (%)
Place of birth for the foreign-born population - Senegal (%)
Place of birth for the foreign-born population - Sierra Leone (%)
Place of birth for the foreign-born population - Other Western Africa (%)
Place of birth for the foreign-born population - Australia (%)
Place of birth for the foreign-born population - New Zealand (%)
Place of birth for the foreign-born population - Fiji (%)
Place of birth for the foreign-born population - Micronesia (%)
Place of birth for the foreign-born population - Bahamas (%)
Place of birth for the foreign-born population - Barbados (%)
Place of birth for the foreign-born population - Cuba (%)
Place of birth for the foreign-born population - Dominica (%)
Place of birth for the foreign-born population - Dominican Republic (%)
Place of birth for the foreign-born population - Grenada (%)
Place of birth for the foreign-born population - Haiti (%)
Place of birth for the foreign-born population - Jamaica (%)
Place of birth for the foreign-born population - St. Vincent and the Grenadines (%)
Place of birth for the foreign-born population - Trinidad and Tobago (%)
Place of birth for the foreign-born population - West Indies (%)
Place of birth for the foreign-born population - Other Caribbean (%)
Place of birth for the foreign-born population - Belize (%)
Place of birth for the foreign-born population - Costa Rica (%)
Place of birth for the foreign-born population - El Salvador (%)
Place of birth for the foreign-born population - Guatemala (%)
Place of birth for the foreign-born population - Honduras (%)
Place of birth for the foreign-born population - Mexico (%)
Place of birth for the foreign-born population - Nicaragua (%)
Place of birth for the foreign-born population - Panama (%)
Place of birth for the foreign-born population - Other Central America (%)
Place of birth for the foreign-born population - Argentina (%)
Place of birth for the foreign-born population - Bolivia (%)
Place of birth for the foreign-born population - Brazil (%)
Place of birth for the foreign-born population - Chile (%)
Place of birth for the foreign-born population - Colombia (%)
Place of birth for the foreign-born population - Ecuador (%)
Place of birth for the foreign-born population - Guyana (%)
Place of birth for the foreign-born population - Peru (%)
Place of birth for the foreign-born population - Uruguay (%)
Place of birth for the foreign-born population - Venezuela (%)
Place of birth for the foreign-born population - Other South America (%)
Place of birth for the foreign-born population - Canada (%)
Place of birth for the foreign-born population - Other Northern America (%)
Place of birth for the foreign-born population - Other (%)
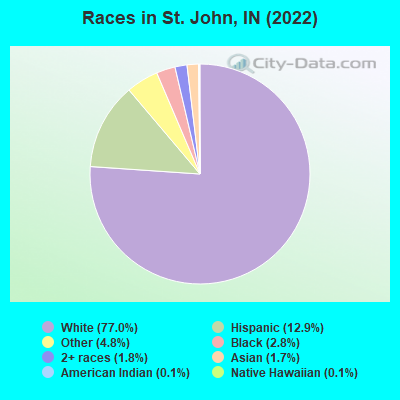
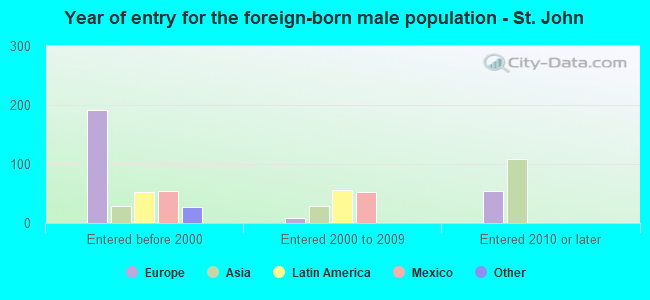
According to 2022 data, the most numerous races in St. John, IN are White alone (16,019 residents), Black alone (581 residents), and Hispanic (2,680 residents). 88.2% of St. John residents speak English at home. 6.2% of St. John, IN residents are foreign-born (2.4% born in Europe, 1.5% born in Asia, 1.5% born in Latin America), which is 2.6% greater than the foreign-born rate of 6.0% across the entire state of Indiana.
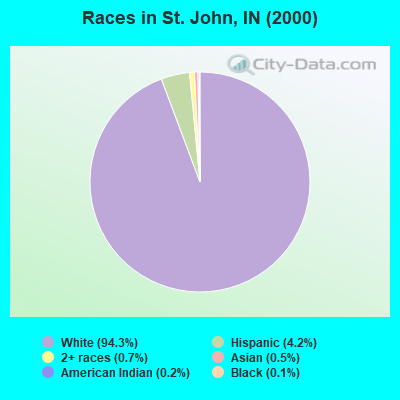
Race distribution in St. John
2000 2022
5,219,373 85.8% White alone 505,462 8.3% Black alone 214,536 3.5% Hispanic 61,115 1.0% Two or more races 58,424 1.0% Asian alone 13,654 0.2% American Indian alone 6,348 0.1% Other race alone 1,573 0.03% Native Hawaiian and Other
5,192,455 76.0% White alone 628,054 9.2% Black alone 534,528 7.8% Hispanic 263,242 3.9% Two or more races 172,880 2.5% Asian alone 33,467 0.5% Other race alone 5,866 0.09% American Indian alone 2,545 0.04% Native Hawaiian and Other
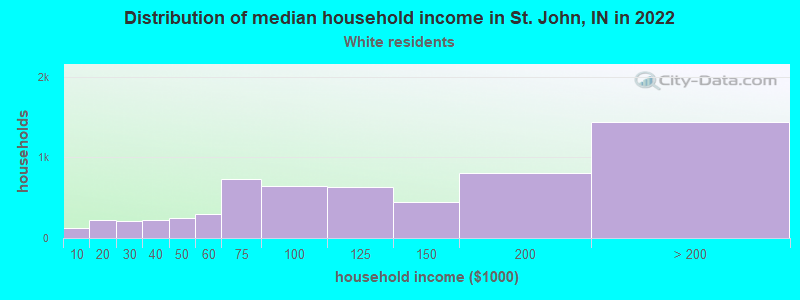
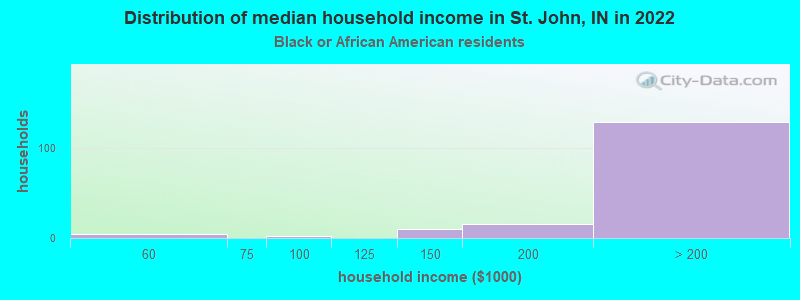
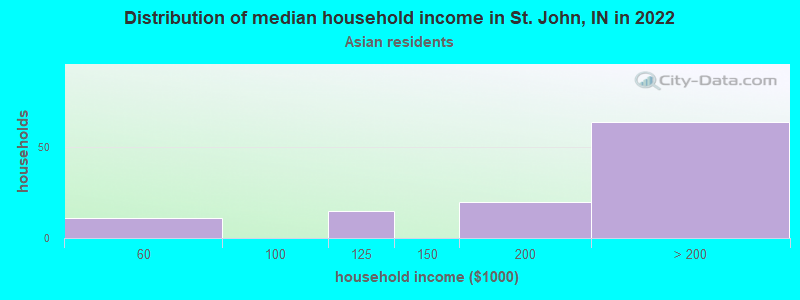
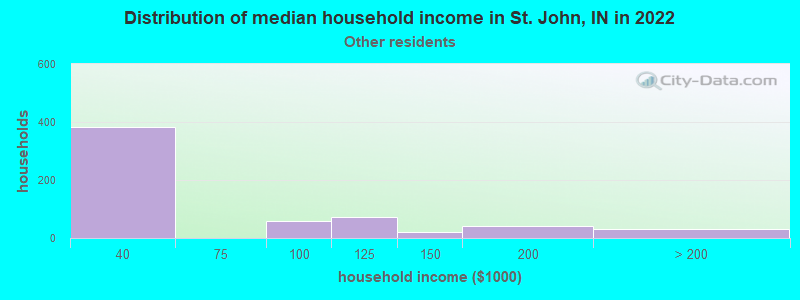
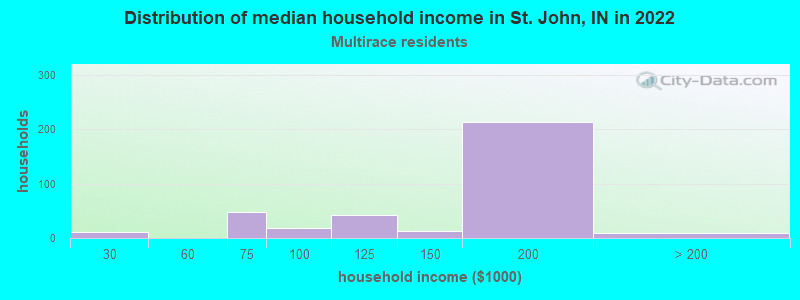
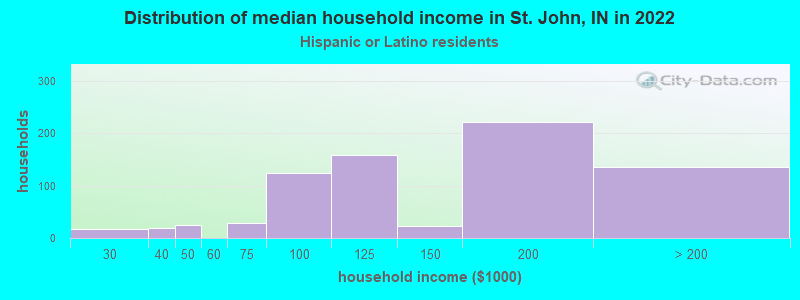
Income and house value in St. John Median household income in 2022 $114,757 White non-Hispanic householdersover $200,000 Black householders$194,403 Asian householders$167,156 Two or more races householders$132,204 Hispanic or Latino race householdersMedian 2022 house value $403,463 White Non-Hispanic householders$199,039 American Indian or Alaska Native householders $819,572 Asian householders$335,322 Two or more races householders$413,532 Hispanic or Latino householders
Median age by race in St. John
44.1 Median age for White residents42.6 45.4 46.5 Median age for Black or African American residents48.9 44.5 7.8 Median age for American Indian / Alaska Native residents-531,041,069.2 7.6 41.4 Median age for Asian residents43.9 37.7 -664,335,663.7 Median age for Native Hawaiian / Pacific Islander residents-644,025,156.6 -664,437,011.6 52.4 Median age for Other race residents64.6 44.5 22.1 Median age for Two or more races residents22.2 19.9 44.8 Median age for White alone residents43.0 48.2 30.9 Median age for Hispanic or Latino residents31.5 27.9
Owner/renter occupied households by race in St. John
House owners and renters - White residents 6,043 97.1% Owner occupied180 2.9% Renter occupiedHouse owners and renters - Black or African American residents 159 100.0% Owner occupiedHouse owners and renters - Asian residents 99 100.0% Owner occupiedHouse owners and renters - Other race residents 457 100.0% Owner occupiedHouse owners and renters - Two or more races residents 385 100.0% Owner occupiedHouse owners and renters - White alone residents 5,931 97.4% Owner occupied158 2.6% Renter occupiedHouse owners and renters - Hispanic or Latino residents 749 95.9% Owner occupied32 4.1% Renter occupied
Language usage in St. John
English speakers - Total 88.2% of residents of St. John speak English at home.
5.1% of residents speak Spanish at home 872 86.8% Speak English very well133 13.2% Speak English less than very well6.6% of residents speak other language at home 1,067 82.6% Speak English very well224 17.4% Speak English less than very well
English speakers - Born in the United States 93.4% of residents of St. John speak English at home.
4.3% of residents speak Spanish at home 408 100.0% Speak English very well1.9% of residents speak other language at home 170 94.4% Speak English very well10 5.6% Speak English less than very well
English speakers - Native, born elsewhere 47.8% of residents of St. John speak English at home.
53.6% of residents speak Spanish at home 37 100.0% Speak English very well
English speakers - Foreign-born 17.3% of residents of St. John speak English at home.
23.1% of residents speak Spanish at home 199 69.8% Speak English very well86 30.2% Speak English less than very well62.2% of residents speak other language at home 590 76.9% Speak English very well177 23.1% Speak English less than very well
White (Caucasian) - Speak only English Native:
96.0% (14,706)Foreign-born:
9.5% (53)
White (Caucasian) - Speak another language Native:
4.1% (621)Foreign-born:
92.5% (513)
Black or African American - Speak only English Native:
99.6% (518)Foreign-born:
100.0% (74)
Asian - Speak only English Native:
57.3% (13)Foreign-born:
34.9% (113)
Asian - Speak another language Native:
41.9% (10)Foreign-born:
68.1% (221)
Other race - Speak another language Native:
15.1% (143)Foreign-born:
97.6% (120)
Two or more races - Speak another language Native:
31.6% (320)Foreign-born:
100.0% (41)
White alone - Speak only English Native:
96.5% (14,273)Foreign-born:
8.8% (51)
White alone - Speak another language Native:
3.3% (495)Foreign-born:
99.3% (572)
Hispanic or Latino - Speak another language Native:
31.8% (681)Foreign-born:
99.9% (272)
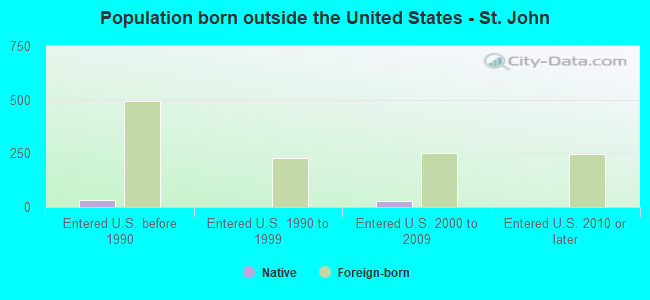
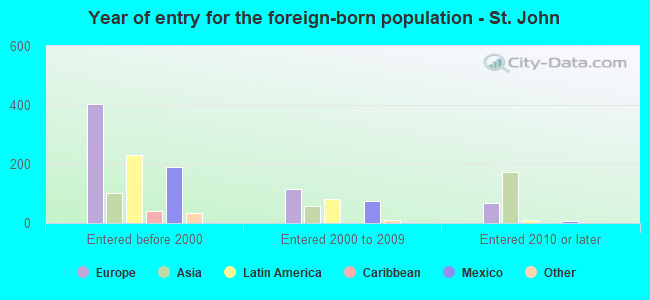
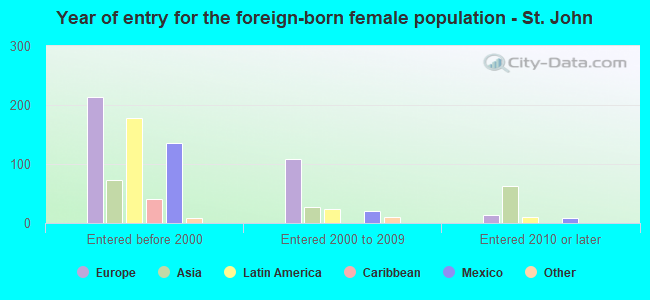
Foreign-born residents in St. John 1,282 residents are foreign born (2.4% Europe , 1.5% Asia , 1.5% Latin America ).
This city:
6.2%Indiana:
5.6%
Marital status for residents in St. John Marital status - White (Caucasian) population 15 years and over
Males 25.4% Never married66.9% Now married0.3% Separated2.9% Widowed4.6% DivorcedFemales 21.5% Never married62.0% Now married1.2% Separated7.4% Widowed7.9% DivorcedWomen who gave birth in the past 12 months Now married:
94.4% (157)Unmarried:
5.6% (9)
Women who did not give birth in the past 12 months Now married:
54.5% (1,815)Unmarried:
45.5% (1,517)
Marital status - Black or African American population 15 years and over
Males 17.0% Never married81.6% Now married0.0% Separated1.4% Widowed0.0% DivorcedFemales 4.5% Never married78.0% Now married1.2% Separated1.2% Widowed15.0% DivorcedWomen who did not give birth in the past 12 months Now married:
69.9% (80)Unmarried:
30.1% (34)
Marital status - Asian population 15 years and over
Males 59.6% Never married40.4% Now married0.0% Separated0.0% Widowed0.0% DivorcedFemales 16.1% Never married83.9% Now married0.0% Separated0.0% Widowed0.0% DivorcedWomen who gave birth in the past 12 months Now married:
100.0% (30)Unmarried:
0.0% (0)
Women who did not give birth in the past 12 months Now married:
73.3% (69)Unmarried:
26.7% (25)
Marital status - Native Hawaiian / Pacific Islander population 15 years and over
Males 0.0% Never married100.0% Now married0.0% Separated0.0% Widowed0.0% DivorcedFemales 0.0% Never married0.0% Now married0.0% Separated100.0% Widowed0.0% DivorcedMarital status - Other race population 15 years and over
Males 18.8% Never married77.0% Now married0.0% Separated4.2% Widowed0.0% DivorcedFemales 8.4% Never married80.8% Now married0.0% Separated0.0% Widowed10.8% DivorcedWomen who gave birth in the past 12 months Now married:
100.0% (6)Unmarried:
0.0% (0)
Women who did not give birth in the past 12 months Now married:
88.2% (244)Unmarried:
11.8% (33)
Marital status - Two or more races population 15 years and over
Males 46.7% Never married50.7% Now married0.0% Separated0.0% Widowed2.6% DivorcedFemales 52.5% Never married34.3% Now married0.0% Separated0.0% Widowed13.2% DivorcedWomen who did not give birth in the past 12 months Now married:
33.2% (105)Unmarried:
66.8% (211)
Marital status - White alone, not Hispanic / Latino population 15 years and over
Males 24.3% Never married68.1% Now married0.0% Separated3.1% Widowed4.5% DivorcedFemales 18.1% Never married64.3% Now married1.3% Separated7.7% Widowed8.7% DivorcedWomen who gave birth in the past 12 months Now married:
94.4% (163)Unmarried:
5.6% (10)
Women who did not give birth in the past 12 months Now married:
58.6% (1,737)Unmarried:
41.4% (1,227)
Marital status - Hispanic or Latino population 15 years and over
Males 39.1% Never married53.5% Now married2.1% Separated2.2% Widowed3.0% DivorcedFemales 46.3% Never married45.1% Now married0.0% Separated2.4% Widowed6.2% DivorcedWomen who gave birth in the past 12 months Now married:
100.0% (6)Unmarried:
0.0% (0)
Women who did not give birth in the past 12 months Now married:
41.5% (351)Unmarried:
58.5% (495)
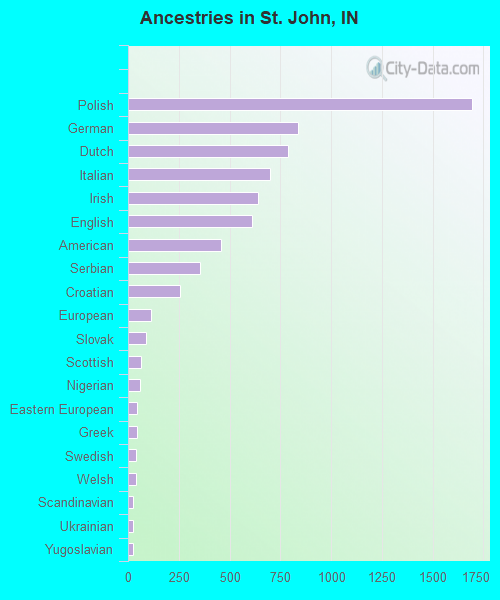
Ancestries in St. John
1,693 18.3% Polish838 9.1% German787 8.5% Dutch701 7.6% Italian638 6.9% Irish610 6.6% English457 5.0% American356 3.9% Serbian254 2.8% Croatian112 1.2% European89 1.0% Slovak63 0.7% Scottish59 0.6% Nigerian44 0.5% Eastern European44 0.5% Greek39 0.4% Swedish37 0.4% Welsh26 0.3% Scandinavian26 0.3% Ukrainian26 0.3% Yugoslavian15 0.2% Finnish15 0.2% Lithuanian13 0.1% Czechoslovakian11 0.1% Moroccan11 0.1% Hungarian11 0.1% Norwegian10 0.1% Romanian9 0.10% Luxembourger8 0.09% Assyrian8 0.09% Danish8 0.09% Russian7 0.08% British
Geographical mobility in St. John Same house 1 year ago 15,644 94.9% White (Caucasian)622 100.0% Black or African American44 100.0% American Indian / Alaska Native311 86.9% Asian15 64.3% Native Hawaiian / Pacific Islander1,090 100.0% Other race1,301 98.9% Two or more races15,066 94.9% White alone, not Hispanic / Latino2,582 96.5% Hispanic or LatinoMoved within same county 469 2.8% White / Caucasian52 4.9% Other race411 2.6% White alone, not Hispanic / Latino163 6.1% Hispanic or LatinoMoved within same state 88 0.5% White / Caucasian89 0.6% White alone, not Hispanic / LatinoMoved from different state 325 2.0% White / Caucasian41 11.5% Asian8 36.1% Native Hawaiian / Pacific Islander15 1.1% Two or more races342 2.2% White alone, not Hispanic / Latino6 0.2% Hispanic or LatinoMoved from abroad 18 0.1% White13 3.6% Asian18 0.1% White alone, not Hispanic / Latino
Children Nativity (place of birth) in St. John
Children under 6 years - Living with two parents Both parents native 971 100.0% NativeBoth parents foreign-born 38 100.0% NativeOne native, one foreign-born parent 175 95.6% Native8 4.4% Foreign-bornChildren under 6 years - Living with one parent Native parent 103 100.0% NativeForeign-born parent 14 100.0% NativeChildren 6 to 17 years - Living with two parents Both parents native 2,649 99.2% Native22 0.8% Foreign-bornBoth parents foreign-born 171 100.0% NativeOne native, one foreign-born parent 127 100.0% NativeChildren 6 to 17 years - Living with one parent Native parent 489 100.0% NativeForeign-born parent 101 47.4% Native112 52.6% Foreign-born
Grandparents responsible for own grandchildren in St. John
Grandparents (30 to 59 years) White / Caucasian 194 87.8% Responsible for grandchildren27 12.2% Not responsible for grandchildrenBlack or African American 11 100.0% Not responsible for grandchildrenOther race 44 100.0% Not responsible for grandchildrenWhite alone, not Hispanic / Latino 200 87.5% Responsible for grandchildren29 12.5% Not responsible for grandchildrenGrandparents (60 years and over) White / Caucasian 30 26.5% Responsible for grandchildren82 73.5% Not responsible for grandchildrenOther race 288 100.0% Not responsible for grandchildrenWhite alone, not Hispanic / Latino 32 28.3% Responsible for grandchildren80 71.7% Not responsible for grandchildren