Races in Succasunna, New Jersey (NJ) Detailed Stats
Data:
Races - White alone (%)
Races - White alone (% change since 2000)
Races - Black alone (%)
Races - Black alone (% change since 2000)
Races - American Indian alone (%)
Races - American Indian alone (% change since 2000)
Races - Asian alone (%)
Races - Asian alone (% change since 2000)
Races - Hispanic (%)
Races - Hispanic (% change since 2000)
Races - Native Hawaiian and Other Pacific Islander alone (%)
Races - Native Hawaiian and Other Pacific Islander alone (% change since 2000)
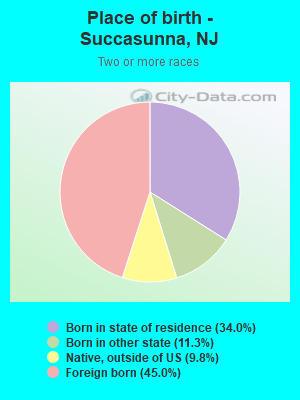
Races - Two or more races(%)
Races - Two or more races(% change since 2000)
Races - Other race alone (%)
Races - Other race alone (% change since 2000)
Racial diversity
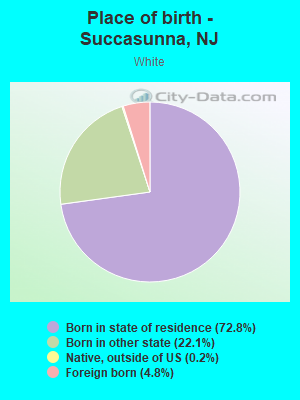
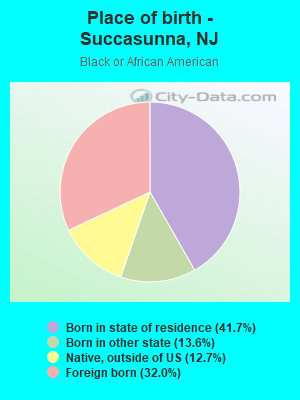
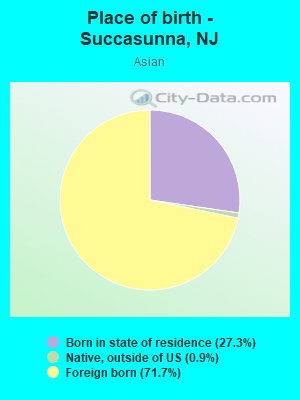
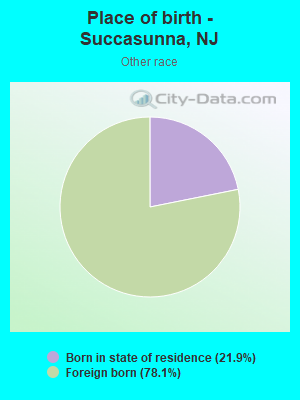
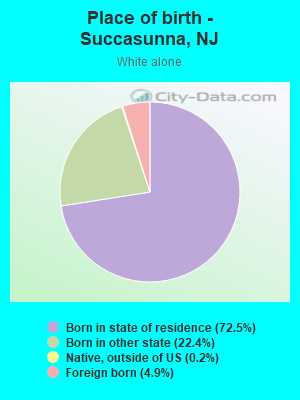
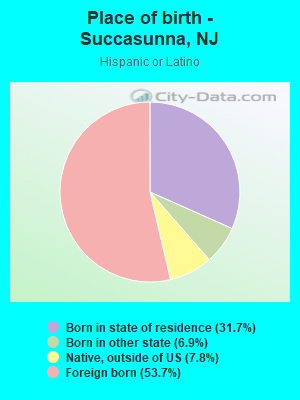
Place of birth - Born in state of residence (%)
Place of birth - Born in state of residence (%) - White
Place of birth - Born in state of residence (%) - Black or African American
Place of birth - Born in state of residence (%) - Asian
Place of birth - Born in state of residence (%) - Hispanic or Latino
Place of birth - Born in state of residence (%) - American Indian and Alaska Native
Place of birth - Born in state of residence (%) - Multirace
Place of birth - Born in state of residence (%) - Other Race
Place of birth - Born in other state (%)
Place of birth - Born in other state (%) - White
Place of birth - Born in other state (%) - Black or African American
Place of birth - Born in other state (%) - Asian
Place of birth - Born in other state (%) - Hispanic or Latino
Place of birth - Born in other state (%) - American Indian and Alaska Native
Place of birth - Born in other state (%) - Multirace
Place of birth - Born in other state (%) - Other Race
Place of birth - Native, outside of US (%)
Place of birth - Native, outside of US (%) - White
Place of birth - Native, outside of US (%) - Black or African American
Place of birth - Native, outside of US (%) - Asian
Place of birth - Native, outside of US (%) - Hispanic or Latino
Place of birth - Native, outside of US (%) - American Indian and Alaska Native
Place of birth - Native, outside of US (%) - Multirace
Place of birth - Native, outside of US (%) - Other Race
Place of birth - Foreign born (%)
Place of birth - Foreign born (%) - White
Place of birth - Foreign born (%) - Black or African American
Place of birth - Foreign born (%) - Asian
Place of birth - Foreign born (%) - Hispanic or Latino
Place of birth - Foreign born (%) - American Indian and Alaska Native
Place of birth - Foreign born (%) - Multirace
Place of birth - Foreign born (%) - Other Race
Residents speaking English at home (%)
Residents speaking English at home - Born in the United States (%)
Residents speaking English at home - Native, born elsewhere (%)
Residents speaking English at home - Foreign born (%)
Residents speaking Spanish at home (%)
Residents speaking Spanish at home - Born in the United States (%)
Residents speaking Spanish at home - Native, born elsewhere (%)
Residents speaking Spanish at home - Foreign born (%)
Residents speaking other language at home (%)
Residents speaking other language at home - Born in the United States (%)
Residents speaking other language at home - Native, born elsewhere (%)
Residents speaking other language at home - Foreign born (%)
Marital status - Never married (%)
Marital status - Now married (%)
Marital status - Separated (%)
Marital status - Widowed (%)
Marital status - Divorced (%)
Ancestries Reported - Arab (%)
Ancestries Reported - Czech (%)
Ancestries Reported - Danish (%)
Ancestries Reported - Dutch (%)
Ancestries Reported - English (%)
Ancestries Reported - French (%)
Ancestries Reported - French Canadian (%)
Ancestries Reported - German (%)
Ancestries Reported - Greek (%)
Ancestries Reported - Hungarian (%)
Ancestries Reported - Irish (%)
Ancestries Reported - Italian (%)
Ancestries Reported - Lithuanian (%)
Ancestries Reported - Norwegian (%)
Ancestries Reported - Polish (%)
Ancestries Reported - Portuguese (%)
Ancestries Reported - Russian (%)
Ancestries Reported - Scotch-Irish (%)
Ancestries Reported - Scottish (%)
Ancestries Reported - Slovak (%)
Ancestries Reported - Subsaharan African (%)
Ancestries Reported - Swedish (%)
Ancestries Reported - Swiss (%)
Ancestries Reported - Ukrainian (%)
Ancestries Reported - United States (%)
Ancestries Reported - Welsh (%)
Ancestries Reported - West Indian (%)
Ancestries Reported - Other (%)
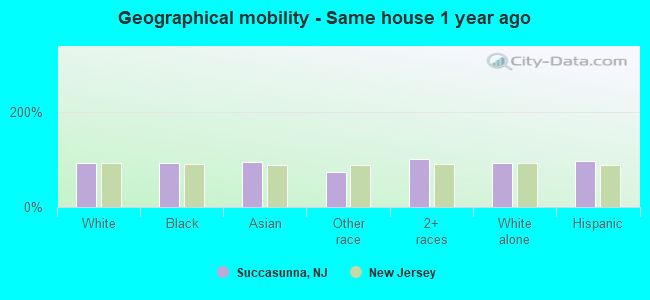
Geographical mobility - Same house 1 year ago (%)
Geographical mobility - Same house 1 year ago (%) - White
Geographical mobility - Same house 1 year ago (%) - Black or African American
Geographical mobility - Same house 1 year ago (%) - Asian
Geographical mobility - Same house 1 year ago (%) - Hispanic or Latino
Geographical mobility - Same house 1 year ago (%) - American Indian and Alaska Native
Geographical mobility - Same house 1 year ago (%) - Multirace
Geographical mobility - Same house 1 year ago (%) - Other Race
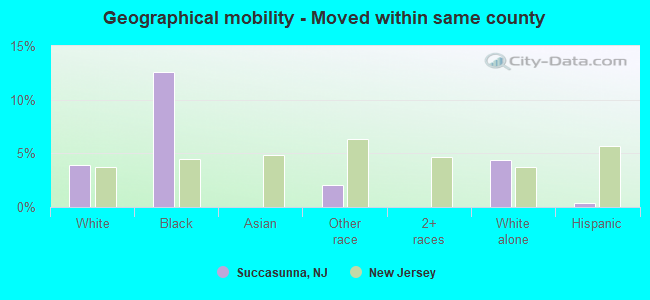
Geographical mobility - Moved within same county (%)
Geographical mobility - Moved within same county (%) - White
Geographical mobility - Moved within same county (%) - Black or African American
Geographical mobility - Moved within same county (%) - Asian
Geographical mobility - Moved within same county (%) - Hispanic or Latino
Geographical mobility - Moved within same county (%) - American Indian and Alaska Native
Geographical mobility - Moved within same county (%) - Multirace
Geographical mobility - Moved within same county (%) - Other Race
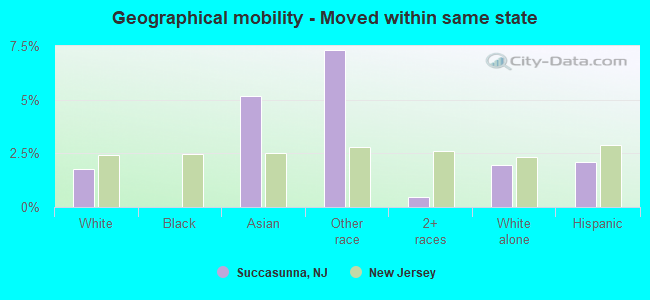
Geographical mobility - Moved from different county within same state (%)
Geographical mobility - Moved from different county within same state (%) - White
Geographical mobility - Moved from different county within same state (%) - Black or African American
Geographical mobility - Moved from different county within same state (%) - Asian
Geographical mobility - Moved from different county within same state (%) - Hispanic or Latino
Geographical mobility - Moved from different county within same state (%) - American Indian and Alaska Native
Geographical mobility - Moved from different county within same state (%) - Multirace
Geographical mobility - Moved from different county within same state (%) - Other Race
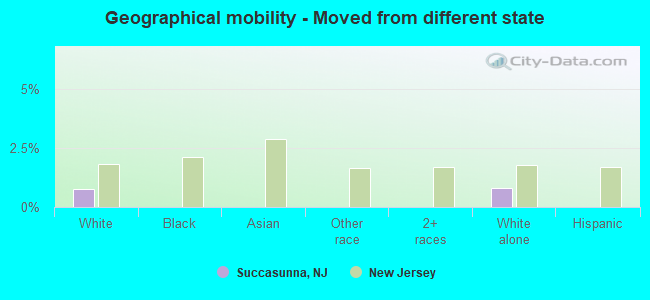
Geographical mobility - Moved from different state (%)
Geographical mobility - Moved from different state (%) - White
Geographical mobility - Moved from different state (%) - Black or African American
Geographical mobility - Moved from different state (%) - Asian
Geographical mobility - Moved from different state (%) - Hispanic or Latino
Geographical mobility - Moved from different state (%) - American Indian and Alaska Native
Geographical mobility - Moved from different state (%) - Multirace
Geographical mobility - Moved from different state (%) - Other Race
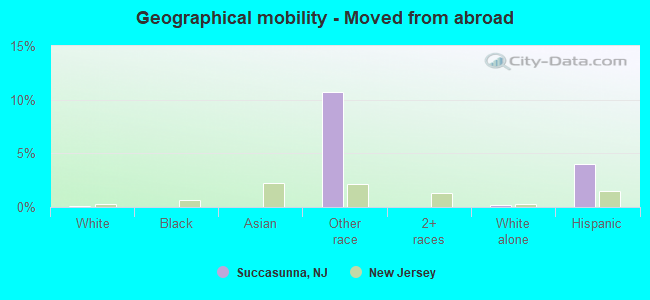
Geographical mobility - Moved from abroad (%)
Geographical mobility - Moved from abroad (%) - White
Geographical mobility - Moved from abroad (%) - Black or African American
Geographical mobility - Moved from abroad (%) - Asian
Geographical mobility - Moved from abroad (%) - Hispanic or Latino
Geographical mobility - Moved from abroad (%) - American Indian and Alaska Native
Geographical mobility - Moved from abroad (%) - Multirace
Geographical mobility - Moved from abroad (%) - Other Race
Place of birth for the foreign-born population - Ireland (%)
Place of birth for the foreign-born population - Denmark (%)
Place of birth for the foreign-born population - Norway (%)
Place of birth for the foreign-born population - Sweden (%)
Place of birth for the foreign-born population - United Kingdom (%)
Place of birth for the foreign-born population - England (%)
Place of birth for the foreign-born population - Scotland (%)
Place of birth for the foreign-born population - Other Northern Europe (%)
Place of birth for the foreign-born population - Austria (%)
Place of birth for the foreign-born population - Belgium (%)
Place of birth for the foreign-born population - France (%)
Place of birth for the foreign-born population - Germany (%)
Place of birth for the foreign-born population - Netherlands (%)
Place of birth for the foreign-born population - Switzerland (%)
Place of birth for the foreign-born population - Other Western Europe (%)
Place of birth for the foreign-born population - Greece (%)
Place of birth for the foreign-born population - Italy (%)
Place of birth for the foreign-born population - Portugal (%)
Place of birth for the foreign-born population - Spain (%)
Place of birth for the foreign-born population - Other Southern Europe (%)
Place of birth for the foreign-born population - Albania (%)
Place of birth for the foreign-born population - Belarus (%)
Place of birth for the foreign-born population - Bosnia and Herzegovina (%)
Place of birth for the foreign-born population - Bulgaria (%)
Place of birth for the foreign-born population - Croatia (%)
Place of birth for the foreign-born population - Czechoslovakia (%)
Place of birth for the foreign-born population - Hungary (%)
Place of birth for the foreign-born population - Latvia (%)
Place of birth for the foreign-born population - Lithuania (%)
Place of birth for the foreign-born population - North Macedonia (Macedonia) (%)
Place of birth for the foreign-born population - Moldova (%)
Place of birth for the foreign-born population - Poland (%)
Place of birth for the foreign-born population - Romania (%)
Place of birth for the foreign-born population - Russia (%)
Place of birth for the foreign-born population - Serbia (%)
Place of birth for the foreign-born population - Ukraine (%)
Place of birth for the foreign-born population - Other Eastern Europe (%)
Place of birth for the foreign-born population - China (%)
Place of birth for the foreign-born population - Hong Kong (%)
Place of birth for the foreign-born population - Taiwan (%)
Place of birth for the foreign-born population - Japan (%)
Place of birth for the foreign-born population - Korea (%)
Place of birth for the foreign-born population - Other Eastern Asia (%)
Place of birth for the foreign-born population - Afghanistan (%)
Place of birth for the foreign-born population - Bangladesh (%)
Place of birth for the foreign-born population - India (%)
Place of birth for the foreign-born population - Iran (%)
Place of birth for the foreign-born population - Kazakhstan (%)
Place of birth for the foreign-born population - Nepal (%)
Place of birth for the foreign-born population - Pakistan (%)
Place of birth for the foreign-born population - Sri Lanka (%)
Place of birth for the foreign-born population - Uzbekistan (%)
Place of birth for the foreign-born population - Other South Central Asia (%)
Place of birth for the foreign-born population - Burma (%)
Place of birth for the foreign-born population - Cambodia (%)
Place of birth for the foreign-born population - Indonesia (%)
Place of birth for the foreign-born population - Laos (%)
Place of birth for the foreign-born population - Malaysia (%)
Place of birth for the foreign-born population - Philippines (%)
Place of birth for the foreign-born population - Singapore (%)
Place of birth for the foreign-born population - Thailand (%)
Place of birth for the foreign-born population - Vietnam (%)
Place of birth for the foreign-born population - Other South Eastern Asia (%)
Place of birth for the foreign-born population - Armenia (%)
Place of birth for the foreign-born population - Iraq (%)
Place of birth for the foreign-born population - Israel (%)
Place of birth for the foreign-born population - Jordan (%)
Place of birth for the foreign-born population - Kuwait (%)
Place of birth for the foreign-born population - Lebanon (%)
Place of birth for the foreign-born population - Saudi Arabia (%)
Place of birth for the foreign-born population - Syria (%)
Place of birth for the foreign-born population - Turkey (%)
Place of birth for the foreign-born population - Yemen (%)
Place of birth for the foreign-born population - Other Western Asia (%)
Place of birth for the foreign-born population - Eritrea (%)
Place of birth for the foreign-born population - Ethiopia (%)
Place of birth for the foreign-born population - Kenya (%)
Place of birth for the foreign-born population - Somalia (%)
Place of birth for the foreign-born population - Uganda (%)
Place of birth for the foreign-born population - Zimbabwe (%)
Place of birth for the foreign-born population - Other Eastern Africa (%)
Place of birth for the foreign-born population - Cameroon (%)
Place of birth for the foreign-born population - Congo (%)
Place of birth for the foreign-born population - Democratic Republic of Congo (Zaire) (%)
Place of birth for the foreign-born population - Other Middle Africa (%)
Place of birth for the foreign-born population - Egypt (%)
Place of birth for the foreign-born population - Morocco (%)
Place of birth for the foreign-born population - Sudan (%)
Place of birth for the foreign-born population - Other Northern Africa (%)
Place of birth for the foreign-born population - South Africa (%)
Place of birth for the foreign-born population - Other Southern Africa (%)
Place of birth for the foreign-born population - Cabo Verde (%)
Place of birth for the foreign-born population - Ghana (%)
Place of birth for the foreign-born population - Liberia (%)
Place of birth for the foreign-born population - Nigeria (%)
Place of birth for the foreign-born population - Senegal (%)
Place of birth for the foreign-born population - Sierra Leone (%)
Place of birth for the foreign-born population - Other Western Africa (%)
Place of birth for the foreign-born population - Australia (%)
Place of birth for the foreign-born population - New Zealand (%)
Place of birth for the foreign-born population - Fiji (%)
Place of birth for the foreign-born population - Micronesia (%)
Place of birth for the foreign-born population - Bahamas (%)
Place of birth for the foreign-born population - Barbados (%)
Place of birth for the foreign-born population - Cuba (%)
Place of birth for the foreign-born population - Dominica (%)
Place of birth for the foreign-born population - Dominican Republic (%)
Place of birth for the foreign-born population - Grenada (%)
Place of birth for the foreign-born population - Haiti (%)
Place of birth for the foreign-born population - Jamaica (%)
Place of birth for the foreign-born population - St. Vincent and the Grenadines (%)
Place of birth for the foreign-born population - Trinidad and Tobago (%)
Place of birth for the foreign-born population - West Indies (%)
Place of birth for the foreign-born population - Other Caribbean (%)
Place of birth for the foreign-born population - Belize (%)
Place of birth for the foreign-born population - Costa Rica (%)
Place of birth for the foreign-born population - El Salvador (%)
Place of birth for the foreign-born population - Guatemala (%)
Place of birth for the foreign-born population - Honduras (%)
Place of birth for the foreign-born population - Mexico (%)
Place of birth for the foreign-born population - Nicaragua (%)
Place of birth for the foreign-born population - Panama (%)
Place of birth for the foreign-born population - Other Central America (%)
Place of birth for the foreign-born population - Argentina (%)
Place of birth for the foreign-born population - Bolivia (%)
Place of birth for the foreign-born population - Brazil (%)
Place of birth for the foreign-born population - Chile (%)
Place of birth for the foreign-born population - Colombia (%)
Place of birth for the foreign-born population - Ecuador (%)
Place of birth for the foreign-born population - Guyana (%)
Place of birth for the foreign-born population - Peru (%)
Place of birth for the foreign-born population - Uruguay (%)
Place of birth for the foreign-born population - Venezuela (%)
Place of birth for the foreign-born population - Other South America (%)
Place of birth for the foreign-born population - Canada (%)
Place of birth for the foreign-born population - Other Northern America (%)
Place of birth for the foreign-born population - Other (%)
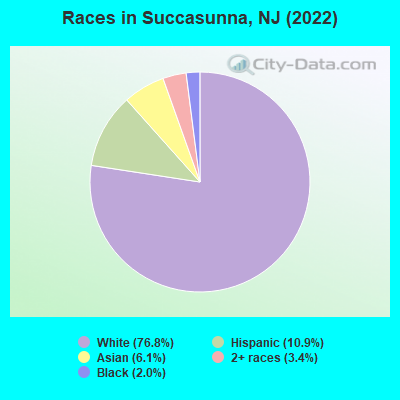
According to 2022 data, the most numerous races in Succasunna, NJ are White alone (7,587 residents), Hispanic (1,081 residents), and Black alone (193 residents). 82.7% of Succasunna residents speak English at home.
Race distribution in Succasunna 7,587 76.8% White alone 1,081 10.9% Hispanic 598 6.1% Asian alone 332 3.4% Two or more races 193 2.0% Black alone
2000 2022
5,557,209 66.0% White alone 1,117,191 13.3% Hispanic 1,096,171 13.0% Black alone 477,012 5.7% Asian alone 133,689 1.6% Two or more races 19,565 0.2% Other race alone 11,338 0.1% American Indian alone 2,175 0.03% Native Hawaiian and Other
4,766,476 51.5% White alone 2,028,470 21.9% Hispanic 1,111,632 12.0% Black alone 923,546 10.0% Asian alone 332,237 3.6% Two or more races 89,847 1.0% Other race alone 8,557 0.09% American Indian alone 934 0.01% Native Hawaiian and Other
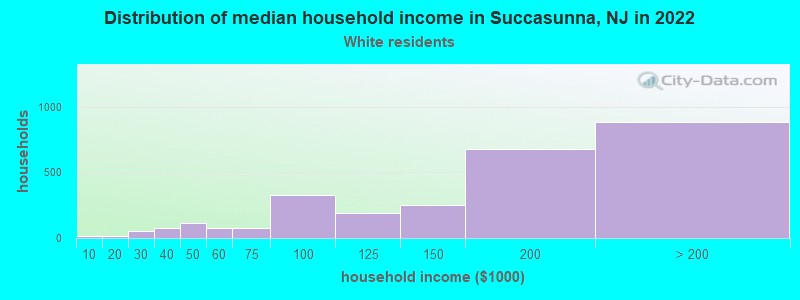
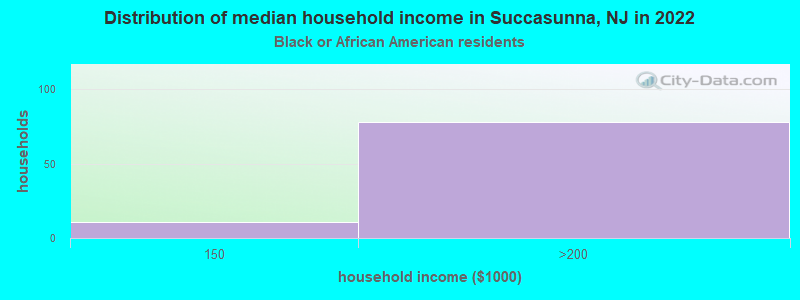
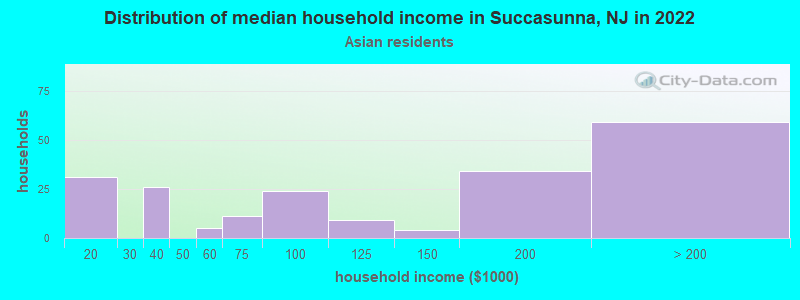
Income and house value in Succasunna Median household income in 2022 $158,498 White non-Hispanic householdersover $200,000 Black householders$162,391 Asian householders$152,942 Some other race householders$131,153 Hispanic or Latino race householders
Median age by race in Succasunna
45.7 Median age for White residents42.3 48.5 37.1 Median age for Black or African American residents38.8 45.6 -847,710,329.3 Median age for American Indian / Alaska Native residents-707,246,376.1 -671,264,367.1 54.9 Median age for Asian residents55.0 56.2 -804,177,544.9 Median age for Native Hawaiian / Pacific Islander residents-666,666,666.0 -713,070,378.3 34.7 Median age for Other race residents39.2 34.2 54.1 Median age for Two or more races residents55.9 54.2 45.8 Median age for White alone residents44.1 48.1 46.2 Median age for Hispanic or Latino residents37.9 48.8
Owner/renter occupied households by race in Succasunna
House owners and renters - White residents 2,602 93.4% Owner occupied184 6.6% Renter occupiedHouse owners and renters - Black or African American residents 97 100.0% Owner occupiedHouse owners and renters - Asian residents 168 88.0% Owner occupied23 12.0% Renter occupiedHouse owners and renters - Other race residents 62 71.6% Owner occupied25 28.4% Renter occupiedHouse owners and renters - Two or more races residents 237 100.0% Owner occupiedHouse owners and renters - White alone residents 2,538 92.4% Owner occupied208 7.6% Renter occupiedHouse owners and renters - Hispanic or Latino residents 341 95.6% Owner occupied16 4.4% Renter occupied
Language usage in Succasunna
English speakers - Total 82.7% of residents of Succasunna speak English at home.
7.3% of residents speak Spanish at home 482 71.4% Speak English very well193 28.6% Speak English less than very well9.8% of residents speak other language at home 715 78.8% Speak English very well192 21.2% Speak English less than very well
English speakers - Born in the United States 95.1% of residents of Succasunna speak English at home.
1.5% of residents speak Spanish at home 28 100.0% Speak English very well1.8% of residents speak other language at home 33 100.0% Speak English very well
English speakers - Native, born elsewhere 56.8% of residents of Succasunna speak English at home.
39.7% of residents speak Spanish at home 58 100.0% Speak English very well
English speakers - Foreign-born 22.8% of residents of Succasunna speak English at home.
33.2% of residents speak Spanish at home 297 61.5% Speak English very well186 38.5% Speak English less than very well43.9% of residents speak other language at home 454 70.9% Speak English very well186 29.1% Speak English less than very well
White (Caucasian) - Speak only English Native:
97.8% (6,715)Foreign-born:
27.4% (101)
White (Caucasian) - Speak another language Native:
2.7% (188)Foreign-born:
71.4% (264)
Black or African American - Speak only English Native:
74.5% (91)Foreign-born:
100.0% (50)
Asian - Speak only English Native:
80.4% (108)Foreign-born:
13.7% (58)
Asian - Speak another language Native:
21.7% (29)Foreign-born:
84.8% (357)
Other race - Speak another language Native:
85.5% (36)Foreign-born:
99.6% (257)
Two or more races - Speak only English Native:
57.6% (240)Foreign-born:
40.6% (161)
Two or more races - Speak another language Native:
43.2% (180)Foreign-born:
63.4% (252)
White alone - Speak only English Native:
96.8% (6,584)Foreign-born:
28.3% (106)
White alone - Speak another language Native:
3.1% (213)Foreign-born:
72.2% (271)
Hispanic or Latino - Speak only English Native:
58.7% (251)Foreign-born:
16.6% (95)
Hispanic or Latino - Speak another language Native:
42.0% (180)Foreign-born:
85.3% (487)
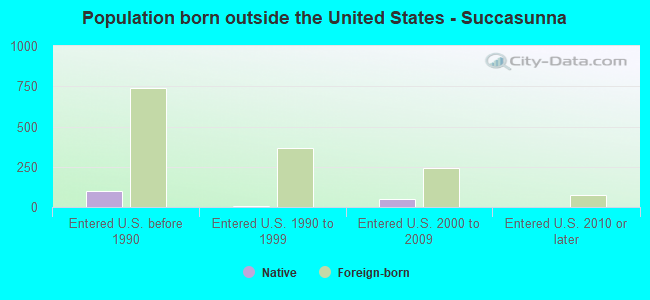
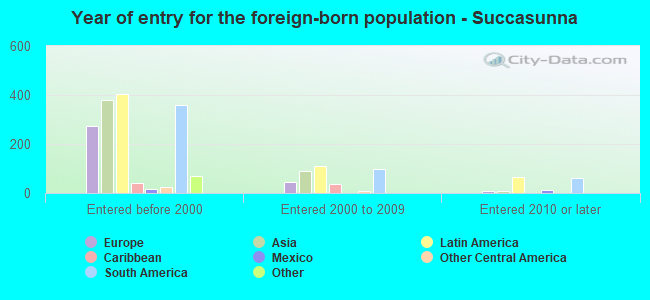
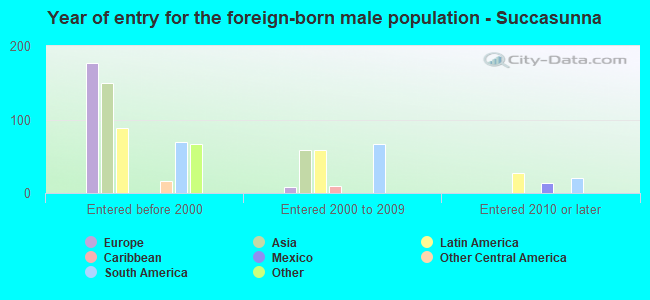
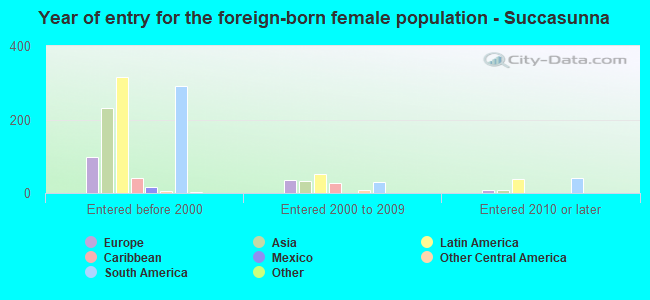
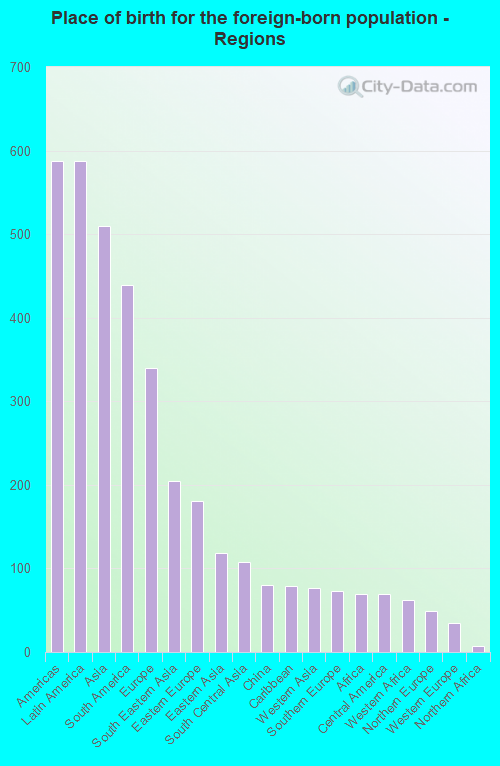
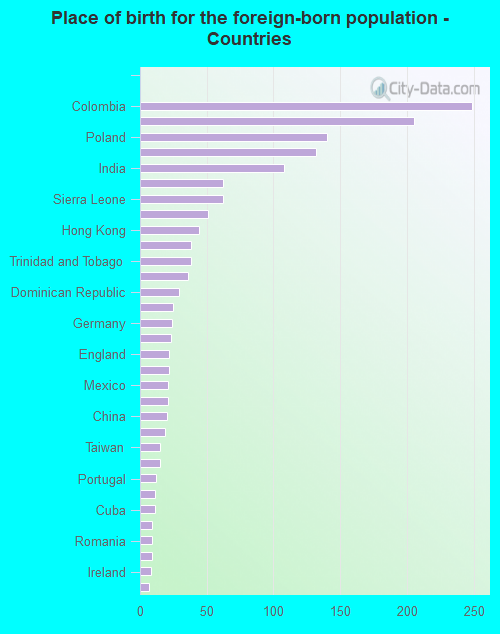
Foreign-born residents in Succasunna
Marital status for residents in Succasunna Marital status - White (Caucasian) population 15 years and over
Males 29.5% Never married62.4% Now married1.0% Separated3.2% Widowed3.8% DivorcedFemales 19.4% Never married61.5% Now married0.3% Separated8.2% Widowed10.7% DivorcedWomen who gave birth in the past 12 months Now married:
100.0% (94)Unmarried:
0.0% (0)
Women who did not give birth in the past 12 months Now married:
54.6% (724)Unmarried:
45.4% (603)
Marital status - Black or African American population 15 years and over
Males 26.5% Never married73.5% Now married0.0% Separated0.0% Widowed0.0% DivorcedFemales 43.2% Never married14.9% Now married2.7% Separated0.0% Widowed39.2% DivorcedWomen who did not give birth in the past 12 months Now married:
24.5% (12)Unmarried:
75.5% (38)
Marital status - Asian population 15 years and over
Males 31.0% Never married64.6% Now married4.4% Separated0.0% Widowed0.0% DivorcedFemales 23.9% Never married62.8% Now married0.0% Separated11.6% Widowed1.7% DivorcedWomen who gave birth in the past 12 months Now married:
100.0% (54)Unmarried:
0.0% (0)
Women who did not give birth in the past 12 months Now married:
22.2% (9)Unmarried:
77.8% (30)
Marital status - Other race population 15 years and over
Males 26.1% Never married34.2% Now married18.0% Separated0.0% Widowed21.6% DivorcedFemales 50.4% Never married29.6% Now married0.0% Separated0.0% Widowed20.0% DivorcedWomen who gave birth in the past 12 months Now married:
100.0% (19)Unmarried:
0.0% (0)
Women who did not give birth in the past 12 months Now married:
9.0% (11)Unmarried:
91.0% (107)
Marital status - Two or more races population 15 years and over
Males 41.0% Never married59.0% Now married0.0% Separated0.0% Widowed0.0% DivorcedFemales 25.8% Never married74.2% Now married0.0% Separated0.0% Widowed0.0% DivorcedWomen who did not give birth in the past 12 months Now married:
50.0% (87)Unmarried:
50.0% (87)
Marital status - White alone, not Hispanic / Latino population 15 years and over
Males 28.3% Never married63.8% Now married1.0% Separated3.4% Widowed3.5% DivorcedFemales 19.0% Never married61.4% Now married0.3% Separated8.6% Widowed10.7% DivorcedWomen who gave birth in the past 12 months Now married:
100.0% (100)Unmarried:
0.0% (0)
Women who did not give birth in the past 12 months Now married:
53.8% (704)Unmarried:
46.2% (605)
Marital status - Hispanic or Latino population 15 years and over
Males 36.6% Never married49.3% Now married4.4% Separated0.0% Widowed9.6% DivorcedFemales 31.5% Never married60.4% Now married0.0% Separated0.0% Widowed8.1% DivorcedWomen who gave birth in the past 12 months Now married:
100.0% (15)Unmarried:
0.0% (0)
Women who did not give birth in the past 12 months Now married:
35.9% (93)Unmarried:
64.1% (166)
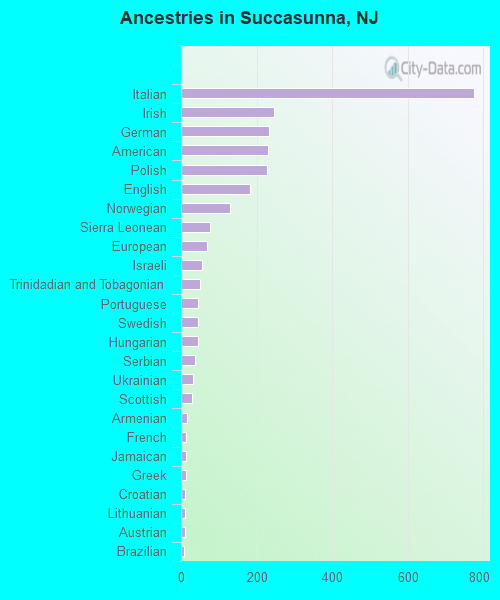
Ancestries in Succasunna
776 19.5% Italian246 6.2% Irish232 5.8% German230 5.8% American228 5.7% Polish183 4.6% English129 3.2% Norwegian78 2.0% Sierra Leonean70 1.8% European55 1.4% Israeli50 1.3% Trinidadian and Tobagonian46 1.2% Portuguese45 1.1% Swedish44 1.1% Hungarian38 1.0% Serbian32 0.8% Ukrainian29 0.7% Scottish17 0.4% Armenian14 0.4% French14 0.4% Jamaican13 0.3% Greek11 0.3% Croatian11 0.3% Lithuanian10 0.3% Austrian9 0.2% Brazilian3 0.08% Dutch3 0.08% Eastern European
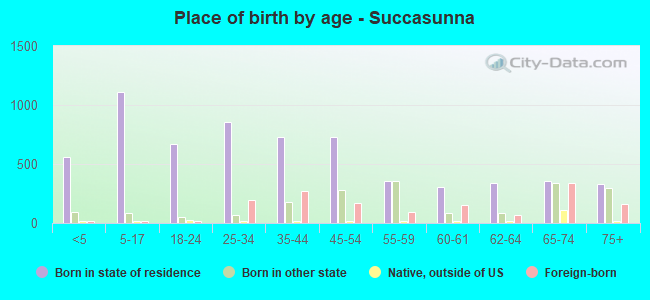
Children Nativity (place of birth) in Succasunna
Children under 6 years - Living with two parents Both parents native 408 100.0% NativeBoth parents foreign-born 109 100.0% NativeOne native, one foreign-born parent 87 100.0% NativeChildren under 6 years - Living with one parent Native parent 64 100.0% NativeForeign-born parent 12 100.0% NativeChildren 6 to 17 years - Living with two parents Both parents native 822 100.0% NativeBoth parents foreign-born 44 100.0% NativeOne native, one foreign-born parent 131 100.0% NativeChildren 6 to 17 years - Living with one parent Native parent 53 100.0% NativeForeign-born parent 65 50.3% Native65 49.7% Foreign-born
Grandparents responsible for own grandchildren in Succasunna
Grandparents (30 to 59 years) White / Caucasian 19 100.0% Not responsible for grandchildrenAsian 21 100.0% Not responsible for grandchildrenWhite alone, not Hispanic / Latino 21 100.0% Not responsible for grandchildren
Grandparents (60 years and over) White / Caucasian 38 100.0% Not responsible for grandchildrenAsian 14 100.0% Not responsible for grandchildrenWhite alone, not Hispanic / Latino 42 100.0% Not responsible for grandchildren