Races in Surry, New Hampshire (NH) Detailed Stats
Ancestries, Foreign-born residents, place of birth

Recent posts about races in Surry, New Hampshire on our local forum with over 2,400,000 registered users:
 | Looking at Southern NH...Where would you recommend searching? (15 replies) |
| Where in NH? (22 replies) |
| LA to New England-Looking at New Hampshire (47 replies) |
| Keene NH?? (51 replies) |
| At long last - moving to NH (2 replies) |
| Pros & Cons of New Hampshire? Your opinions please (58 replies) |
1.9% of Surry, NH residents are foreign-born , which is 158.8% less than the foreign-born rate of 5.0% across the entire state of New Hampshire.
Race distribution in Surry

- 65196.7%White alone
- 101.5%Hispanic
- 60.9%Two or more races
- 40.6%American Indian alone
- 20.3%Asian alone

2000
2022
-
- 1,175,25295.1%White alone
- 20,4891.7%Hispanic
- 15,8031.3%Asian alone
- 11,6060.9%Two or more races
- 8,3540.7%Black alone
- 2,6980.2%American Indian alone
- 1,2540.1%Other race alone
- 3300.03%Native Hawaiian and Other
Pacific Islander alone

-
- 1,208,10186.6%White alone
- 63,4794.5%Hispanic
- 60,7244.4%Two or more races
- 36,5192.6%Asian alone
- 17,9311.3%Black alone
- 6,6150.5%Other race alone
- 1,0140.07%American Indian alone
- 8480.06%Native Hawaiian and Other
Pacific Islander alone

Income and house value in Surry
- Median household income in 2022
- $107,592White non-Hispanic householders
- $131,626Asian householders
- $106,528Two or more races householders
- $105,943Hispanic or Latino race householders
- Median 2022 house value
- $318,147White Non-Hispanic householders
- $485,770Asian householders
- $291,462Two or more races householders
- $291,462Hispanic or Latino householders
Household income for White non-Hispanic householders

Household income for Asian householders

Household income for Two or more races householders

Household income for Hispanic or Latino race householders

Foreign-born residents in Surry
13 residents are foreign born
| This city: | 1.9% |
| New Hampshire: | 4.4% |
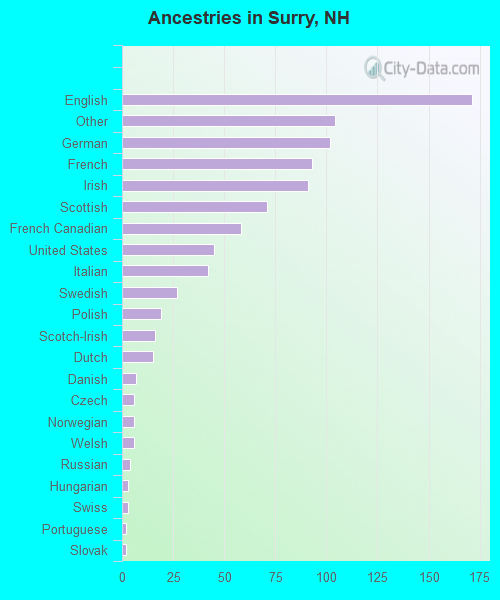
Ancestries in Surry

- 17119.1%English
- 10411.6%Other
- 10211.4%German
- 9310.4%French
- 9110.2%Irish
- 718.0%Scottish
- 586.5%French Canadian
- 455.0%United States
- 424.7%Italian
- 273.0%Swedish
- 192.1%Polish
- 161.8%Scotch-Irish
- 151.7%Dutch
- 70.8%Danish
- 60.7%Czech
- 60.7%Norwegian
- 60.7%Welsh
- 40.4%Russian
- 30.3%Hungarian
- 30.3%Swiss
- 20.2%Portuguese
- 20.2%Slovak
Zip codes: 03431.