Races in Troy, Michigan (MI) Detailed Stats
Data:
Races - White alone (%)
Races - White alone (% change since 2000)
Races - Black alone (%)
Races - Black alone (% change since 2000)
Races - American Indian alone (%)
Races - American Indian alone (% change since 2000)
Races - Asian alone (%)
Races - Asian alone (% change since 2000)
Races - Hispanic (%)
Races - Hispanic (% change since 2000)
Races - Native Hawaiian and Other Pacific Islander alone (%)
Races - Native Hawaiian and Other Pacific Islander alone (% change since 2000)
Races - Two or more races(%)
Races - Two or more races(% change since 2000)
Races - Other race alone (%)
Races - Other race alone (% change since 2000)
Racial diversity
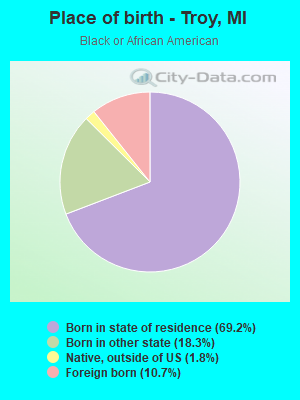
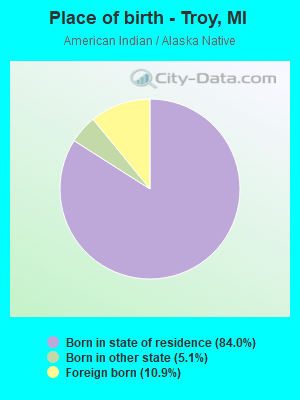
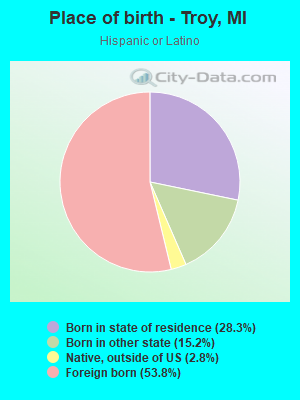
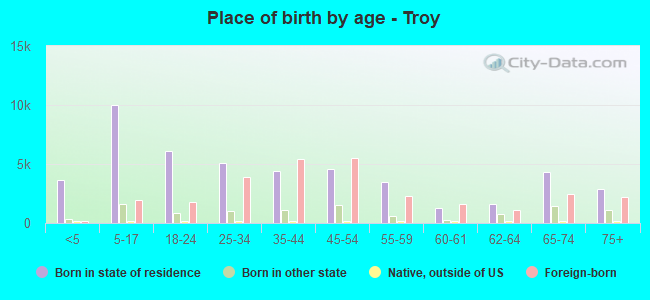
Place of birth - Born in state of residence (%)
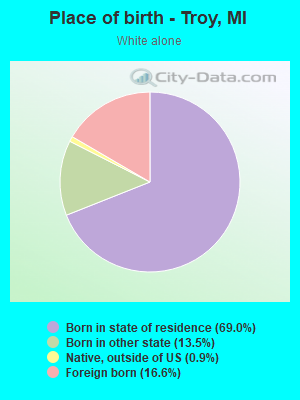
Place of birth - Born in state of residence (%) - White
Place of birth - Born in state of residence (%) - Black or African American
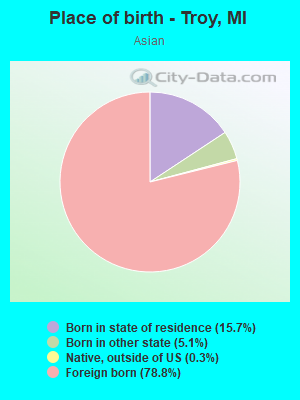
Place of birth - Born in state of residence (%) - Asian
Place of birth - Born in state of residence (%) - Hispanic or Latino
Place of birth - Born in state of residence (%) - American Indian and Alaska Native
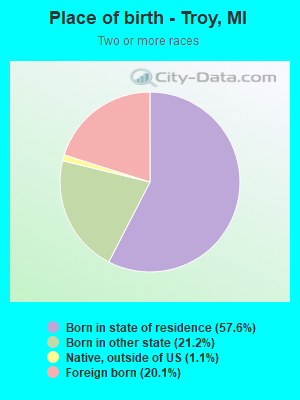
Place of birth - Born in state of residence (%) - Multirace
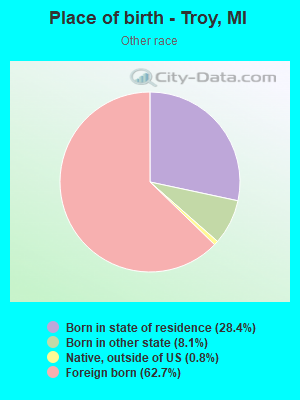
Place of birth - Born in state of residence (%) - Other Race
Place of birth - Born in other state (%)
Place of birth - Born in other state (%) - White
Place of birth - Born in other state (%) - Black or African American
Place of birth - Born in other state (%) - Asian
Place of birth - Born in other state (%) - Hispanic or Latino
Place of birth - Born in other state (%) - American Indian and Alaska Native
Place of birth - Born in other state (%) - Multirace
Place of birth - Born in other state (%) - Other Race
Place of birth - Native, outside of US (%)
Place of birth - Native, outside of US (%) - White
Place of birth - Native, outside of US (%) - Black or African American
Place of birth - Native, outside of US (%) - Asian
Place of birth - Native, outside of US (%) - Hispanic or Latino
Place of birth - Native, outside of US (%) - American Indian and Alaska Native
Place of birth - Native, outside of US (%) - Multirace
Place of birth - Native, outside of US (%) - Other Race
Place of birth - Foreign born (%)
Place of birth - Foreign born (%) - White
Place of birth - Foreign born (%) - Black or African American
Place of birth - Foreign born (%) - Asian
Place of birth - Foreign born (%) - Hispanic or Latino
Place of birth - Foreign born (%) - American Indian and Alaska Native
Place of birth - Foreign born (%) - Multirace
Place of birth - Foreign born (%) - Other Race
Residents speaking English at home (%)
Residents speaking English at home - Born in the United States (%)
Residents speaking English at home - Native, born elsewhere (%)
Residents speaking English at home - Foreign born (%)
Residents speaking Spanish at home (%)
Residents speaking Spanish at home - Born in the United States (%)
Residents speaking Spanish at home - Native, born elsewhere (%)
Residents speaking Spanish at home - Foreign born (%)
Residents speaking other language at home (%)
Residents speaking other language at home - Born in the United States (%)
Residents speaking other language at home - Native, born elsewhere (%)
Residents speaking other language at home - Foreign born (%)
Marital status - Never married (%)
Marital status - Now married (%)
Marital status - Separated (%)
Marital status - Widowed (%)
Marital status - Divorced (%)
Ancestries Reported - Arab (%)
Ancestries Reported - Czech (%)
Ancestries Reported - Danish (%)
Ancestries Reported - Dutch (%)
Ancestries Reported - English (%)
Ancestries Reported - French (%)
Ancestries Reported - French Canadian (%)
Ancestries Reported - German (%)
Ancestries Reported - Greek (%)
Ancestries Reported - Hungarian (%)
Ancestries Reported - Irish (%)
Ancestries Reported - Italian (%)
Ancestries Reported - Lithuanian (%)
Ancestries Reported - Norwegian (%)
Ancestries Reported - Polish (%)
Ancestries Reported - Portuguese (%)
Ancestries Reported - Russian (%)
Ancestries Reported - Scotch-Irish (%)
Ancestries Reported - Scottish (%)
Ancestries Reported - Slovak (%)
Ancestries Reported - Subsaharan African (%)
Ancestries Reported - Swedish (%)
Ancestries Reported - Swiss (%)
Ancestries Reported - Ukrainian (%)
Ancestries Reported - United States (%)
Ancestries Reported - Welsh (%)
Ancestries Reported - West Indian (%)
Ancestries Reported - Other (%)
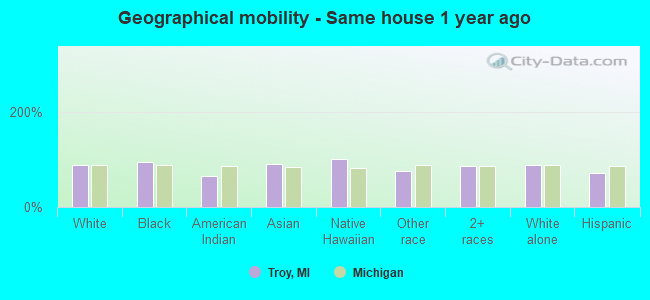
Geographical mobility - Same house 1 year ago (%)
Geographical mobility - Same house 1 year ago (%) - White
Geographical mobility - Same house 1 year ago (%) - Black or African American
Geographical mobility - Same house 1 year ago (%) - Asian
Geographical mobility - Same house 1 year ago (%) - Hispanic or Latino
Geographical mobility - Same house 1 year ago (%) - American Indian and Alaska Native
Geographical mobility - Same house 1 year ago (%) - Multirace
Geographical mobility - Same house 1 year ago (%) - Other Race
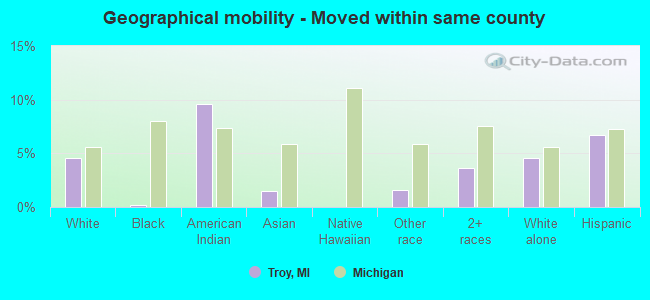
Geographical mobility - Moved within same county (%)
Geographical mobility - Moved within same county (%) - White
Geographical mobility - Moved within same county (%) - Black or African American
Geographical mobility - Moved within same county (%) - Asian
Geographical mobility - Moved within same county (%) - Hispanic or Latino
Geographical mobility - Moved within same county (%) - American Indian and Alaska Native
Geographical mobility - Moved within same county (%) - Multirace
Geographical mobility - Moved within same county (%) - Other Race
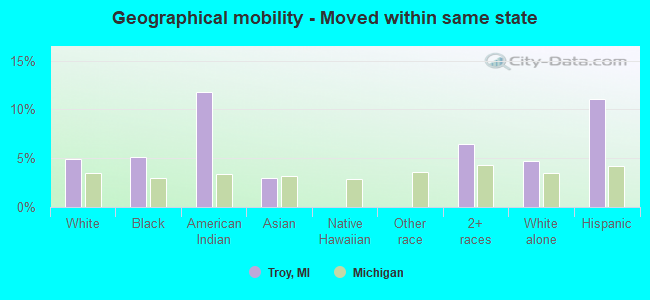
Geographical mobility - Moved from different county within same state (%)
Geographical mobility - Moved from different county within same state (%) - White
Geographical mobility - Moved from different county within same state (%) - Black or African American
Geographical mobility - Moved from different county within same state (%) - Asian
Geographical mobility - Moved from different county within same state (%) - Hispanic or Latino
Geographical mobility - Moved from different county within same state (%) - American Indian and Alaska Native
Geographical mobility - Moved from different county within same state (%) - Multirace
Geographical mobility - Moved from different county within same state (%) - Other Race
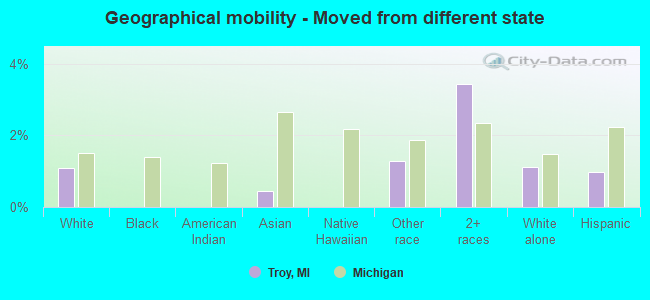
Geographical mobility - Moved from different state (%)
Geographical mobility - Moved from different state (%) - White
Geographical mobility - Moved from different state (%) - Black or African American
Geographical mobility - Moved from different state (%) - Asian
Geographical mobility - Moved from different state (%) - Hispanic or Latino
Geographical mobility - Moved from different state (%) - American Indian and Alaska Native
Geographical mobility - Moved from different state (%) - Multirace
Geographical mobility - Moved from different state (%) - Other Race
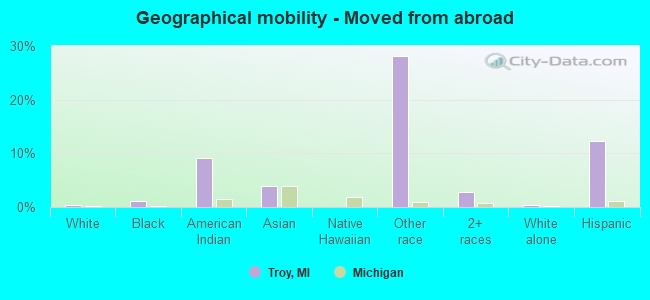
Geographical mobility - Moved from abroad (%)
Geographical mobility - Moved from abroad (%) - White
Geographical mobility - Moved from abroad (%) - Black or African American
Geographical mobility - Moved from abroad (%) - Asian
Geographical mobility - Moved from abroad (%) - Hispanic or Latino
Geographical mobility - Moved from abroad (%) - American Indian and Alaska Native
Geographical mobility - Moved from abroad (%) - Multirace
Geographical mobility - Moved from abroad (%) - Other Race
Place of birth for the foreign-born population - Ireland (%)
Place of birth for the foreign-born population - Denmark (%)
Place of birth for the foreign-born population - Norway (%)
Place of birth for the foreign-born population - Sweden (%)
Place of birth for the foreign-born population - United Kingdom (%)
Place of birth for the foreign-born population - England (%)
Place of birth for the foreign-born population - Scotland (%)
Place of birth for the foreign-born population - Other Northern Europe (%)
Place of birth for the foreign-born population - Austria (%)
Place of birth for the foreign-born population - Belgium (%)
Place of birth for the foreign-born population - France (%)
Place of birth for the foreign-born population - Germany (%)
Place of birth for the foreign-born population - Netherlands (%)
Place of birth for the foreign-born population - Switzerland (%)
Place of birth for the foreign-born population - Other Western Europe (%)
Place of birth for the foreign-born population - Greece (%)
Place of birth for the foreign-born population - Italy (%)
Place of birth for the foreign-born population - Portugal (%)
Place of birth for the foreign-born population - Spain (%)
Place of birth for the foreign-born population - Other Southern Europe (%)
Place of birth for the foreign-born population - Albania (%)
Place of birth for the foreign-born population - Belarus (%)
Place of birth for the foreign-born population - Bosnia and Herzegovina (%)
Place of birth for the foreign-born population - Bulgaria (%)
Place of birth for the foreign-born population - Croatia (%)
Place of birth for the foreign-born population - Czechoslovakia (%)
Place of birth for the foreign-born population - Hungary (%)
Place of birth for the foreign-born population - Latvia (%)
Place of birth for the foreign-born population - Lithuania (%)
Place of birth for the foreign-born population - North Macedonia (Macedonia) (%)
Place of birth for the foreign-born population - Moldova (%)
Place of birth for the foreign-born population - Poland (%)
Place of birth for the foreign-born population - Romania (%)
Place of birth for the foreign-born population - Russia (%)
Place of birth for the foreign-born population - Serbia (%)
Place of birth for the foreign-born population - Ukraine (%)
Place of birth for the foreign-born population - Other Eastern Europe (%)
Place of birth for the foreign-born population - China (%)
Place of birth for the foreign-born population - Hong Kong (%)
Place of birth for the foreign-born population - Taiwan (%)
Place of birth for the foreign-born population - Japan (%)
Place of birth for the foreign-born population - Korea (%)
Place of birth for the foreign-born population - Other Eastern Asia (%)
Place of birth for the foreign-born population - Afghanistan (%)
Place of birth for the foreign-born population - Bangladesh (%)
Place of birth for the foreign-born population - India (%)
Place of birth for the foreign-born population - Iran (%)
Place of birth for the foreign-born population - Kazakhstan (%)
Place of birth for the foreign-born population - Nepal (%)
Place of birth for the foreign-born population - Pakistan (%)
Place of birth for the foreign-born population - Sri Lanka (%)
Place of birth for the foreign-born population - Uzbekistan (%)
Place of birth for the foreign-born population - Other South Central Asia (%)
Place of birth for the foreign-born population - Burma (%)
Place of birth for the foreign-born population - Cambodia (%)
Place of birth for the foreign-born population - Indonesia (%)
Place of birth for the foreign-born population - Laos (%)
Place of birth for the foreign-born population - Malaysia (%)
Place of birth for the foreign-born population - Philippines (%)
Place of birth for the foreign-born population - Singapore (%)
Place of birth for the foreign-born population - Thailand (%)
Place of birth for the foreign-born population - Vietnam (%)
Place of birth for the foreign-born population - Other South Eastern Asia (%)
Place of birth for the foreign-born population - Armenia (%)
Place of birth for the foreign-born population - Iraq (%)
Place of birth for the foreign-born population - Israel (%)
Place of birth for the foreign-born population - Jordan (%)
Place of birth for the foreign-born population - Kuwait (%)
Place of birth for the foreign-born population - Lebanon (%)
Place of birth for the foreign-born population - Saudi Arabia (%)
Place of birth for the foreign-born population - Syria (%)
Place of birth for the foreign-born population - Turkey (%)
Place of birth for the foreign-born population - Yemen (%)
Place of birth for the foreign-born population - Other Western Asia (%)
Place of birth for the foreign-born population - Eritrea (%)
Place of birth for the foreign-born population - Ethiopia (%)
Place of birth for the foreign-born population - Kenya (%)
Place of birth for the foreign-born population - Somalia (%)
Place of birth for the foreign-born population - Uganda (%)
Place of birth for the foreign-born population - Zimbabwe (%)
Place of birth for the foreign-born population - Other Eastern Africa (%)
Place of birth for the foreign-born population - Cameroon (%)
Place of birth for the foreign-born population - Congo (%)
Place of birth for the foreign-born population - Democratic Republic of Congo (Zaire) (%)
Place of birth for the foreign-born population - Other Middle Africa (%)
Place of birth for the foreign-born population - Egypt (%)
Place of birth for the foreign-born population - Morocco (%)
Place of birth for the foreign-born population - Sudan (%)
Place of birth for the foreign-born population - Other Northern Africa (%)
Place of birth for the foreign-born population - South Africa (%)
Place of birth for the foreign-born population - Other Southern Africa (%)
Place of birth for the foreign-born population - Cabo Verde (%)
Place of birth for the foreign-born population - Ghana (%)
Place of birth for the foreign-born population - Liberia (%)
Place of birth for the foreign-born population - Nigeria (%)
Place of birth for the foreign-born population - Senegal (%)
Place of birth for the foreign-born population - Sierra Leone (%)
Place of birth for the foreign-born population - Other Western Africa (%)
Place of birth for the foreign-born population - Australia (%)
Place of birth for the foreign-born population - New Zealand (%)
Place of birth for the foreign-born population - Fiji (%)
Place of birth for the foreign-born population - Micronesia (%)
Place of birth for the foreign-born population - Bahamas (%)
Place of birth for the foreign-born population - Barbados (%)
Place of birth for the foreign-born population - Cuba (%)
Place of birth for the foreign-born population - Dominica (%)
Place of birth for the foreign-born population - Dominican Republic (%)
Place of birth for the foreign-born population - Grenada (%)
Place of birth for the foreign-born population - Haiti (%)
Place of birth for the foreign-born population - Jamaica (%)
Place of birth for the foreign-born population - St. Vincent and the Grenadines (%)
Place of birth for the foreign-born population - Trinidad and Tobago (%)
Place of birth for the foreign-born population - West Indies (%)
Place of birth for the foreign-born population - Other Caribbean (%)
Place of birth for the foreign-born population - Belize (%)
Place of birth for the foreign-born population - Costa Rica (%)
Place of birth for the foreign-born population - El Salvador (%)
Place of birth for the foreign-born population - Guatemala (%)
Place of birth for the foreign-born population - Honduras (%)
Place of birth for the foreign-born population - Mexico (%)
Place of birth for the foreign-born population - Nicaragua (%)
Place of birth for the foreign-born population - Panama (%)
Place of birth for the foreign-born population - Other Central America (%)
Place of birth for the foreign-born population - Argentina (%)
Place of birth for the foreign-born population - Bolivia (%)
Place of birth for the foreign-born population - Brazil (%)
Place of birth for the foreign-born population - Chile (%)
Place of birth for the foreign-born population - Colombia (%)
Place of birth for the foreign-born population - Ecuador (%)
Place of birth for the foreign-born population - Guyana (%)
Place of birth for the foreign-born population - Peru (%)
Place of birth for the foreign-born population - Uruguay (%)
Place of birth for the foreign-born population - Venezuela (%)
Place of birth for the foreign-born population - Other South America (%)
Place of birth for the foreign-born population - Canada (%)
Place of birth for the foreign-born population - Other Northern America (%)
Place of birth for the foreign-born population - Other (%)
Latest news about races in Troy, MI collected exclusively by city-data.com from local newspapers, TV, and radio stations
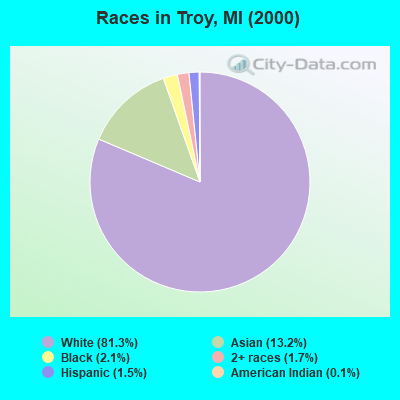
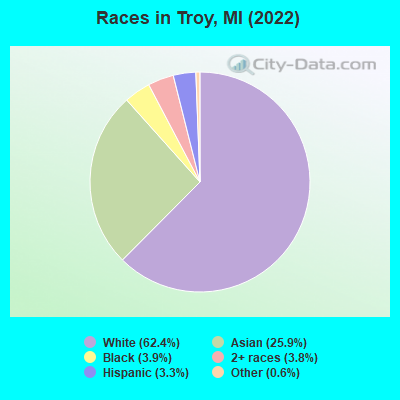
According to 2022 data, the most numerous races in Troy, MI are White alone (54,431 residents), Black alone (3,369 residents), and Hispanic (2,835 residents). 66.0% of Troy residents speak English at home. 29.3% of Troy, MI residents are foreign-born (22.2% born in Asia, 3.8% born in Europe), which is 79.5% greater than the foreign-born rate of 6.0% across the entire state of Michigan.
Race distribution in Troy
2000 2022
65,809 81.3% White alone 10,713 13.2% Asian alone 1,678 2.1% Black alone 1,373 1.7% Two or more races 1,184 1.5% Hispanic 79 0.10% Other race alone 105 0.1% American Indian alone 18 0.02% Native Hawaiian and Other
54,431 62.4% White alone 22,579 25.9% Asian alone 3,369 3.9% Black alone 3,352 3.8% Two or more races 2,835 3.3% Hispanic 556 0.6% Other race alone 60 0.07% American Indian alone
2000 2022
7,806,691 78.6% White alone 1,402,047 14.1% Black alone 323,877 3.3% Hispanic 175,311 1.8% Asian alone 163,487 1.6% Two or more races 53,421 0.5% American Indian alone 11,465 0.1% Other race alone 2,145 0.02% Native Hawaiian and Other
7,289,051 72.6% White alone 1,310,464 13.1% Black alone 572,405 5.7% Hispanic 450,031 4.5% Two or more races 335,732 3.3% Asian alone 45,217 0.5% Other race alone 29,011 0.3% American Indian alone 2,207 0.02% Native Hawaiian and Other
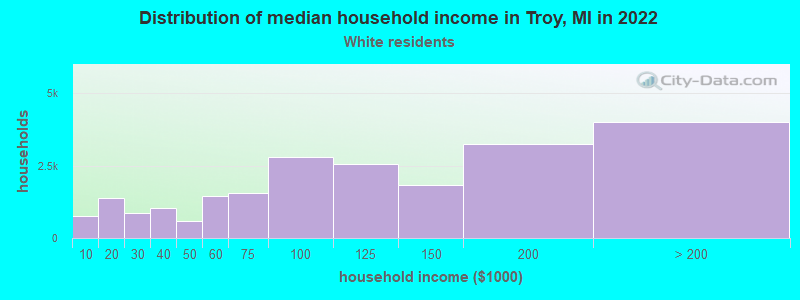
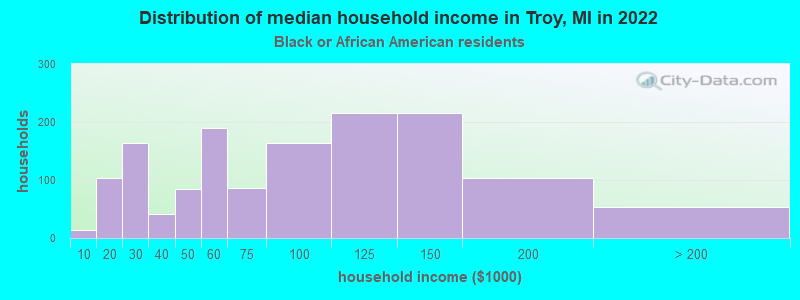
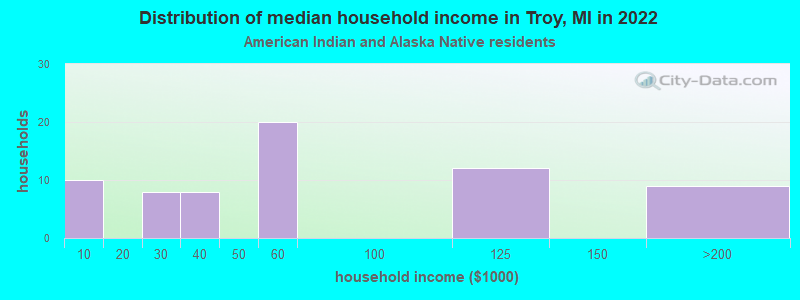
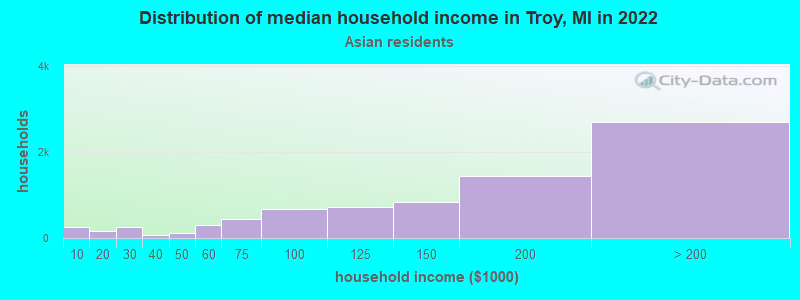
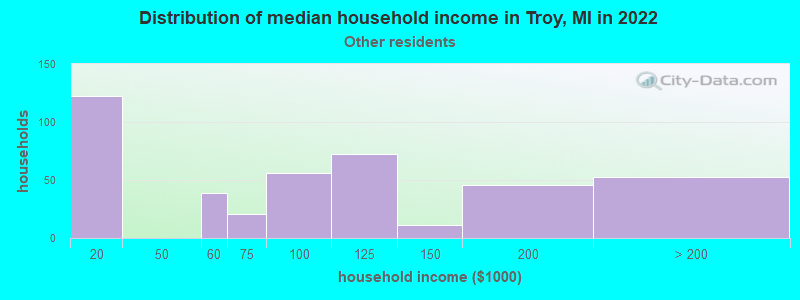
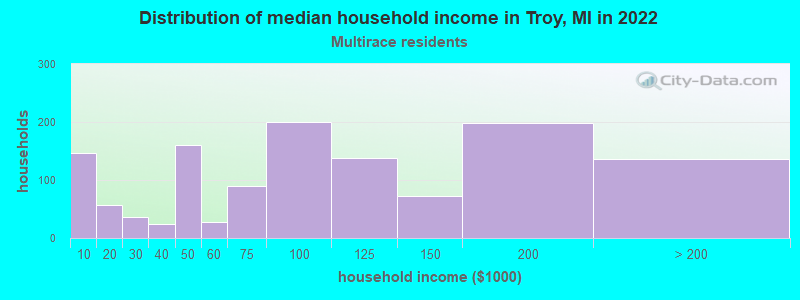
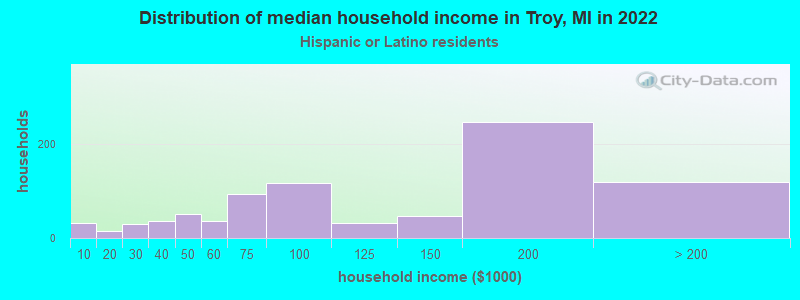
Income and house value in Troy Median household income in 2022 $104,506 White non-Hispanic householders$43,984 Black householders$152,954 Asian householders$91,263 Some other race householders$152,993 Two or more races householders$126,654 Hispanic or Latino race householdersMedian 2022 house value $377,831 White Non-Hispanic householders$436,294 Black or African American householders$213,086 American Indian or Alaska Native householders $429,663 Asian householders$196,332 Native Hawaiian and other Pacific Islander householders$610,812 Some other race householders$406,103 Two or more races householders$408,720 Hispanic or Latino householders
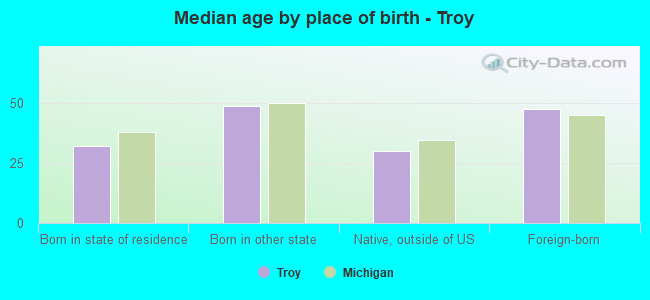
Median age by race in Troy
44.0 Median age for White residents41.4 45.6 40.8 Median age for Black or African American residents38.6 47.1 -666,666,666.0 Median age for American Indian / Alaska Native residents-666,666,666.0 -666,666,666.0 38.9 Median age for Asian residents38.9 39.1 -666,666,666.0 Median age for Native Hawaiian / Pacific Islander residents-666,666,666.0 -666,666,666.0 34.4 Median age for Other race residents34.8 33.8 18.9 Median age for Two or more races residents17.1 32.1 44.2 Median age for White alone residents41.8 45.8 33.2 Median age for Hispanic or Latino residents33.1 34.1
Owner/renter occupied households by race in Troy
House owners and renters - White residents 17,564 79.4% Owner occupied4,543 20.6% Renter occupiedHouse owners and renters - Black or African American residents 709 51.1% Owner occupied678 48.9% Renter occupiedHouse owners and renters - American Indian / Alaska Native residents 27 43.0% Owner occupied35 57.0% Renter occupiedHouse owners and renters - Asian residents 5,676 72.5% Owner occupied2,157 27.5% Renter occupiedHouse owners and renters - Native Hawaiian / Pacific Islander residents 10 100.0% Renter occupiedHouse owners and renters - Other race residents 200 46.0% Owner occupied235 54.0% Renter occupiedHouse owners and renters - Two or more races residents 622 63.3% Owner occupied361 36.7% Renter occupiedHouse owners and renters - White alone residents 17,564 79.4% Owner occupied4,543 20.6% Renter occupiedHouse owners and renters - Hispanic or Latino residents 377 40.9% Owner occupied545 59.1% Renter occupied
Language usage in Troy
English speakers - Total 66.0% of residents of Troy speak English at home.
2.1% of residents speak Spanish at home 1,273 74.6% Speak English very well434 25.4% Speak English less than very well31.9% of residents speak other language at home 18,250 68.9% Speak English very well8,246 31.1% Speak English less than very well
English speakers - Born in the United States 90.6% of residents of Troy speak English at home.
9.4% of residents speak other language at home 807 84.2% Speak English very well151 15.8% Speak English less than very well
English speakers - Native, born elsewhere 65.1% of residents of Troy speak English at home.
3.9% of residents speak Spanish at home 25 100.0% Speak English very well31.0% of residents speak other language at home 198 100.0% Speak English very well
English speakers - Foreign-born 18.2% of residents of Troy speak English at home.
5.1% of residents speak Spanish at home 1,066 74.0% Speak English very well374 26.0% Speak English less than very well76.8% of residents speak other language at home 14,330 65.7% Speak English very well7,467 34.3% Speak English less than very well
White (Caucasian) - Speak only English Native:
93.7% (40,804)Foreign-born:
26.7% (2,432)
White (Caucasian) - Speak another language Native:
6.3% (2,741)Foreign-born:
73.3% (6,672)
Black or African American - Speak only English Native:
96.7% (3,001)Foreign-born:
26.0% (96)
Black or African American - Speak another language Native:
3.2% (101)Foreign-born:
73.9% (273)
American Indian / Alaska Native - Speak another language Native:
28.2% (41)Foreign-born:
100.0% (23)
Asian - Speak only English Native:
50.9% (1,968)Foreign-born:
14.6% (2,570)
Asian - Speak another language Native:
49.1% (1,899)Foreign-born:
85.4% (15,088)
Other race - Speak only English Native:
80.2% (315)Foreign-born:
18.3% (164)
Other race - Speak another language Native:
14.9% (59)Foreign-born:
61.7% (554)
Two or more races - Speak only English Native:
93.4% (3,011)Foreign-born:
8.0% (74)
Two or more races - Speak another language Native:
6.5% (210)Foreign-born:
92.8% (858)
White alone - Speak only English Native:
93.7% (40,503)Foreign-born:
26.7% (2,411)
White alone - Speak another language Native:
6.3% (2,741)Foreign-born:
73.3% (6,623)
Hispanic or Latino - Speak only English Native:
90.3% (920)Foreign-born:
1.4% (21)
Hispanic or Latino - Speak another language Native:
9.7% (99)Foreign-born:
98.6% (1,504)
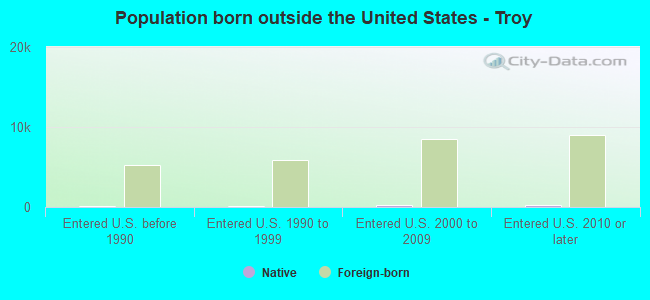
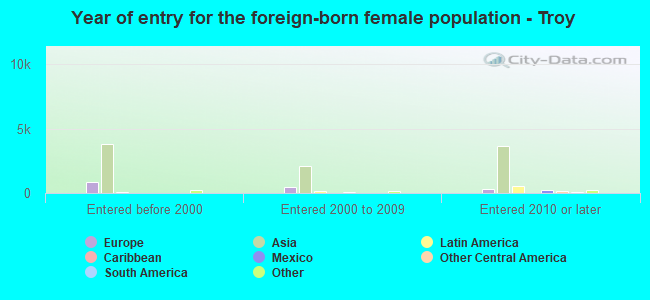
Foreign-born residents in Troy 25,514 residents are foreign born (22.2% Asia , 3.8% Europe ).
This city:
29.3%Michigan:
6.9%
Marital status for residents in Troy Marital status - White (Caucasian) population 15 years and over
Males 36.4% Never married51.4% Now married0.3% Separated4.6% Widowed7.3% DivorcedFemales 26.8% Never married50.7% Now married0.0% Separated10.5% Widowed12.0% DivorcedWomen who gave birth in the past 12 months Now married:
90.1% (525)Unmarried:
9.9% (58)
Women who did not give birth in the past 12 months Now married:
36.6% (3,769)Unmarried:
63.4% (6,534)
Marital status - Black or African American population 15 years and over
Males 51.1% Never married36.9% Now married0.0% Separated0.0% Widowed12.0% DivorcedFemales 52.0% Never married23.8% Now married0.0% Separated16.4% Widowed7.8% DivorcedWomen who gave birth in the past 12 months Now married:
78.4% (37)Unmarried:
21.6% (10)
Women who did not give birth in the past 12 months Now married:
20.4% (169)Unmarried:
79.6% (661)
Marital status - American Indian / Alaska Native population 15 years and over
Males 30.4% Never married27.8% Now married0.0% Separated0.0% Widowed41.8% DivorcedFemales 22.0% Never married48.8% Now married0.0% Separated29.3% Widowed0.0% DivorcedWomen who did not give birth in the past 12 months Now married:
62.5% (15)Unmarried:
37.5% (9)
Marital status - Asian population 15 years and over
Males 24.1% Never married72.8% Now married0.9% Separated1.7% Widowed0.5% DivorcedFemales 19.8% Never married65.6% Now married0.0% Separated8.2% Widowed6.4% DivorcedWomen who gave birth in the past 12 months Now married:
89.5% (323)Unmarried:
10.5% (38)
Women who did not give birth in the past 12 months Now married:
62.2% (3,815)Unmarried:
37.8% (2,316)
Marital status - Other race population 15 years and over
Males 35.1% Never married58.3% Now married0.0% Separated0.0% Widowed6.7% DivorcedFemales 15.9% Never married30.2% Now married0.0% Separated50.9% Widowed3.1% DivorcedWomen who gave birth in the past 12 months Now married:
100.0% (13)Unmarried:
0.0% (0)
Women who did not give birth in the past 12 months Now married:
65.7% (193)Unmarried:
34.3% (101)
Marital status - Two or more races population 15 years and over
Males 41.8% Never married48.7% Now married0.0% Separated0.9% Widowed8.6% DivorcedFemales 49.1% Never married42.6% Now married0.0% Separated4.2% Widowed4.1% DivorcedWomen who gave birth in the past 12 months Now married:
63.6% (29)Unmarried:
36.4% (17)
Women who did not give birth in the past 12 months Now married:
35.0% (451)Unmarried:
65.0% (837)
Marital status - White alone, not Hispanic / Latino population 15 years and over
Males 35.9% Never married51.8% Now married0.3% Separated4.6% Widowed7.3% DivorcedFemales 26.8% Never married50.6% Now married0.0% Separated10.6% Widowed12.0% DivorcedWomen who gave birth in the past 12 months Now married:
89.3% (482)Unmarried:
10.7% (58)
Women who did not give birth in the past 12 months Now married:
36.7% (3,769)Unmarried:
63.3% (6,504)
Marital status - Hispanic or Latino population 15 years and over
Males 46.2% Never married42.3% Now married0.0% Separated1.5% Widowed10.1% DivorcedFemales 26.7% Never married58.4% Now married0.0% Separated5.6% Widowed9.3% DivorcedWomen who gave birth in the past 12 months Now married:
70.7% (31)Unmarried:
29.3% (13)
Women who did not give birth in the past 12 months Now married:
61.7% (346)Unmarried:
38.3% (215)
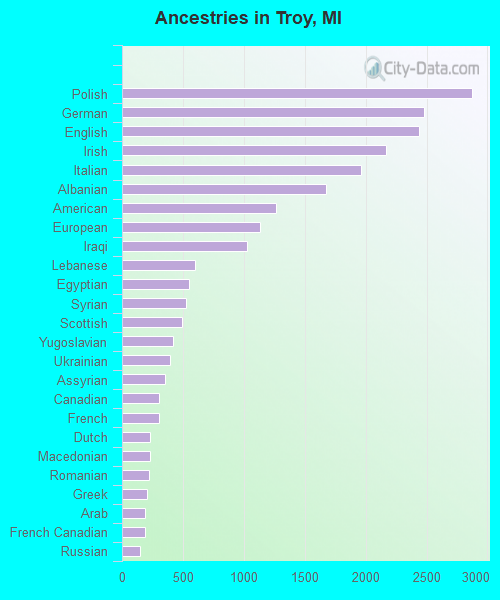
Ancestries in Troy
2,869 6.0% Polish2,475 5.1% German2,437 5.1% English2,169 4.5% Irish1,965 4.1% Italian1,676 3.5% Albanian1,265 2.6% American1,131 2.4% European1,024 2.1% Iraqi598 1.2% Lebanese551 1.1% Egyptian524 1.1% Syrian491 1.0% Scottish417 0.9% Yugoslavian394 0.8% Ukrainian356 0.7% Assyrian307 0.6% Canadian302 0.6% French230 0.5% Dutch228 0.5% Macedonian219 0.5% Romanian209 0.4% Greek191 0.4% Arab186 0.4% French Canadian149 0.3% Russian149 0.3% Soviet Union137 0.3% Armenian134 0.3% Hungarian132 0.3% Liberian113 0.2% Scotch-Irish112 0.2% Belgian104 0.2% Turkish98 0.2% African94 0.2% Eastern European93 0.2% Brazilian83 0.2% Serbian83 0.2% Finnish83 0.2% Swedish75 0.2% Austrian72 0.1% Iranian72 0.1% Swiss61 0.1% Norwegian58 0.1% Jamaican48 0.10% Lithuanian46 0.10% Croatian46 0.10% Barbadian42 0.09% Slovak36 0.07% British34 0.07% Maltese29 0.06% Danish27 0.06% Welsh24 0.05% Australian24 0.05% Slovene22 0.05% Jordanian21 0.04% Palestinian21 0.04% Cypriot19 0.04% Scandinavian18 0.04% Portuguese13 0.03% Nigerian10 0.02% Czechoslovakian8 0.02% Bulgarian6 0.01% Slavic4 0.01% Czech4 0.01% Northern European
Geographical mobility in Troy Same house 1 year ago 48,378 89.0% White (Caucasian)3,267 93.6% Black or African American91 64.3% American Indian / Alaska Native20,498 91.2% Asian11 100.0% Native Hawaiian / Pacific Islander1,054 74.6% Other race3,928 85.3% Two or more races48,149 89.2% White alone, not Hispanic / Latino1,657 70.7% Hispanic or LatinoMoved within same county 2,486 4.6% White / Caucasian5 0.1% Black or African American14 9.6% American Indian / Alaska Native335 1.5% Asian22 1.6% Other race166 3.6% Two or more races2,486 4.6% White alone, not Hispanic / Latino158 6.7% Hispanic or LatinoMoved within same state 2,685 4.9% White / Caucasian179 5.1% Black or African American17 11.8% American Indian / Alaska Native673 3.0% Asian296 6.4% Two or more races2,543 4.7% White alone, not Hispanic / Latino259 11.0% Hispanic or LatinoMoved from different state 599 1.1% White / Caucasian99 0.4% Asian18 1.3% Other race158 3.4% Two or more races599 1.1% White alone, not Hispanic / Latino23 1.0% Hispanic or LatinoMoved from abroad 215 0.4% White40 1.1% Black or African American13 9.2% American Indian / Alaska Native866 3.9% Asian398 28.2% Other race130 2.8% Two or more races215 0.4% White alone, not Hispanic / Latino290 12.4% Hispanic or Latino
Children Nativity (place of birth) in Troy
Children under 6 years - Living with two parents Both parents native 2,276 100.0% NativeBoth parents foreign-born 1,640 83.5% Native324 16.5% Foreign-bornOne native, one foreign-born parent 278 100.0% NativeChildren under 6 years - Living with one parent Native parent 405 100.0% NativeForeign-born parent 50 100.0% NativeChildren 6 to 17 years - Living with two parents Both parents native 4,249 100.0% NativeBoth parents foreign-born 3,601 66.5% Native1,813 33.5% Foreign-bornOne native, one foreign-born parent 560 100.0% NativeChildren 6 to 17 years - Living with one parent Native parent 1,972 100.0% NativeForeign-born parent 681 50.0% Native681 50.0% Foreign-born
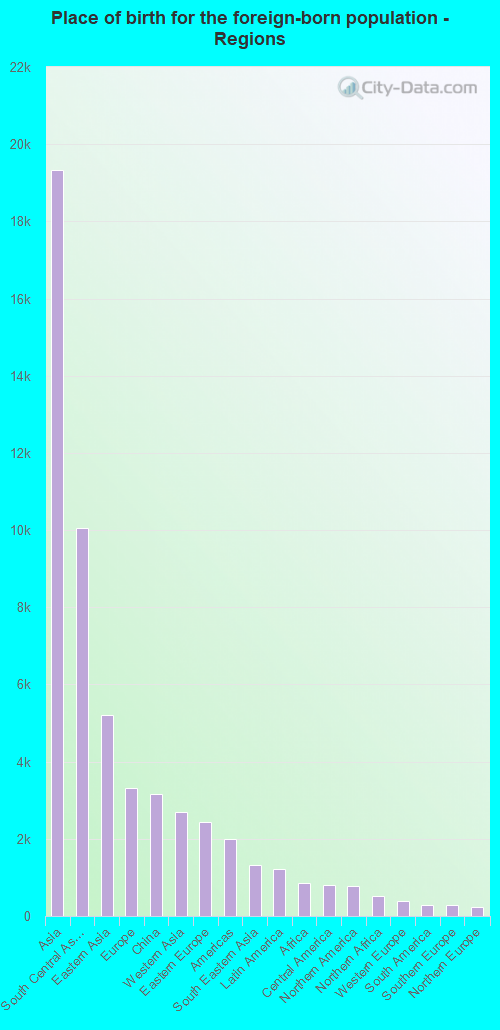
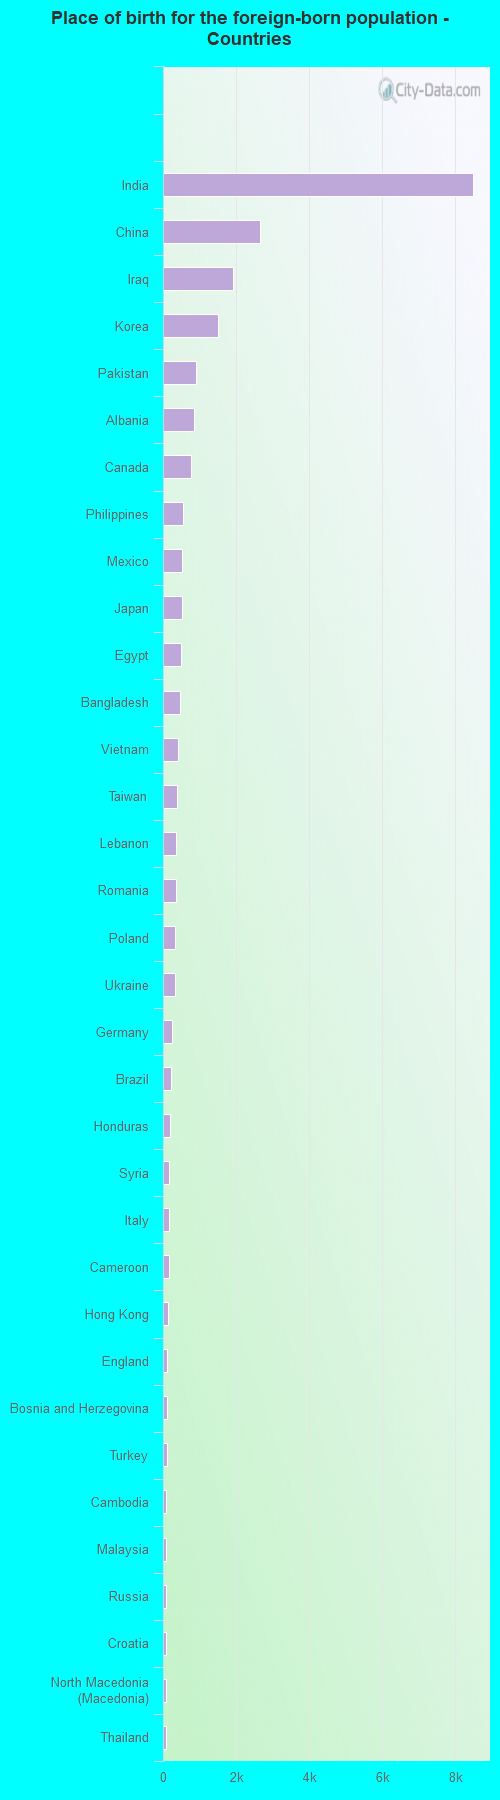
Place of birth for residents in Troy 19,329 Asia10,055 South Central Asia5,204 Eastern Asia3,328 Europe3,167 China2,705 Western Asia2,438 Eastern Europe2,002 Americas1,316 South Eastern Asia1,222 Latin America843 Africa807 Central America780 Northern America506 Northern Africa382 Western Europe294 South America274 Southern Europe234 Northern Europe151 Middle Africa121 Caribbean91 Eastern Africa43 Western Africa33 Southern Africa10 Oceania10 Australia and New Zealand Subregion8,505 India2,648 China1,921 Iraq1,494 Korea911 Pakistan858 Albania780 Canada542 Philippines528 Mexico526 Japan490 Egypt475 Bangladesh416 Vietnam395 Taiwan363 Lebanon350 Romania342 Poland319 Ukraine257 Germany211 Brazil187 Honduras177 Syria154 Italy151 Cameroon124 Hong Kong121 England117 Bosnia and Herzegovina101 Turkey90 Cambodia89 Malaysia89 Russia89 Croatia82 North Macedonia (Macedonia)78 Thailand72 United Kingdom72 Costa Rica64 United Arab Emirates62 Burma (Myanmar)60 Nepal56 France52 Greece50 Iran46 Kenya43 Ethiopia39 Haiti39 Serbia36 Sri Lanka33 South Africa31 Colombia30 Jamaica29 Belgium28 Austria23 Belarus22 Kuwait21 Dominican Republic20 Israel19 Norway18 Singapore18 Kazakhstan18 Senegal17 Bulgaria16 Liberia16 Argentina13 Uruguay12 Netherlands12 Laos12 Sweden12 Jordan12 Guatemala11 Saudi Arabia11 Bahamas10 Spain10 Scotland10 Australia10 Cuba9 Indonesia9 Morocco9 Nigeria8 El Salvador8 Ecuador8 Peru7 Algeria7 Venezuela4 Czechoslovakia2 Uganda
Grandparents responsible for own grandchildren in Troy
Grandparents (30 to 59 years) White / Caucasian 13 16.5% Responsible for grandchildren68 83.5% Not responsible for grandchildrenAsian 14 100.0% Not responsible for grandchildrenTwo or more races 21 100.0% Not responsible for grandchildrenWhite alone, not Hispanic / Latino 14 16.8% Responsible for grandchildren69 83.2% Not responsible for grandchildrenHispanic or Latino 13 100.0% Not responsible for grandchildrenGrandparents (60 years and over) White / Caucasian 68 11.7% Responsible for grandchildren510 88.3% Not responsible for grandchildrenAsian 46 8.7% Responsible for grandchildren482 91.3% Not responsible for grandchildrenWhite alone, not Hispanic / Latino 71 12.1% Responsible for grandchildren515 87.9% Not responsible for grandchildrenHispanic or Latino 11 100.0% Not responsible for grandchildren