Estimated zip code population in 2022: 20,496 Zip code population in 2010: 19,582 Zip code population in 2000: 44,978
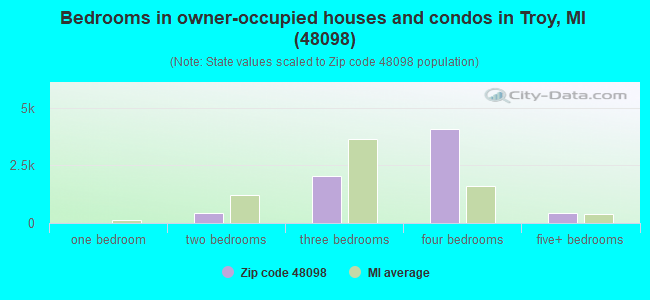
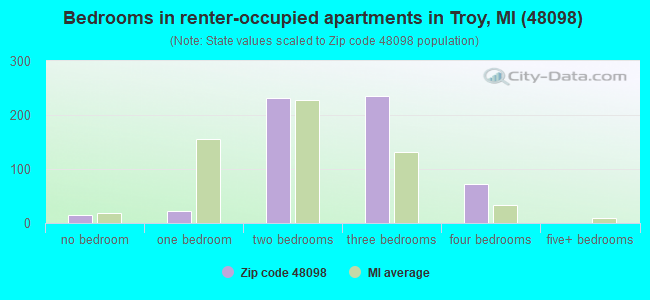
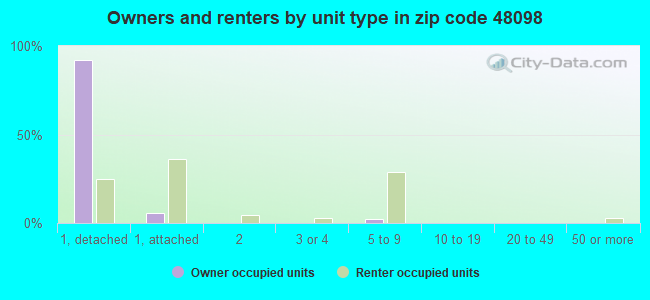
Houses and condos: 7,900 Renter-occupied apartments: 582
% of renters here:
8%
State:
27%
March 2022 cost of living index in zip code 48098: 98.2 (near average, U.S. average is 100)
Land area: 9.4 sq. mi. Water area: 0.0 sq. mi.
Population density: 2,182 people per square mile
(low).
OSM Map
General Map
Google Map
MSN Map
OSM Map
General Map
Google Map
MSN Map
OSM Map
General Map
Google Map
MSN Map
OSM Map
General Map
Google Map
MSN Map
Please wait while loading the map...
Real estate property taxes paid for housing units in 2022:
This zip code:
1.3% ($6,612)
Michigan:
1.2% ($2,746)
Median real estate property taxes paid for housing units with mortgages in 2022: $7,117 (1.3%) Median real estate property taxes paid for housing units with no mortgage in 2022: $6,071 (1.2%)
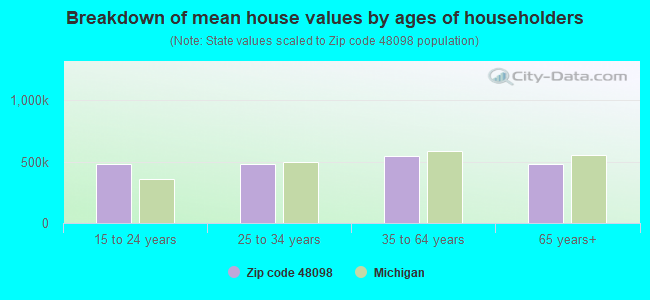
Estimated median house/condo value in 2022: $522,001
48098:
$522,001
Michigan:
$224,400
According to our research of Michigan and other state lists, there were 4 registered sex offenders living in 48098 zip code as of May 13, 2024. The ratio of all residents to sex offenders in zip code 48098 is 4,910 to 1. The ratio of registered sex offenders to all residents in this zip code is much lower than the state average.
Median resident age:
This zip code:
46.8 years
Michigan median age:
40.3 years
Average household size:
This zip code:
2.7 people
Michigan:
2.4 people
Averages for the 2020 tax year for zip code 48098, filed in 2021:
Average Adjusted Gross Income (AGI) in 2020: $155,042 (Individual Income Tax Returns)
Here:
$155,042
State:
$68,945
Salary/wage: $126,672 (reported on 77.3% of returns)
Here:
$126,672
State:
$57,142
(% of AGI for various income ranges: 1026.4% for AGIs below $25k, 3326.9% for AGIs $25k-50k, 6098.0% for AGIs $50k-75k, 9210.2% for AGIs $75k-100k, 18647.2% for AGIs $100k-200k, 95190.0% for AGIs over 200k)
Taxable interest for individuals: $3,424 (reported on 54.5% of returns)
This zip code:
$3,424
Michigan:
$1,630
(% of AGI for various income ranges: 33.5% for AGIs below $25k, 78.8% for AGIs $25k-50k, 129.8% for AGIs $50k-75k, 165.1% for AGIs $75k-100k, 278.4% for AGIs $100k-200k, 1928.7% for AGIs over 200k)
Ordinary dividends: $9,670 (reported on 46.8% of returns)
Here:
$9,670
State:
$6,972
(% of AGI for various income ranges: 79.4% for AGIs below $25k, 141.4% for AGIs $25k-50k, 250.0% for AGIs $50k-75k, 440.0% for AGIs $75k-100k, 703.6% for AGIs $100k-200k, 4716.3% for AGIs over 200k)
Net capital gain/loss in AGI: +$26,487 (reported on 45.2% of returns)
Here:
+$26,487
State:
+$20,064
(% of AGI for various income ranges: 30.7% for AGIs below $25k, 117.8% for AGIs $25k-50k, 252.2% for AGIs $50k-75k, 397.8% for AGIs $75k-100k, 942.5% for AGIs $100k-200k, 16196.2% for AGIs over 200k)
Profit/loss from business: +$24,521 (reported on 17.7% of returns)
Here:
+$24,521
State:
+$11,172
(% of AGI for various income ranges: 155.5% for AGIs below $25k, 274.1% for AGIs $25k-50k, 324.4% for AGIs $50k-75k, 437.1% for AGIs $75k-100k, 552.2% for AGIs $100k-200k, 4351.1% for AGIs over 200k)
Taxable individual retirement arrangement distribution: $34,983 (reported on 15.6% of returns)
48098:
$34,983
Michigan:
$19,803
(% of AGI for various income ranges: 83.2% for AGIs below $25k, 238.2% for AGIs $25k-50k, 452.5% for AGIs $50k-75k, 738.8% for AGIs $75k-100k, 1644.2% for AGIs $100k-200k, 3544.3% for AGIs over 200k)
Self-employed (Keogh) retirement plans: $30,311 (reported on 1.8% of returns)
48098:
$30,311
Michigan:
$25,132
(% of AGI for various income ranges: 76.6% for AGIs $100k-200k, 698.3% for AGIs over 200k)
Total itemized deductions: $35,191 (reported on 14.7% of returns)
Here:
$35,191
State:
$34,117
(% of AGI for various income ranges: 84.8% for AGIs below $25k, 212.7% for AGIs $25k-50k, 519.4% for AGIs $50k-75k, 809.2% for AGIs $75k-100k, 1020.5% for AGIs $100k-200k, 4363.0% for AGIs over 200k)
Charity contributions: $12,130 (reported on 12.9% of returns)
Here:
$12,130
State:
$13,548
(% of AGI for various income ranges: 3.6% for AGIs below $25k, 16.9% for AGIs $25k-50k, 65.3% for AGIs $50k-75k, 100.6% for AGIs $75k-100k, 233.2% for AGIs $100k-200k, 1797.1% for AGIs over 200k)
Taxes paid: $9,024 (reported on 14.7% of returns)
48098:
$9,024
State:
$7,972
(% of AGI for various income ranges: 17.3% for AGIs below $25k, 46.5% for AGIs $25k-50k, 126.6% for AGIs $50k-75k, 232.0% for AGIs $75k-100k, 317.8% for AGIs $100k-200k, 1001.6% for AGIs over 200k)
Earned income credit: $1,477 (reported on 3.9% of returns)
Here:
$1,477
State:
$2,251
(% of AGI for various income ranges: 27.0% for AGIs below $25k, 30.9% for AGIs $25k-50k)
Percentage of individuals using paid preparers for their 2020 taxes: 91.2%
Here:
91%
State:
93%
(% for various income ranges: 90.2% for AGIs below $25k, 89.7% for AGIs $25k-50k, 92.9% for AGIs $50k-75k, 89.9% for AGIs $75k-100k, 91.0% for AGIs $100k-200k, 93.2% for AGIs over 200k)
Averages for the 2012 tax year for zip code 48098, filed in 2013:
Average Adjusted Gross Income (AGI) in 2012: $124,117 (Individual Income Tax Returns)
Here:
$124,117
State:
$55,609
Salary/wage: $101,680 (reported on 80.1% of returns)
Here:
$101,680
State:
$46,782
(% of AGI for various income ranges: 71.9% for AGIs below $25k, 65.7% for AGIs $25k-50k, 61.6% for AGIs $50k-75k, 64.6% for AGIs $75k-100k, 74.3% for AGIs $100k-200k, 61.4% for AGIs over 200k)
Taxable interest for individuals: $2,249 (reported on 57.3% of returns)
This zip code:
$2,249
Michigan:
$1,491
(% of AGI for various income ranges: 2.9% for AGIs below $25k, 1.7% for AGIs $25k-50k, 1.8% for AGIs $50k-75k, 1.2% for AGIs $75k-100k, 0.8% for AGIs $100k-200k, 0.9% for AGIs over 200k)
Ordinary dividends: $6,910 (reported on 45.7% of returns)
Here:
$6,910
State:
$6,225
(% of AGI for various income ranges: 5.3% for AGIs below $25k, 3.1% for AGIs $25k-50k, 3.4% for AGIs $50k-75k, 2.5% for AGIs $75k-100k, 2.0% for AGIs $100k-200k, 2.6% for AGIs over 200k)
Net capital gain/loss in AGI: +$14,627 (reported on 41.1% of returns)
Here:
+$14,627
State:
+$9,326
(% of AGI for various income ranges: 0.6% for AGIs $50k-75k, 0.4% for AGIs $75k-100k, 0.8% for AGIs $100k-200k, 8.4% for AGIs over 200k)
Profit/loss from business: +$23,718 (reported on 16.9% of returns)
Here:
+$23,718
State:
+$11,523
(% of AGI for various income ranges: 7.9% for AGIs below $25k, 3.6% for AGIs $25k-50k, 4.0% for AGIs $50k-75k, 3.1% for AGIs $75k-100k, 2.9% for AGIs $100k-200k, 3.2% for AGIs over 200k)
Taxable individual retirement arrangement distribution: $23,722 (reported on 17.0% of returns)
48098:
$23,722
Michigan:
$15,298
(% of AGI for various income ranges: 5.3% for AGIs below $25k, 5.2% for AGIs $25k-50k, 6.2% for AGIs $50k-75k, 5.9% for AGIs $75k-100k, 4.3% for AGIs $100k-200k, 1.9% for AGIs over 200k)
Self-employment retirement plans: $23,154 (reported on 2.4% of returns)
48098:
$23,154
Michigan:
$20,834
(% of AGI for various income ranges: 0.5% for AGIs $50k-75k, 0.3% for AGIs $100k-200k, 0.6% for AGIs over 200k)
Total itemized deductions: $29,355 (15% of AGI, reported on 55.1% of returns)
Here:
$29,355
State:
$21,628
Here:
14.9% of AGI
State:
18.4% of AGI
(% of AGI for various income ranges: 19.3% for AGIs below $25k, 15.9% for AGIs $25k-50k, 17.1% for AGIs $50k-75k, 16.5% for AGIs $75k-100k, 15.3% for AGIs $100k-200k, 10.6% for AGIs over 200k)
Charity contributions: $4,386 (reported on 50.4% of returns)
Here:
$4,386
State:
$4,225
(% of AGI for various income ranges: 1.1% for AGIs below $25k, 1.5% for AGIs $25k-50k, 2.3% for AGIs $50k-75k, 2.2% for AGIs $75k-100k, 2.1% for AGIs $100k-200k, 1.6% for AGIs over 200k)
Taxes paid: $14,232 (reported on 55.0% of returns)
48098:
$14,232
State:
$8,327
(% of AGI for various income ranges: 4.6% for AGIs below $25k, 4.9% for AGIs $25k-50k, 6.1% for AGIs $50k-75k, 6.7% for AGIs $75k-100k, 7.1% for AGIs $100k-200k, 6.0% for AGIs over 200k)
Earned income credit: $1,670 (reported on 4.6% of returns)
Here:
$1,670
State:
$2,306
(% of AGI for various income ranges: 2.0% for AGIs below $25k, 0.5% for AGIs $25k-50k)
Percentage of individuals using paid preparers for their 2012 taxes: 56.3%
Here:
56%
State:
57%
(% for various income ranges: 49.8% for AGIs below $25k, 56.2% for AGIs $25k-50k, 60.0% for AGIs $50k-75k, 58.8% for AGIs $75k-100k, 53.0% for AGIs $100k-200k, 70.7% for AGIs over 200k)
Averages for the 2004 tax year for zip code 48098, filed in 2005:
Average Adjusted Gross Income (AGI) in 2004: $98,194 (Individual Income Tax Returns)
Here:
$98,194
State:
$48,204
Salary/wage: $86,438 (reported on 83.3% of returns)
Here:
$86,438
State:
$42,791
(% of AGI for various income ranges: 277.2% for AGIs below $10k, 63.2% for AGIs $10k-25k, 64.4% for AGIs $25k-50k, 65.6% for AGIs $50k-75k, 73.2% for AGIs $75k-100k, 74.0% for AGIs over 100k)
Taxable interest for individuals: $2,855 (reported on 72.4% of returns)
This zip code:
$2,855
Michigan:
$1,725
(% of AGI for various income ranges: 18.7% for AGIs below $10k, 5.9% for AGIs $10k-25k, 3.8% for AGIs $25k-50k, 2.8% for AGIs $50k-75k, 2.1% for AGIs $75k-100k, 1.8% for AGIs over 100k)
Taxable dividends: $4,095 (reported on 55.0% of returns)
Here:
$4,095
State:
$3,420
(% of AGI for various income ranges: 24.4% for AGIs below $10k, 4.6% for AGIs $10k-25k, 3.3% for AGIs $25k-50k, 2.9% for AGIs $50k-75k, 2.0% for AGIs $75k-100k, 2.1% for AGIs over 100k)
Net capital gain/loss: +$8,801 (reported on 47.4% of returns)
Here:
+$8,801
State:
+$8,532
(% of AGI for various income ranges: -3.2% for AGIs below $10k, 0.0% for AGIs $10k-25k, 0.8% for AGIs $25k-50k, 0.9% for AGIs $50k-75k, 1.1% for AGIs $75k-100k, 5.3% for AGIs over 100k)
Profit/loss from business: +$21,739 (reported on 15.7% of returns)
Here:
+$21,739
State:
+$9,547
(% of AGI for various income ranges: 4.3% for AGIs below $10k, 6.4% for AGIs $10k-25k, 3.4% for AGIs $25k-50k, 3.5% for AGIs $50k-75k, 3.3% for AGIs $75k-100k, 3.4% for AGIs over 100k)
IRA payment deduction: $3,474 (reported on 4.1% of returns)
48098:
$3,474
Michigan:
$2,875
(% of AGI for various income ranges: 1.0% for AGIs below $10k, 0.5% for AGIs $10k-25k, 0.4% for AGIs $25k-50k, 0.4% for AGIs $50k-75k, 0.3% for AGIs $75k-100k, 0.1% for AGIs over 100k)
Self-employed pension: $17,231 (reported on 2.5% of returns)
Here:
$17,231
Michigan:
$13,826
(% of AGI for various income ranges: 0.2% for AGIs $10k-25k, 0.2% for AGIs $50k-75k, 0.3% for AGIs $75k-100k, 0.5% for AGIs over 100k)
Total itemized deductions: $25,931 (17% of AGI, reported on 58.0% of returns)
Here:
$25,931
State:
$18,509
Here:
17.0% of AGI
State:
20.7% of AGI
(% of AGI for various income ranges: 36.7% for AGIs below $10k, 20.3% for AGIs $10k-25k, 19.4% for AGIs $25k-50k, 20.9% for AGIs $50k-75k, 20.4% for AGIs $75k-100k, 13.8% for AGIs over 100k)
Charity contributions deductions: $4,219 (3% of AGI, reported on 54.5% of returns)
Here:
$4,219
State:
$3,365
Here:
2.7% of AGI
State:
3.6% of AGI
(% of AGI for various income ranges: 1.8% for AGIs below $10k, 1.6% for AGIs $10k-25k, 2.4% for AGIs $25k-50k, 2.7% for AGIs $50k-75k, 2.8% for AGIs $75k-100k, 2.3% for AGIs over 100k)
Total tax: $20,617 (reported on 82.0% of returns)
48098:
$20,617
State:
$7,691
(% of AGI for various income ranges: 7.3% for AGIs below $10k, 5.2% for AGIs $10k-25k, 7.8% for AGIs $25k-50k, 9.1% for AGIs $50k-75k, 10.0% for AGIs $75k-100k, 19.7% for AGIs over 100k)
Earned income credit: $1,254 (reported on 2.4% of returns)
Here:
$1,254
State:
$1,737
Percentage of individuals using paid preparers for their 2004 taxes: 55.3%
Here:
55%
State:
60%
(% for various income ranges: 49.1% for AGIs below $10k, 55.4% for AGIs $10k-25k, 57.4% for AGIs $25k-50k, 59.4% for AGIs $50k-75k, 54.3% for AGIs $75k-100k, 57.6% for AGIs over 100k)
Likely homosexual households (counted as self-reported same-sex unmarried-partner households)
Lesbian couples: 0.1% of all households
Gay men: 0.2% of all households
Household received Food Stamps/SNAP in the past 12 months: 146 Household did not receive Food Stamps/SNAP in the past 12 months: 7,282
Women who had a birth in the past 12 months: 235 (226 now married, 14 unmarried) Women who did not have a birth in the past 12 months: 3,764 (1,772 now married, 1,985 unmarried)
Housing units in zip code 48098 with a mortgage: 4,148 (667 second mortgage, 7 home equity loan, 585 both second mortgage and home equity loan) Houses without a mortgage: 173
Median monthly owner costs for units with a mortgage: $2,634 Median monthly owner costs for units without a mortgage: $952
Residents with income below the poverty level in 2022:
This zip code:
4.4%
Whole state:
13.4%
Residents with income below 50% of the poverty level in 2022:
This zip code:
1.4%
Whole state:
6.9%
Median number of rooms in houses and condos:
Here:
8.2
State:
6.5
Median number of rooms in apartments:
Here:
5.4
State:
4.3
Notable locations in this zip code not listed on our city pages
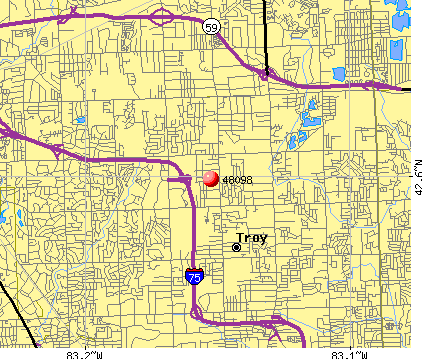
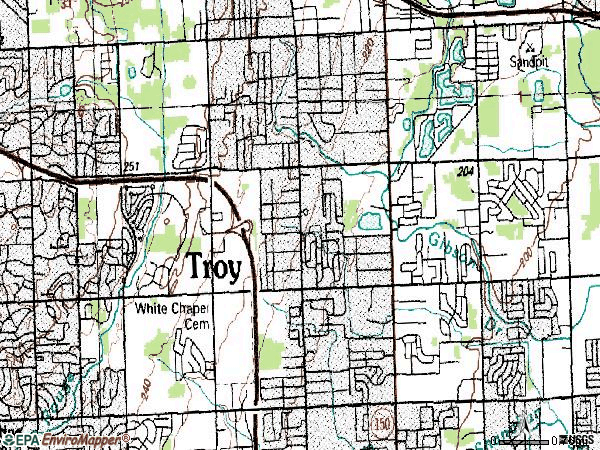
Notable locations in zip code 48098: Troy Museum and Historic Village (A), Troy Chamber of Commerce (B), Troy Fire Department Station 6 (C). Display/hide their locations on the map
Churches in zip code 48098 include: Church of the New Jerusalem (A), Fellowship Church (B), Saint Augustine Church (C), American Church (D), Saint Stephens Church (E). Display/hide their locations on the map
Parks in zip code 48098 include: Historic Green Historical Marker (1), The Polar Bears Historical Marker (2), Troy Corners Historical Marker (3), Beach Road Park (4), North Glen Park (5), Firefighters Park (6), Lloyd A Stage Nature Center (7), Troy Farm Park (8). Display/hide their locations on the map
In group quarters: 89 (-1 institutionalized population)
Size of family households: 2,770 2-persons, 1,204 3-persons, 1,482 4-persons, 544 5-persons, 98 6-persons, 73 7-or-more-persons
Size of nonfamily households: 1,018 1-person, 230 2-persons, 10 3-persons
3,736 married couples with children.
534 single-parent households (247 men, 287 women).
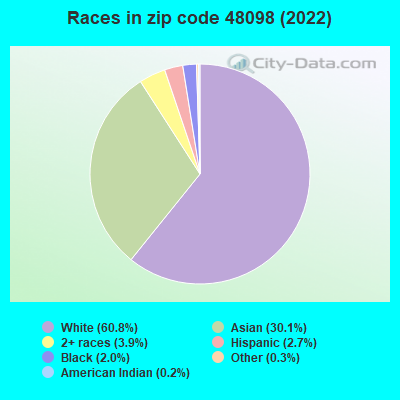
62.7% of residents of 48098 zip code speak English at home.
1.6% of residents speak Spanish at home (78% very well, 22% well).
14.5% of residents speak other Indo-European language at home (87% very well, 8% well, 5% not well).
18.0% of residents speak Asian or Pacific Island language at home (66% very well, 26% well, 7% not well, 1% not at all).
3.9% of residents speak other language at home (83% very well, 7% well, 2% not well, 9% not at all).
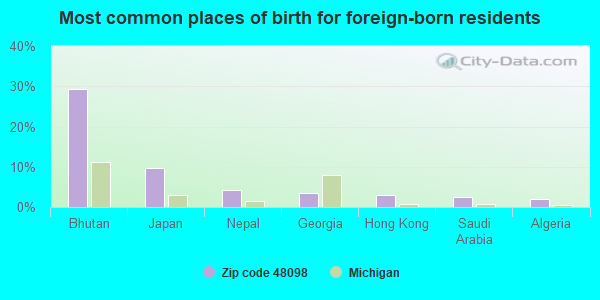
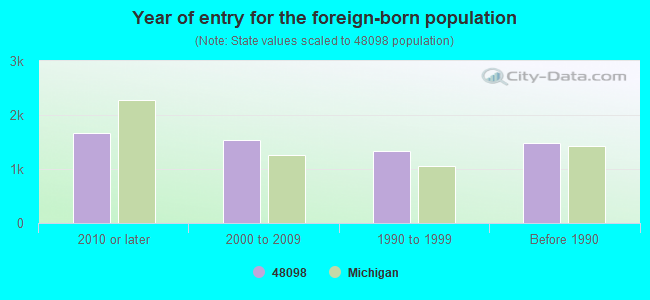
Foreign born population: 5,824 (28.4%) (68.3% of them are naturalized citizens)
Facilities with environmental interests located in this zip code:
FIRST FEDERAL OF MICHIGAN (55 W LONG LAKE in TROY, MI)
(Resource Conservation and Recovery Act (tracking hazardous waste))
FINAL TOUCH CLEANERS (1945 SOUTH BLVD in TROY, MI)
(Resource Conservation and Recovery Act (tracking hazardous waste))
FRENCH ROGERS (5455 CORPORATE DR in TROY, MI)
(Resource Conservation and Recovery Act (tracking hazardous waste))
EMERALD LAKES CLEANERS (5937 JOHN R RD in TROY, MI)
Conditionally Exempt Small Quantity Generators, less than 100 kg/month of hazardous waste (Resource Conservation and Recovery Act (tracking hazardous waste)) Organizations: MEDIATI REAL ESTATE (PROPERTY OWNER) (CONTACT/OWNER)
Alternative names: CHETS CLEANERS AND DECORATING INC
BELLE TIRE DISTRIBUTORS INC (4966 ROCHESTER RD in TROY, MI)
Conditionally Exempt Small Quantity Generators, less than 100 kg/month of hazardous waste (Resource Conservation and Recovery Act (tracking hazardous waste)) Organizations: DON BARNES (CONTACT/OPERATOR)
FOUR SEASONS CLEANERS (5055 LIVERNOIS RD in TROY, MI)
Small Quantity Generators, between 100 kg and 1000 kg of hazardous waste/month (Resource Conservation and Recovery Act (tracking hazardous waste)) - notification Organizations: CHARLES DAGHER (CONTACT/OPERATOR)
Housing units lacking complete plumbing facilities: 0.6% Housing units lacking complete kitchen facilities: 2.8%
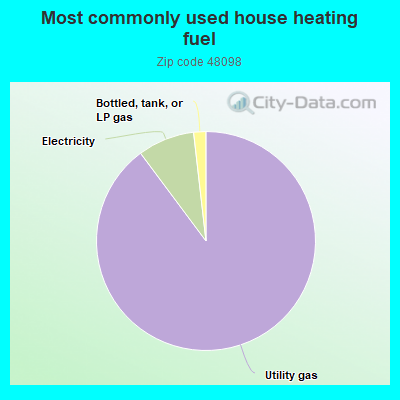
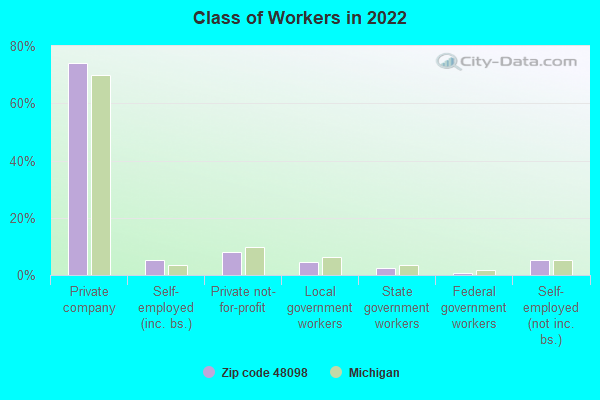
89.9%Utility gas
8.4%Electricity
1.8%Bottled, tank, or LP gas
Population in 1990: 39,379. Population change in the 1990s: +5,599 (+14.2%).
Place of birth for U.S.-born residents:
This state: 11,643
Northeast: 710
Midwest: 948
South: 651
West: 428
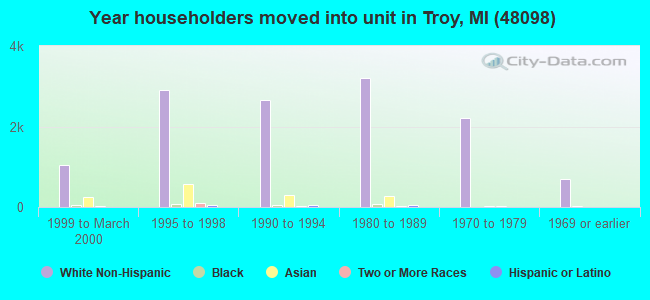
68% of the 48098 zip code residents lived in the same house 5 years ago. Out of people who lived in different houses, 64% lived in this county. Out of people who lived in different counties, 50% lived in Michigan.
94% of the 48098 zip code residents lived in the same house 1 year ago. Out of people who lived in different houses, 43% moved from this county. Out of people who lived in different houses, 18% moved from different county within same state. Out of people who lived in different houses, 22% moved from different state. Out of people who lived in different houses, 24% moved from abroad.
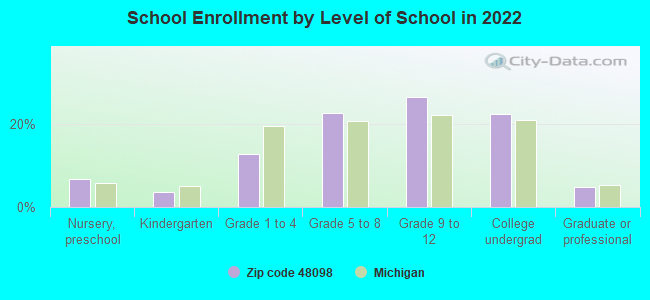
Private vs. public school enrollment:
Students in private schools in grades 1 to 8 (elementary and middle school): 324
Here:
17.1%
Michigan:
12.4%
Students in private schools in grades 9 to 12 (high school): 96
Here:
6.8%
Michigan:
9.8%
Students in private undergraduate colleges: 122
Here:
10.3%
Michigan:
14.9%
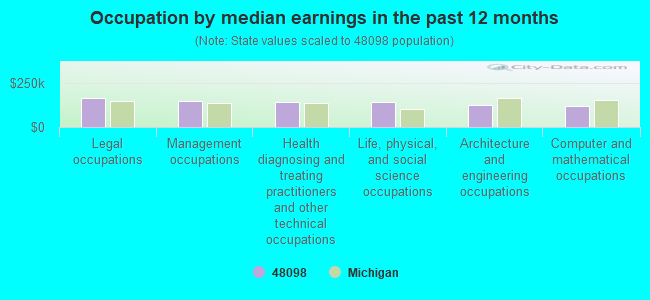
Occupation by median earnings in the past 12 months ($)
165,728Legal occupations
147,659Management occupations
138,967Health diagnosing and treating practitioners and other technical occupations
138,748Life, physical, and social science occupations
123,876Architecture and engineering occupations
117,849Computer and mathematical occupations
Companies with federal contracts located in this zip code:
JADI INC (5800 CROOKS RD in TROY, MI; small business) : $1,365,955 in 6 contractsfrom 2002 to 2006
Contracts for Defense Tank - Automotive -- Engineering Development (R&D), Defense Tank - Automotive -- Applied Research and Exploratory Development (R&D), Specialized Medical Services -- Engineering Development (R&D) by Army Signed by year:2000: $0; 2001: $0; 2002: $50,000; 2003: $67,996; 2004: $48,197; 2005: $539,887; 2006: $659,875.
Biggest contracts:
$539,887 with Army for Defense Tank - Automotive -- Engineering Development (R&D). Signed on 2005-05-05. Completion date: 2007-05-30.
$408,209 with Army for Defense Tank - Automotive -- Applied Research and Exploratory Development (R&D). Signed on 2006-02-08. Completion date: 2008-02-28.
$251,666 with Army for Defense Tank - Automotive -- Engineering Development (R&D). Signed on 2006-02-16. Completion date: 2007-05-30.
$67,996 with Army for Defense Tank - Automotive -- Applied Research and Exploratory Development (R&D). Signed on 2003-12-18. Completion date: 2004-06-18.
DELPHI AUTOMOTIVE SYSTEMS (5725 DELPHI DRIVE in TROY, MI) : $168,635 in 4 contractsfrom 2004 to 2005
$75,000 with Air Force for Physical Sciences -- Basic Research (R&D). Signed on 2005-12-01. Completion date: 2006-11-30.
$75,000, same as above.Signed on 2005-04-21. Completion date: 2005-11-30.
$11,000 with Army for Miscellaneous Items. Signed on 2004-06-16. Completion date: 2004-07-26.
$7,635 with Navy for Engine Fuel System Components, Nonaircraft. Signed on 2005-09-15. Completion date: 2005-11-21.
HONEY BAKED HAM COMPANY (4967 CROOKS RD STE 200 in TROY, MI; small business) : $9,931 in 4 contractsin 2006
$7,190 with Army for Food Services. Taking place in TX. Signed on 2006-06-22. Completion date: 2006-06-30.
$2,921 with Army for Condiments and Related Products. Signed on 2006-04-06. Completion date: 2006-04-08.
$539 with Army for Food Services. Taking place in TX. Signed on 2006-07-06. Completion date: 2006-06-30.
-$719, same as above.Signed on 2006-06-23. Completion date: 2006-06-30.
Top industries in this zip code by the number of employees in 2005:
Professional, Scientific, and Technical Services: Human Resources and Executive Search Consulting Services (over 1000: 1, 1-4: 9)
Health Care and Social Assistance: General Medical and Surgical Hospitals (over 1000: 1)
Health Care and Social Assistance: Offices of Physicians (except Mental Health Specialists) (100-249: 2, 50-99: 1, 20-49: 4, 10-19: 6, 5-9: 7, 1-4: 21)
Professional, Scientific, and Technical Services: Offices of Lawyers (100-249: 2, 20-49: 4, 10-19: 7, 5-9: 5, 1-4: 14)
People in group quarters in 2010:
29 people in group homes intended for adults
9 people in workers' group living quarters and job corps centers
5 people in residential treatment centers for adults
People in group quarters in 2000:
111 people in other noninstitutional group quarters
39 people in other group homes
25 people in homes for the mentally retarded
10 people in homes for the mentally ill
5 people in homes for the physically handicapped
Fatal accident statistics in 2013:
Fatal accident count: 1
Vehicles involved in fatal accidents: 1
Fatal accidents caused by drunken drivers: 0
Fatalities: 1
Persons involved in fatal accidents: 2
Pedestrians involved in fatal accidents: 0
Fatal accident statistics in 2012:
Fatal accident count: 1
Vehicles involved in fatal accidents: 1
Fatal accidents caused by drunken drivers: 0
Fatalities: 1
Persons involved in fatal accidents: 1
Pedestrians involved in fatal accidents: 1
Home Mortgage Disclosure Act Aggregated Statistics For Year 2009 (Based on 15 full and 6 partial tracts)
A) FHA, FSA/RHS & VA Home Purchase Loans
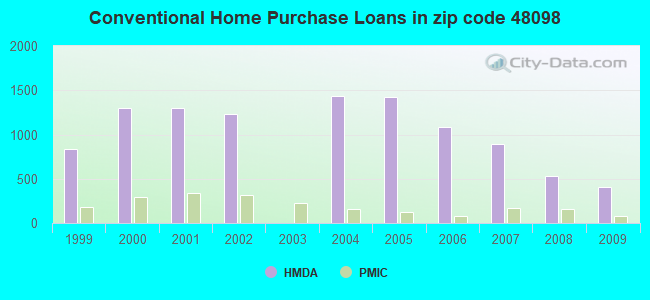
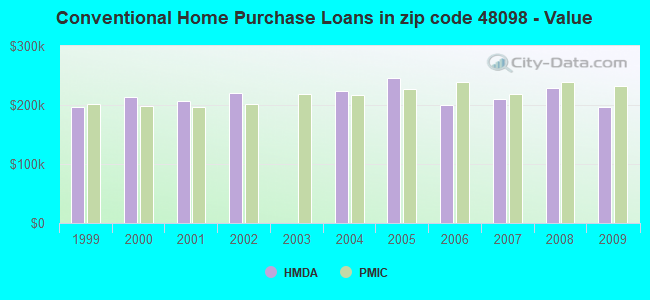
B) Conventional Home Purchase Loans
C) Refinancings
D) Home Improvement Loans
F) Non-occupant Loans on < 5 Family Dwellings (A B C & D)
Number
Average Value
Number
Average Value
Number
Average Value
Number
Average Value
Number
Average Value
LOANS ORIGINATED
211
$185,272
408
$196,600
2,084
$207,627
41
$75,218
50
$149,709
APPLICATIONS APPROVED, NOT ACCEPTED
18
$156,371
36
$230,021
190
$214,129
2
$14,420
4
$87,218
APPLICATIONS DENIED
35
$153,169
70
$185,155
610
$230,646
21
$63,284
29
$216,197
APPLICATIONS WITHDRAWN
31
$196,180
45
$234,449
334
$218,045
5
$42,906
9
$205,209
FILES CLOSED FOR INCOMPLETENESS
6
$159,678
29
$212,994
101
$226,614
3
$91,933
7
$205,951
Aggregated Statistics For Year 2008 (Based on 15 full and 6 partial tracts)
A) FHA, FSA/RHS & VA Home Purchase Loans
B) Conventional Home Purchase Loans
C) Refinancings
D) Home Improvement Loans
E) Loans on Dwellings For 5+ Families
F) Non-occupant Loans on < 5 Family Dwellings (A B C & D)
G) Loans On Manufactured Home Dwelling (A B C & D)
Number
Average Value
Number
Average Value
Number
Average Value
Number
Average Value
Number
Average Value
Number
Average Value
Number
Average Value
LOANS ORIGINATED
126
$183,657
529
$228,654
1,209
$236,934
89
$41,831
0
$0
40
$137,465
4
$53,922
APPLICATIONS APPROVED, NOT ACCEPTED
24
$157,907
95
$212,268
184
$236,638
16
$16,141
0
$0
5
$185,780
4
$124,800
APPLICATIONS DENIED
39
$162,709
103
$248,526
483
$234,917
47
$81,112
0
$0
24
$149,922
1
$18,000
APPLICATIONS WITHDRAWN
17
$184,721
60
$239,282
166
$229,930
19
$40,247
2
$800,000
7
$151,141
1
$104,010
FILES CLOSED FOR INCOMPLETENESS
8
$96,345
20
$182,424
70
$257,767
7
$243,170
0
$0
4
$126,500
0
$0
Aggregated Statistics For Year 2007 (Based on 15 full and 6 partial tracts)
A) FHA, FSA/RHS & VA Home Purchase Loans
B) Conventional Home Purchase Loans
C) Refinancings
D) Home Improvement Loans
F) Non-occupant Loans on < 5 Family Dwellings (A B C & D)
G) Loans On Manufactured Home Dwelling (A B C & D)
Number
Average Value
Number
Average Value
Number
Average Value
Number
Average Value
Number
Average Value
Number
Average Value
LOANS ORIGINATED
23
$207,657
892
$210,834
1,453
$214,254
175
$77,974
73
$166,026
0
$0
APPLICATIONS APPROVED, NOT ACCEPTED
2
$141,000
96
$217,145
285
$223,529
43
$71,961
5
$114,132
0
$0
APPLICATIONS DENIED
2
$81,870
150
$213,132
661
$230,821
84
$63,533
35
$199,850
5
$42,530
APPLICATIONS WITHDRAWN
3
$232,707
49
$201,627
237
$225,771
19
$87,096
13
$197,516
0
$0
FILES CLOSED FOR INCOMPLETENESS
2
$142,000
39
$236,593
86
$314,711
13
$74,058
0
$0
0
$0
Aggregated Statistics For Year 2006 (Based on 15 full and 6 partial tracts)
A) FHA, FSA/RHS & VA Home Purchase Loans
B) Conventional Home Purchase Loans
C) Refinancings
D) Home Improvement Loans
F) Non-occupant Loans on < 5 Family Dwellings (A B C & D)
G) Loans On Manufactured Home Dwelling (A B C & D)
Number
Average Value
Number
Average Value
Number
Average Value
Number
Average Value
Number
Average Value
Number
Average Value
LOANS ORIGINATED
15
$224,948
1,088
$200,071
1,745
$207,487
196
$77,281
106
$171,265
2
$82,700
APPLICATIONS APPROVED, NOT ACCEPTED
0
$0
137
$176,205
283
$221,735
34
$68,539
31
$188,310
0
$0
APPLICATIONS DENIED
4
$170,848
219
$203,249
666
$233,672
105
$100,769
46
$167,190
1
$50,120
APPLICATIONS WITHDRAWN
0
$0
86
$214,642
336
$215,897
23
$93,274
15
$253,376
0
$0
FILES CLOSED FOR INCOMPLETENESS
0
$0
35
$206,165
160
$240,358
12
$95,647
4
$270,780
0
$0
Aggregated Statistics For Year 2005 (Based on 15 full and 6 partial tracts)
A) FHA, FSA/RHS & VA Home Purchase Loans
B) Conventional Home Purchase Loans
C) Refinancings
D) Home Improvement Loans
F) Non-occupant Loans on < 5 Family Dwellings (A B C & D)
G) Loans On Manufactured Home Dwelling (A B C & D)
Number
Average Value
Number
Average Value
Number
Average Value
Number
Average Value
Number
Average Value
Number
Average Value
LOANS ORIGINATED
9
$179,429
1,426
$245,567
2,283
$217,832
211
$86,000
124
$191,460
0
$0
APPLICATIONS APPROVED, NOT ACCEPTED
795
$125,766
1,858
$153,681
276
$228,532
80
$143,841
169
$125,058
15
$81,793
APPLICATIONS DENIED
38
$128,993
286
$200,757
680
$229,532
92
$112,148
43
$140,350
14
$57,445
APPLICATIONS WITHDRAWN
0
$0
211
$209,101
435
$227,259
55
$182,222
29
$210,809
0
$0
FILES CLOSED FOR INCOMPLETENESS
8
$103,834
59
$202,586
318
$268,387
10
$128,489
5
$159,734
0
$0
Aggregated Statistics For Year 2004 (Based on 15 full and 6 partial tracts)
A) FHA, FSA/RHS & VA Home Purchase Loans
B) Conventional Home Purchase Loans
C) Refinancings
D) Home Improvement Loans
E) Loans on Dwellings For 5+ Families
F) Non-occupant Loans on < 5 Family Dwellings (A B C & D)
G) Loans On Manufactured Home Dwelling (A B C & D)
Number
Average Value
Number
Average Value
Number
Average Value
Number
Average Value
Number
Average Value
Number
Average Value
Number
Average Value
LOANS ORIGINATED
20
$186,280
1,439
$224,174
3,281
$217,473
224
$98,412
2
$14,990
111
$194,583
2
$15,000
APPLICATIONS APPROVED, NOT ACCEPTED
807
$116,294
2,269
$158,743
480
$205,556
104
$162,488
0
$0
156
$124,480
6
$71,220
APPLICATIONS DENIED
934
$108,548
932
$141,945
615
$231,738
77
$129,969
0
$0
95
$171,958
24
$78,291
APPLICATIONS WITHDRAWN
3
$181,950
135
$227,523
422
$222,363
20
$89,458
0
$0
15
$215,702
0
$0
FILES CLOSED FOR INCOMPLETENESS
35
$110,737
44
$215,502
281
$245,886
15
$82,773
0
$0
11
$156,794
2
$87,860
Aggregated Statistics For Year 2002 (Based on 13 full and 6 partial tracts)
A) FHA, FSA/RHS & VA Home Purchase Loans
B) Conventional Home Purchase Loans
C) Refinancings
D) Home Improvement Loans
F) Non-occupant Loans on < 5 Family Dwellings (A B C & D)
Number
Average Value
Number
Average Value
Number
Average Value
Number
Average Value
Number
Average Value
LOANS ORIGINATED
25
$183,277
1,234
$221,166
7,886
$197,305
269
$47,119
108
$142,390
APPLICATIONS APPROVED, NOT ACCEPTED
80
$106,205
1,564
$167,394
887
$205,573
48
$28,940
68
$129,901
APPLICATIONS DENIED
128
$108,093
678
$153,954
575
$212,683
67
$58,874
40
$104,049
APPLICATIONS WITHDRAWN
1
$168,880
72
$220,004
503
$200,856
15
$49,315
12
$152,895
FILES CLOSED FOR INCOMPLETENESS
2
$74,880
109
$175,002
207
$206,387
3
$154,187
5
$193,334
Aggregated Statistics For Year 2001 (Based on 13 full and 6 partial tracts)
A) FHA, FSA/RHS & VA Home Purchase Loans
B) Conventional Home Purchase Loans
C) Refinancings
D) Home Improvement Loans
E) Loans on Dwellings For 5+ Families
F) Non-occupant Loans on < 5 Family Dwellings (A B C & D)
Number
Average Value
Number
Average Value
Number
Average Value
Number
Average Value
Number
Average Value
Number
Average Value
LOANS ORIGINATED
31
$164,858
1,296
$207,315
5,692
$196,062
401
$41,415
1
$350,000
108
$151,858
APPLICATIONS APPROVED, NOT ACCEPTED
2
$119,810
1,151
$155,748
510
$190,329
76
$41,623
0
$0
25
$80,903
APPLICATIONS DENIED
6
$101,410
591
$138,160
510
$204,361
82
$31,646
0
$0
21
$96,439
APPLICATIONS WITHDRAWN
5
$152,600
75
$184,277
403
$194,297
19
$45,699
2
$175,720
9
$133,234
FILES CLOSED FOR INCOMPLETENESS
1
$164,900
111
$194,106
139
$194,973
5
$42,964
0
$0
9
$149,559
Aggregated Statistics For Year 2000 (Based on 13 full and 6 partial tracts)
A) FHA, FSA/RHS & VA Home Purchase Loans
B) Conventional Home Purchase Loans
C) Refinancings
D) Home Improvement Loans
E) Loans on Dwellings For 5+ Families
F) Non-occupant Loans on < 5 Family Dwellings (A B C & D)
Number
Average Value
Number
Average Value
Number
Average Value
Number
Average Value
Number
Average Value
Number
Average Value
LOANS ORIGINATED
29
$147,381
1,297
$213,066
1,116
$181,476
356
$32,443
1
$350,000
53
$142,659
APPLICATIONS APPROVED, NOT ACCEPTED
1
$133,000
108
$200,086
178
$142,946
94
$27,606
0
$0
15
$139,909
APPLICATIONS DENIED
3
$163,000
106
$218,961
319
$152,540
78
$33,163
0
$0
16
$146,354
APPLICATIONS WITHDRAWN
3
$107,243
81
$205,694
185
$150,285
37
$74,343
0
$0
6
$118,580
FILES CLOSED FOR INCOMPLETENESS
1
$91,390
14
$151,352
59
$174,832
6
$85,557
0
$0
0
$0
Aggregated Statistics For Year 1999 (Based on 8 full and 3 partial tracts)
A) FHA, FSA/RHS & VA Home Purchase Loans
B) Conventional Home Purchase Loans
C) Refinancings
D) Home Improvement Loans
F) Non-occupant Loans on < 5 Family Dwellings (A B C & D)
2002 - 2018 National Fire Incident Reporting System (NFIRS) incidents
Based on the data from the years 2002 - 2018 the average number of fire incidents per year is 12. The highest number of fire incidents - 26 took place in 2016, and the least - 0 in 2014. The data has a decreasing trend.
When looking into fire subcategories, the most reports belonged to: Structure Fires (42.2%), and Outside Fires (28.1%).
Fire incident types reported to NFIRS in Zip Code 48098

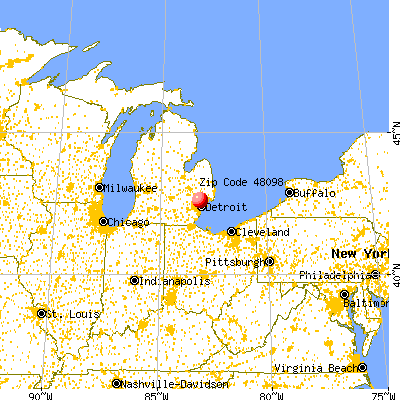


 Nearest zip codes: 48084, 48304, 48085, 48309, 48009, 48017.


 Based on the data from the years 2002 - 2018 the average number of fire incidents per year is 12. The highest number of fire incidents - 26 took place in 2016, and the least - 0 in 2014. The data has a decreasing trend.
 When looking into fire subcategories, the most reports belonged to: Structure Fires (42.2%), and Outside Fires (28.1%).