Races in Waterford, Michigan (MI) Detailed Stats
Ancestries, Foreign-born residents, place of birth

Recent posts about races in Waterford, Michigan on our local forum with over 2,400,000 registered users:
 | Is Waterford Michigan safe? (1 reply) |
| Forbes just named GR #1 place to invest in house (50 replies) |
| Would you say that Grosse Pointe has finally been cracked by Blacks and Latinos? (34 replies) |
| Working in Troy, where to buy a house? (13 replies) |
| Anybody Know Clarkston / Waterford Area (4 replies) |
| Neighborhoods within short commute to Waterford (3 replies) |
Latest news about races in Waterford, MI collected exclusively by city-data.com from local newspapers, TV, and radio stations
5.0% of Waterford, MI residents are foreign-born (2.0% born in Europe, 1.2% born in Asia, 0.9% born in Latin America, 0.8% born in North America), which is 20.3% less than the foreign-born rate of 6.0% across the entire state of Michigan.
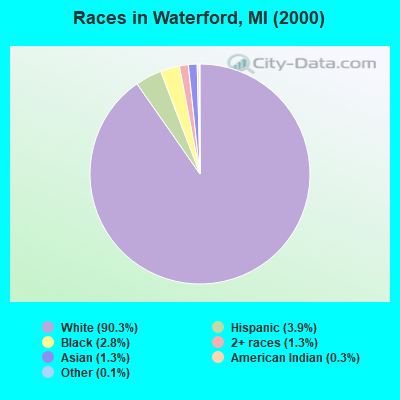
Race distribution in Waterford

- 66,06290.3%White alone
- 2,8633.9%Hispanic
- 2,0472.8%Black alone
- 9651.3%Two or more races
- 9161.3%Asian alone
- 2120.3%American Indian alone
- 790.1%Other race alone
- 60.01%Native Hawaiian and Other
Pacific Islander alone
2000
2022
-
- 7,806,69178.6%White alone
- 1,402,04714.1%Black alone
- 323,8773.3%Hispanic
- 175,3111.8%Asian alone
- 163,4871.6%Two or more races
- 53,4210.5%American Indian alone
- 11,4650.1%Other race alone
- 2,1450.02%Native Hawaiian and Other
Pacific Islander alone

-
- 7,289,05172.6%White alone
- 1,310,46413.1%Black alone
- 572,4055.7%Hispanic
- 450,0314.5%Two or more races
- 335,7323.3%Asian alone
- 45,2170.5%Other race alone
- 29,0110.3%American Indian alone
- 2,2070.02%Native Hawaiian and Other
Pacific Islander alone

Income and house value in Waterford
- Median household income in 2022
- $83,474White non-Hispanic householders
- $65,806Black householders
- $119,608American Indian and Alaska Native householders
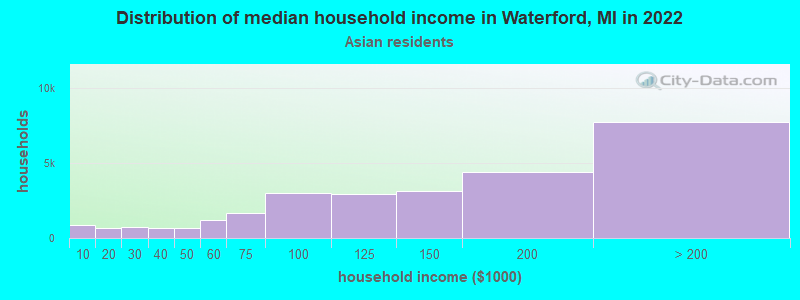
- $97,176Asian householders
- $78,315Some other race householders
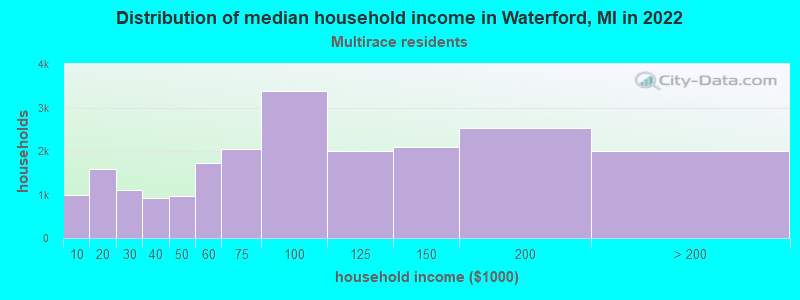
- $63,445Two or more races householders
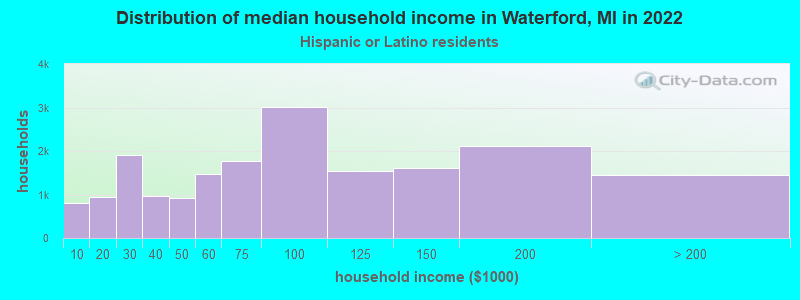
- $76,913Hispanic or Latino race householders
- Median 2022 house value
- $273,699White Non-Hispanic householders
- $362,205Black or African American householders
- $200,611American Indian or Alaska Native householders
- $336,700Asian householders
- $281,122Some other race householders
- $293,113Two or more races householders
- $266,467Hispanic or Latino householders
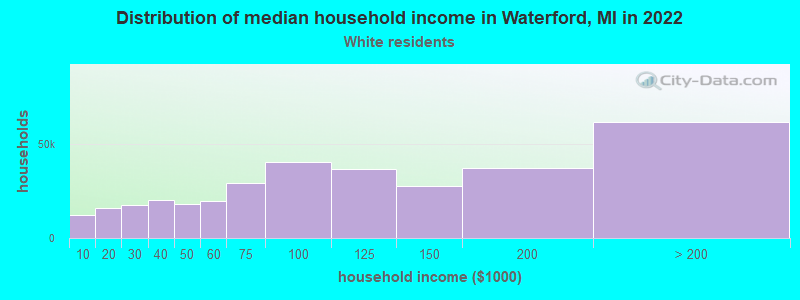
Household income for White non-Hispanic householders
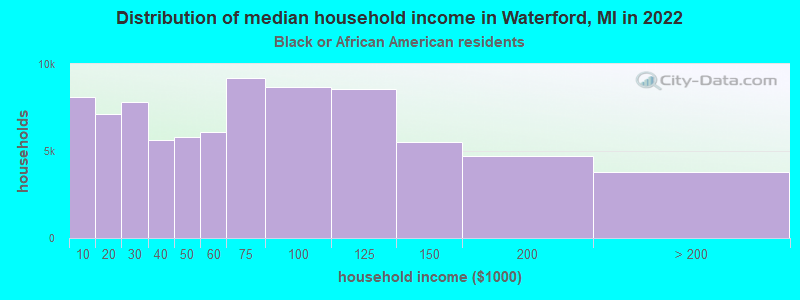
Household income for Black householders
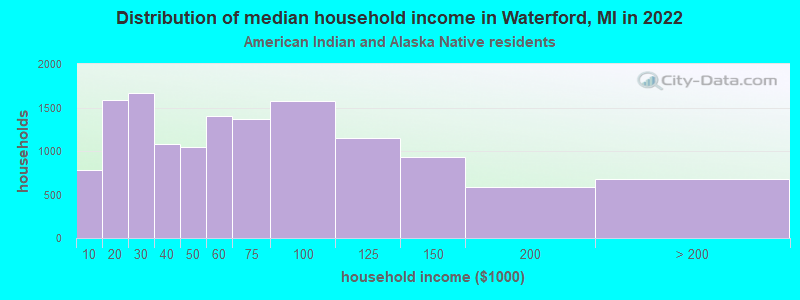
Household income for American Indian and Alaska Native householders
Household income for Asian householders
Household income for Two or more races householders
Household income for Hispanic or Latino race householders
Foreign-born residents in Waterford
3,647 residents are foreign born (2.0% Europe, 1.2% Asia, 0.9% Latin America, 0.8% North America).
| This city: | 5.0% |
| Michigan: | 5.3% |
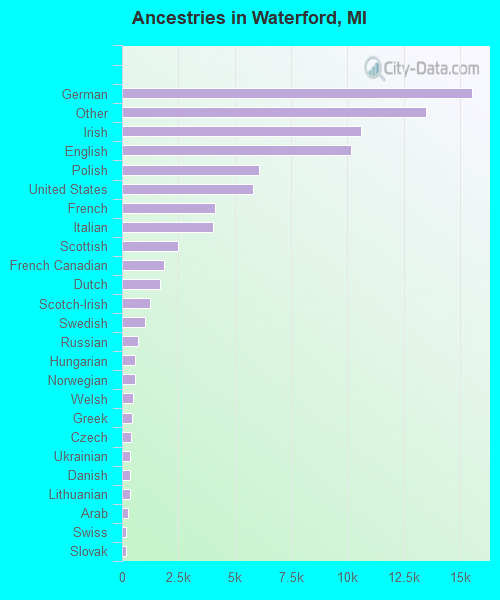
Ancestries in Waterford

- 15,51418.7%German
- 13,50416.2%Other
- 10,59512.7%Irish
- 10,16912.2%English
- 6,0707.3%Polish
- 5,8287.0%United States
- 4,1195.0%French
- 4,0324.8%Italian
- 2,4743.0%Scottish
- 1,8662.2%French Canadian
- 1,6692.0%Dutch
- 1,2371.5%Scotch-Irish
- 1,0151.2%Swedish
- 7100.9%Russian
- 5930.7%Hungarian
- 5680.7%Norwegian
- 4770.6%Welsh
- 4570.5%Greek
- 3830.5%Czech
- 3700.4%Ukrainian
- 3480.4%Danish
- 3390.4%Lithuanian
- 2590.3%Arab
- 1700.2%Swiss
- 1610.2%Slovak
- 1560.2%Subsaharan African
- 680.08%West Indian
Zip codes: 48328.