Races in West Lake Stevens, Washington (WA) Detailed Stats
Ancestries, Foreign-born residents, place of birth

Discuss West Lake Stevens, Washington races on our local forum with over 2,400,000 registered users
4.8% of West Lake Stevens, WA residents are foreign-born (2.0% born in Asia, 1.5% born in Europe, 0.7% born in Latin America, 0.5% born in North America), which is 214.5% less than the foreign-born rate of 15.0% across the entire state of Washington.
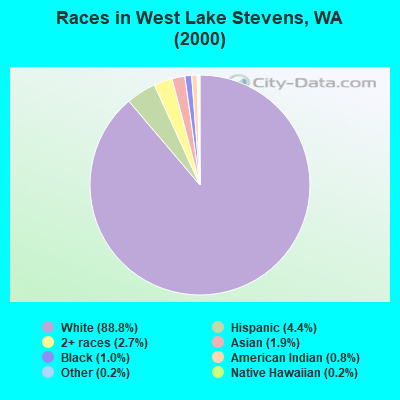
Race distribution in West Lake Stevens

- 16,05388.8%White alone
- 7944.4%Hispanic
- 4822.7%Two or more races
- 3521.9%Asian alone
- 1781.0%Black alone
- 1430.8%American Indian alone
- 300.2%Native Hawaiian and Other
Pacific Islander alone - 390.2%Other race alone
2000
2022
-
- 4,652,49078.9%White alone
- 441,5097.5%Hispanic
- 319,4015.4%Asian alone
- 184,6313.1%Black alone
- 175,9263.0%Two or more races
- 85,3961.4%American Indian alone
- 22,7790.4%Native Hawaiian and Other
Pacific Islander alone - 11,9890.2%Other race alone

-
- 4,941,45663.5%White alone
- 1,093,31314.0%Hispanic
- 755,8329.7%Asian alone
- 523,4486.7%Two or more races
- 299,5373.8%Black alone
- 69,0240.9%American Indian alone
- 52,2310.7%Native Hawaiian and Other
Pacific Islander alone - 50,9450.7%Other race alone

Income and house value in West Lake Stevens
- Median household income in 2022
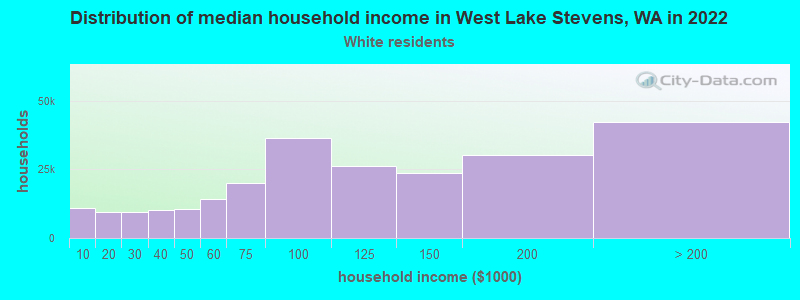
- $107,149White non-Hispanic householders
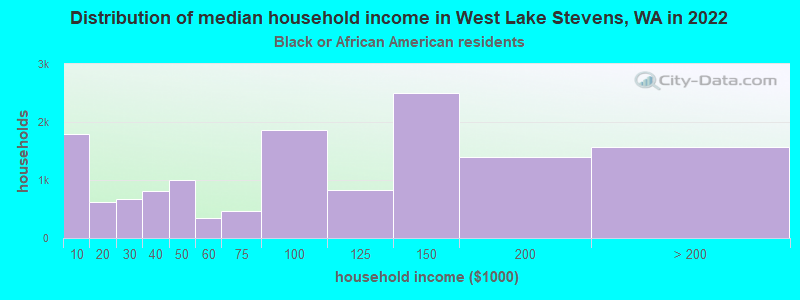
- $118,638Black householders
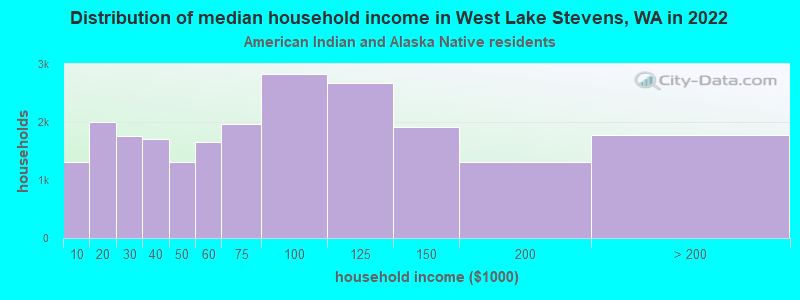
- $174,035American Indian and Alaska Native householders
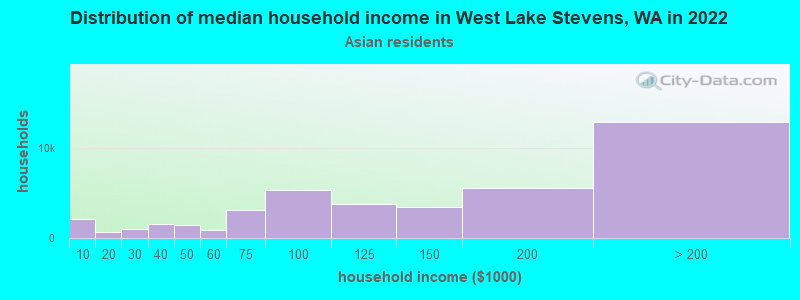
- $149,040Asian householders
- $105,365Some other race householders
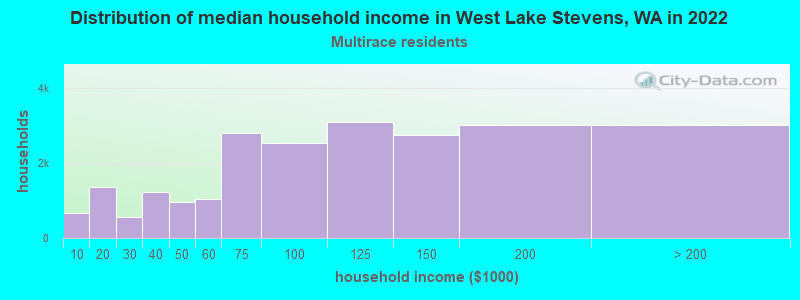
- $96,656Two or more races householders
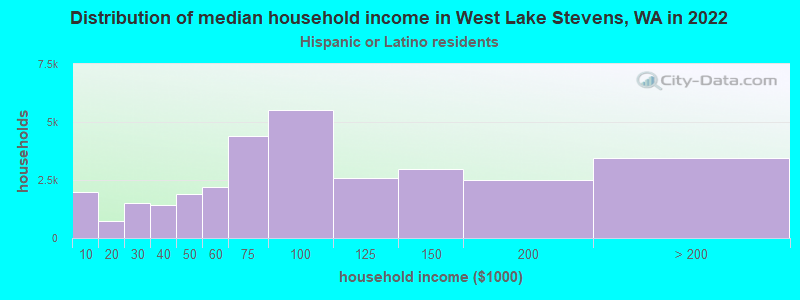
- $109,755Hispanic or Latino race householders
- Median 2022 house value
- $672,737White Non-Hispanic householders
- $654,586Black or African American householders
- $614,501American Indian or Alaska Native householders
- $645,888Asian householders
- $636,812Some other race householders
- $609,207Two or more races householders
- $684,082Hispanic or Latino householders
Household income for White non-Hispanic householders
Household income for Black householders
Household income for American Indian and Alaska Native householders
Household income for Asian householders
Household income for Two or more races householders
Household income for Hispanic or Latino race householders
Foreign-born residents in West Lake Stevens
862 residents are foreign born (2.0% Asia, 1.5% Europe, 0.7% Latin America, 0.5% North America).
| This city: | 4.8% |
| Washington: | 10.4% |
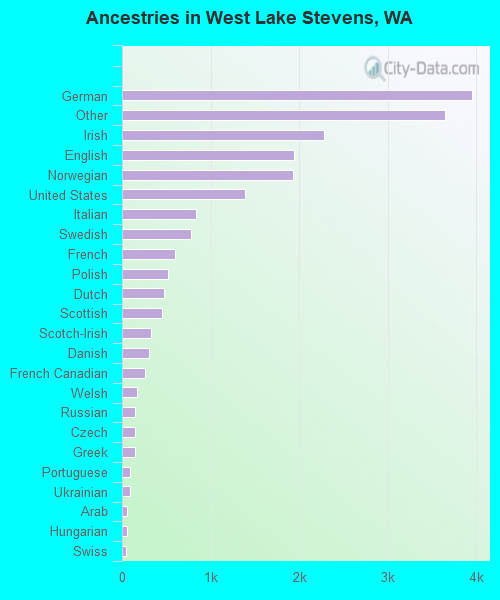
Ancestries in West Lake Stevens

- 3,94719.1%German
- 3,64317.6%Other
- 2,28311.0%Irish
- 1,9449.4%English
- 1,9329.3%Norwegian
- 1,3886.7%United States
- 8354.0%Italian
- 7753.7%Swedish
- 6002.9%French
- 5182.5%Polish
- 4782.3%Dutch
- 4502.2%Scottish
- 3311.6%Scotch-Irish
- 3011.5%Danish
- 2631.3%French Canadian
- 1690.8%Welsh
- 1480.7%Russian
- 1470.7%Czech
- 1470.7%Greek
- 890.4%Portuguese
- 850.4%Ukrainian
- 560.3%Arab
- 520.3%Hungarian
- 500.2%Swiss
- 250.1%Slovak
- 130.06%West Indian
- 120.06%Subsaharan African
- 80.04%Lithuanian
Zip codes: 98205.