Cities: Lake Stevens, WA (12.74%) ,
Everett, WA (11.08%) ,
Bunk Foss, WA (9.70%) ,
Cavalero, WA (2.18%) ,
Marysville, WA (1.04%) ,
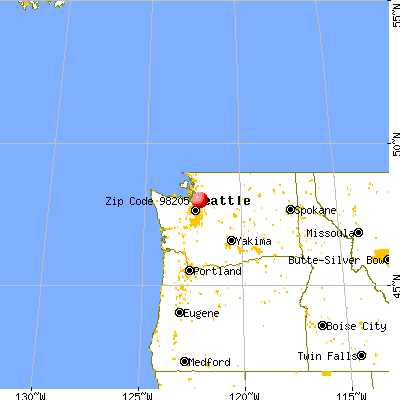
Machias, WA (0.00%) County: Snohomish County, WA Estimated zip code population in 2022: 16,440
Zip code population in 2010: 12,283
Zip code population in 2000: 17,896
Houses and condos: 5,750
Renter-occupied apartments: 946
% of renters here:
17%State:
36%
March 2022 cost of living index in zip code 98205: 111.6
(more than average, U.S. average is 100)
Land area: 18.9
sq. mi.
Water area: 2.4
sq. mi.
Population density: 868 people per square mile (low).
OSM Map
General Map
Google Map
MSN Map
OSM Map
General Map
Google Map
MSN Map
OSM Map
General Map
Google Map
MSN Map
OSM Map
General Map
Google Map
MSN Map
Please wait while loading the map...
Real estate property taxes paid for housing units in 2022:
This zip code:
0.9% ($4,960)Washington:
0.8% ($4,283)
Median real estate property taxes paid for housing units with mortgages in 2022: $5,066 (0.9%)
Median real estate property taxes paid for housing units with no mortgage in 2022: $4,606 (0.8%)
Profiles of local businesses
Business Search - 14 Million verified businesses
Males: 8,075 Females: 8,361
For population 25 years and over in 98205:
High school or higher: 96.4%Bachelor's degree or higher: 34.0%Graduate or professional degree: 11.8%Unemployed: 3.8%Mean travel time to work (commute): 34.2 minutes
For population 15 years and over in 98205:
Never married: 28.1%Now married: 55.5%Separated: 2.0%Widowed: 2.4%Divorced: 12.1%
Zip code 98205 compared to state average:
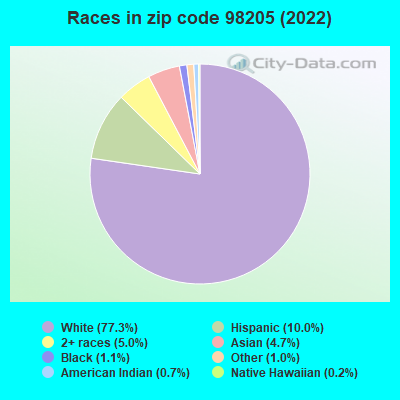
Black race population percentage significantly below state average. Renting percentage below state average. Length of stay since moving in significantly above state average. House age significantly below state average. 12,579 77.3% White 1,630 10.0% Hispanic or Latino 813 5.0% Two or more races 765 4.7% Asian 172 1.1% Black 166 1.0% Some other race 119 0.7% American Indian 27 0.2% Native Hawaiian and Other
Data:
Median household income ($)
Median household income (% change since 2000)
Household income diversity
Ratio of average income to average house value (%)
Ratio of average income to average rent
Median household income ($) - White
Median household income ($) - Black or African American
Median household income ($) - Asian
Median household income ($) - Hispanic or Latino
Median household income ($) - American Indian and Alaska Native
Median household income ($) - Multirace
Median household income ($) - Other Race
Median household income for houses/condos with a mortgage ($)
Median household income for apartments without a mortgage ($)
Races - White alone (%)
Races - White alone (% change since 2000)
Races - Black alone (%)
Races - Black alone (% change since 2000)
Races - American Indian alone (%)
Races - American Indian alone (% change since 2000)
Races - Asian alone (%)
Races - Asian alone (% change since 2000)
Races - Hispanic (%)
Races - Hispanic (% change since 2000)
Races - Native Hawaiian and Other Pacific Islander alone (%)
Races - Native Hawaiian and Other Pacific Islander alone (% change since 2000)
Races - Two or more races (%)
Races - Two or more races (% change since 2000)
Races - Other race alone (%)
Races - Other race alone (% change since 2000)
Racial diversity
Unemployment (%)
Unemployment (% change since 2000)
Unemployment (%) - White
Unemployment (%) - Black or African American
Unemployment (%) - Asian
Unemployment (%) - Hispanic or Latino
Unemployment (%) - American Indian and Alaska Native
Unemployment (%) - Multirace
Unemployment (%) - Other Race
Population density (people per square mile)
Population - Males (%)
Population - Females (%)
Population - Males (%) - White
Population - Males (%) - Black or African American
Population - Males (%) - Asian
Population - Males (%) - Hispanic or Latino
Population - Males (%) - American Indian and Alaska Native
Population - Males (%) - Multirace
Population - Males (%) - Other Race
Population - Females (%) - White
Population - Females (%) - Black or African American
Population - Females (%) - Asian
Population - Females (%) - Hispanic or Latino
Population - Females (%) - American Indian and Alaska Native
Population - Females (%) - Multirace
Population - Females (%) - Other Race
Coronavirus confirmed cases (May 23, 2024)
Deaths caused by coronavirus (May 23, 2024)
Coronavirus confirmed cases (per 100k population) (May 23, 2024)
Deaths caused by coronavirus (per 100k population) (May 23, 2024)
Daily increase in number of cases (May 23, 2024)
Weekly increase in number of cases (May 23, 2024)
Cases doubled (in days) (May 23, 2024)
Hospitalized patients (Apr 18, 2022)
Negative test results (Apr 18, 2022)
Total test results (Apr 18, 2022)
COVID Vaccine doses distributed (per 100k population) (Sep 19, 2023)
COVID Vaccine doses administered (per 100k population) (Sep 19, 2023)
COVID Vaccine doses distributed (Sep 19, 2023)
COVID Vaccine doses administered (Sep 19, 2023)
Likely homosexual households (%)
Likely homosexual households (% change since 2000)
Likely homosexual households - Lesbian couples (%)
Likely homosexual households - Lesbian couples (% change since 2000)
Likely homosexual households - Gay men (%)
Likely homosexual households - Gay men (% change since 2000)
Cost of living index
Median gross rent ($)
Median contract rent ($)
Median monthly housing costs ($)
Median house or condo value ($)
Median house or condo value ($ change since 2000)
Mean house or condo value by units in structure - 1, detached ($)
Mean house or condo value by units in structure - 1, attached ($)
Mean house or condo value by units in structure - 2 ($)
Mean house or condo value by units in structure by units in structure - 3 or 4 ($)
Mean house or condo value by units in structure - 5 or more ($)
Mean house or condo value by units in structure - Boat, RV, van, etc. ($)
Mean house or condo value by units in structure - Mobile home ($)
Median house or condo value ($) - White
Median house or condo value ($) - Black or African American
Median house or condo value ($) - Asian
Median house or condo value ($) - Hispanic or Latino
Median house or condo value ($) - American Indian and Alaska Native
Median house or condo value ($) - Multirace
Median house or condo value ($) - Other Race
Median resident age
Resident age diversity
Median resident age - Males
Median resident age - Females
Median resident age - White
Median resident age - Black or African American
Median resident age - Asian
Median resident age - Hispanic or Latino
Median resident age - American Indian and Alaska Native
Median resident age - Multirace
Median resident age - Other Race
Median resident age - Males - White
Median resident age - Males - Black or African American
Median resident age - Males - Asian
Median resident age - Males - Hispanic or Latino
Median resident age - Males - American Indian and Alaska Native
Median resident age - Males - Multirace
Median resident age - Males - Other Race
Median resident age - Females - White
Median resident age - Females - Black or African American
Median resident age - Females - Asian
Median resident age - Females - Hispanic or Latino
Median resident age - Females - American Indian and Alaska Native
Median resident age - Females - Multirace
Median resident age - Females - Other Race
Commute - mean travel time to work (minutes)
Travel time to work - Less than 5 minutes (%)
Travel time to work - Less than 5 minutes (% change since 2000)
Travel time to work - 5 to 9 minutes (%)
Travel time to work - 5 to 9 minutes (% change since 2000)
Travel time to work - 10 to 19 minutes (%)
Travel time to work - 10 to 19 minutes (% change since 2000)
Travel time to work - 20 to 29 minutes (%)
Travel time to work - 20 to 29 minutes (% change since 2000)
Travel time to work - 30 to 39 minutes (%)
Travel time to work - 30 to 39 minutes (% change since 2000)
Travel time to work - 40 to 59 minutes (%)
Travel time to work - 40 to 59 minutes (% change since 2000)
Travel time to work - 60 to 89 minutes (%)
Travel time to work - 60 to 89 minutes (% change since 2000)
Travel time to work - 90 or more minutes (%)
Travel time to work - 90 or more minutes (% change since 2000)
Marital status - Never married (%)
Marital status - Now married (%)
Marital status - Separated (%)
Marital status - Widowed (%)
Marital status - Divorced (%)
Median family income ($)
Median family income (% change since 2000)
Median non-family income ($)
Median non-family income (% change since 2000)
Median per capita income ($)
Median per capita income (% change since 2000)
Median family income ($) - White
Median family income ($) - Black or African American
Median family income ($) - Asian
Median family income ($) - Hispanic or Latino
Median family income ($) - American Indian and Alaska Native
Median family income ($) - Multirace
Median family income ($) - Other Race
Median year house/condo built
Median year apartment built
Year house built - Built 2005 or later (%)
Year house built - Built 2000 to 2004 (%)
Year house built - Built 1990 to 1999 (%)
Year house built - Built 1980 to 1989 (%)
Year house built - Built 1970 to 1979 (%)
Year house built - Built 1960 to 1969 (%)
Year house built - Built 1950 to 1959 (%)
Year house built - Built 1940 to 1949 (%)
Year house built - Built 1939 or earlier (%)
Average household size
Household density (households per square mile)
Average household size - White
Average household size - Black or African American
Average household size - Asian
Average household size - Hispanic or Latino
Average household size - American Indian and Alaska Native
Average household size - Multirace
Average household size - Other Race
Occupied housing units (%)
Vacant housing units (%)
Owner occupied housing units (%)
Renter occupied housing units (%)
Vacancy status - For rent (%)
Vacancy status - For sale only (%)
Vacancy status - Rented or sold, not occupied (%)
Vacancy status - For seasonal, recreational, or occasional use (%)
Vacancy status - For migrant workers (%)
Vacancy status - Other vacant (%)
Residents with income below the poverty level (%)
Residents with income below 50% of the poverty level (%)
Children below poverty level (%)
Poor families by family type - Married-couple family (%)
Poor families by family type - Male, no wife present (%)
Poor families by family type - Female, no husband present (%)
Poverty status for native-born residents (%)
Poverty status for foreign-born residents (%)
Poverty among high school graduates not in families (%)
Poverty among people who did not graduate high school not in families (%)
Residents with income below the poverty level (%) - White
Residents with income below the poverty level (%) - Black or African American
Residents with income below the poverty level (%) - Asian
Residents with income below the poverty level (%) - Hispanic or Latino
Residents with income below the poverty level (%) - American Indian and Alaska Native
Residents with income below the poverty level (%) - Multirace
Residents with income below the poverty level (%) - Other Race
Air pollution - Air Quality Index (AQI)
Air pollution - CO
Air pollution - NO2
Air pollution - SO2
Air pollution - Ozone
Air pollution - PM10
Air pollution - PM25
Air pollution - Pb
Crime - Murders per 100,000 population
Crime - Rapes per 100,000 population
Crime - Robberies per 100,000 population
Crime - Assaults per 100,000 population
Crime - Burglaries per 100,000 population
Crime - Thefts per 100,000 population
Crime - Auto thefts per 100,000 population
Crime - Arson per 100,000 population
Crime - City-data.com crime index
Crime - Violent crime index
Crime - Property crime index
Crime - Murders per 100,000 population (5 year average)
Crime - Rapes per 100,000 population (5 year average)
Crime - Robberies per 100,000 population (5 year average)
Crime - Assaults per 100,000 population (5 year average)
Crime - Burglaries per 100,000 population (5 year average)
Crime - Thefts per 100,000 population (5 year average)
Crime - Auto thefts per 100,000 population (5 year average)
Crime - Arson per 100,000 population (5 year average)
Crime - City-data.com crime index (5 year average)
Crime - Violent crime index (5 year average)
Crime - Property crime index (5 year average)
1996 Presidential Elections Results (%) - Democratic Party (Clinton)
1996 Presidential Elections Results (%) - Republican Party (Dole)
1996 Presidential Elections Results (%) - Other
2000 Presidential Elections Results (%) - Democratic Party (Gore)
2000 Presidential Elections Results (%) - Republican Party (Bush)
2000 Presidential Elections Results (%) - Other
2004 Presidential Elections Results (%) - Democratic Party (Kerry)
2004 Presidential Elections Results (%) - Republican Party (Bush)
2004 Presidential Elections Results (%) - Other
2008 Presidential Elections Results (%) - Democratic Party (Obama)
2008 Presidential Elections Results (%) - Republican Party (McCain)
2008 Presidential Elections Results (%) - Other
2012 Presidential Elections Results (%) - Democratic Party (Obama)
2012 Presidential Elections Results (%) - Republican Party (Romney)
2012 Presidential Elections Results (%) - Other
2016 Presidential Elections Results (%) - Democratic Party (Clinton)
2016 Presidential Elections Results (%) - Republican Party (Trump)
2016 Presidential Elections Results (%) - Other
2020 Presidential Elections Results (%) - Democratic Party (Biden)
2020 Presidential Elections Results (%) - Republican Party (Trump)
2020 Presidential Elections Results (%) - Other
Ancestries Reported - Arab (%)
Ancestries Reported - Czech (%)
Ancestries Reported - Danish (%)
Ancestries Reported - Dutch (%)
Ancestries Reported - English (%)
Ancestries Reported - French (%)
Ancestries Reported - French Canadian (%)
Ancestries Reported - German (%)
Ancestries Reported - Greek (%)
Ancestries Reported - Hungarian (%)
Ancestries Reported - Irish (%)
Ancestries Reported - Italian (%)
Ancestries Reported - Lithuanian (%)
Ancestries Reported - Norwegian (%)
Ancestries Reported - Polish (%)
Ancestries Reported - Portuguese (%)
Ancestries Reported - Russian (%)
Ancestries Reported - Scotch-Irish (%)
Ancestries Reported - Scottish (%)
Ancestries Reported - Slovak (%)
Ancestries Reported - Subsaharan African (%)
Ancestries Reported - Swedish (%)
Ancestries Reported - Swiss (%)
Ancestries Reported - Ukrainian (%)
Ancestries Reported - United States (%)
Ancestries Reported - Welsh (%)
Ancestries Reported - West Indian (%)
Ancestries Reported - Other (%)
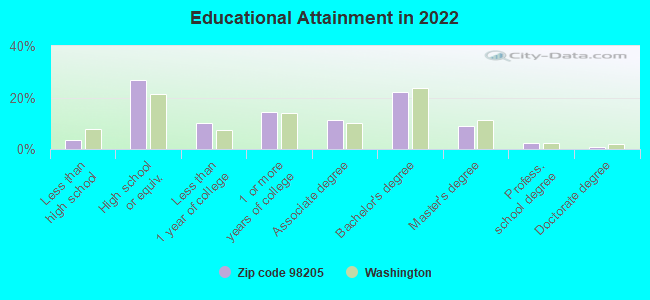
Educational Attainment - No schooling completed (%)
Educational Attainment - Less than high school (%)
Educational Attainment - High school or equivalent (%)
Educational Attainment - Less than 1 year of college (%)
Educational Attainment - 1 or more years of college (%)
Educational Attainment - Associate degree (%)
Educational Attainment - Bachelor's degree (%)
Educational Attainment - Master's degree (%)
Educational Attainment - Professional school degree (%)
Educational Attainment - Doctorate degree (%)
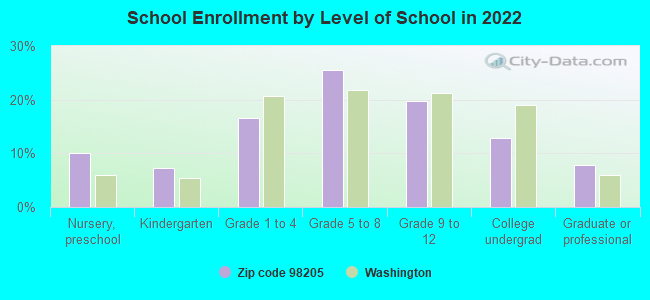
School Enrollment - Nursery, preschool (%)
School Enrollment - Kindergarten (%)
School Enrollment - Grade 1 to 4 (%)
School Enrollment - Grade 5 to 8 (%)
School Enrollment - Grade 9 to 12 (%)
School Enrollment - College undergrad (%)
School Enrollment - Graduate or professional (%)
School Enrollment - Not enrolled in school (%)
School enrollment - Public schools (%)
School enrollment - Private schools (%)
School enrollment - Not enrolled (%)
Median number of rooms in houses and condos
Median number of rooms in apartments
Housing units lacking complete plumbing facilities (%)
Housing units lacking complete kitchen facilities (%)
Density of houses
Urban houses (%)
Rural houses (%)
Households with people 60 years and over (%)
Households with people 65 years and over (%)
Households with people 75 years and over (%)
Households with one or more nonrelatives (%)
Households with no nonrelatives (%)
Population in households (%)
Family households (%)
Nonfamily households (%)
Population in families (%)
Family households with own children (%)
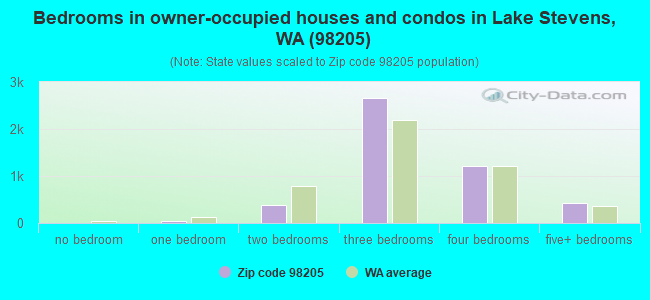
Median number of bedrooms in owner occupied houses
Mean number of bedrooms in owner occupied houses
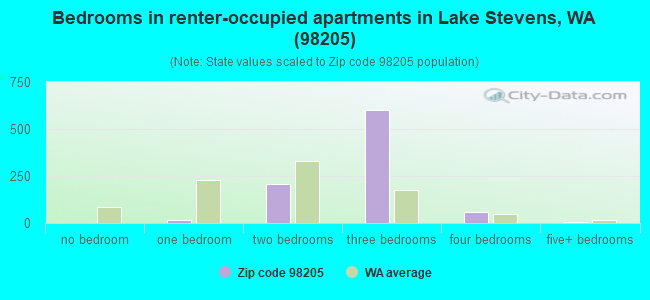
Median number of bedrooms in renter occupied houses
Mean number of bedrooms in renter occupied houses
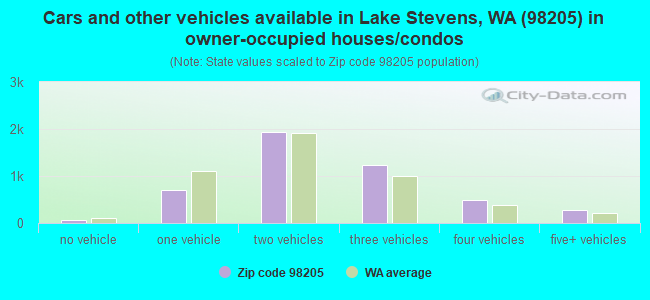
Median number of vehichles in owner occupied houses
Mean number of vehichles in owner occupied houses
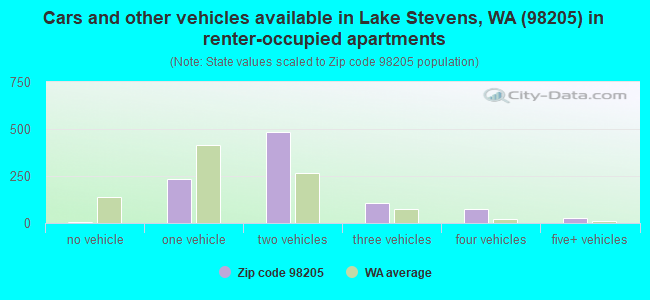
Median number of vehichles in renter occupied houses
Mean number of vehichles in renter occupied houses
Mortgage status - with mortgage (%)
Mortgage status - with second mortgage (%)
Mortgage status - with home equity loan (%)
Mortgage status - with both second mortgage and home equity loan (%)
Mortgage status - without a mortgage (%)
Average family size
Average family size - White
Average family size - Black or African American
Average family size - Asian
Average family size - Hispanic or Latino
Average family size - American Indian and Alaska Native
Average family size - Multirace
Average family size - Other Race
Geographical mobility - Same house 1 year ago (%)
Geographical mobility - Moved within same county (%)
Geographical mobility - Moved from different county within same state (%)
Geographical mobility - Moved from different state (%)
Geographical mobility - Moved from abroad (%)
Place of birth - Born in state of residence (%)
Place of birth - Born in other state (%)
Place of birth - Native, outside of US (%)
Place of birth - Foreign born (%)
Housing units in structures - 1, detached (%)
Housing units in structures - 1, attached (%)
Housing units in structures - 2 (%)
Housing units in structures - 3 or 4 (%)
Housing units in structures - 5 to 9 (%)
Housing units in structures - 10 to 19 (%)
Housing units in structures - 20 to 49 (%)
Housing units in structures - 50 or more (%)
Housing units in structures - Mobile home (%)
Housing units in structures - Boat, RV, van, etc. (%)
House/condo owner moved in on average (years ago)
Renter moved in on average (years ago)
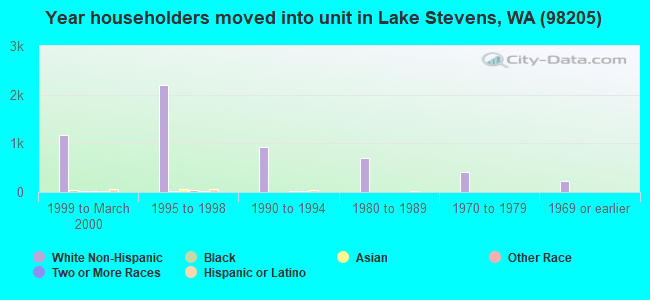
Year householder moved into unit - Moved in 1999 to March 2000 (%)
Year householder moved into unit - Moved in 1995 to 1998 (%)
Year householder moved into unit - Moved in 1990 to 1994 (%)
Year householder moved into unit - Moved in 1980 to 1989 (%)
Year householder moved into unit - Moved in 1970 to 1979 (%)
Year householder moved into unit - Moved in 1969 or earlier (%)
Means of transportation to work - Drove car alone (%)
Means of transportation to work - Carpooled (%)
Means of transportation to work - Public transportation (%)
Means of transportation to work - Bus or trolley bus (%)
Means of transportation to work - Streetcar or trolley car (%)
Means of transportation to work - Subway or elevated (%)
Means of transportation to work - Railroad (%)
Means of transportation to work - Ferryboat (%)
Means of transportation to work - Taxicab (%)
Means of transportation to work - Motorcycle (%)
Means of transportation to work - Bicycle (%)
Means of transportation to work - Walked (%)
Means of transportation to work - Other means (%)
Working at home (%)
Industry diversity
Most Common Industries - Agriculture, forestry, fishing and hunting, and mining (%)
Most Common Industries - Agriculture, forestry, fishing and hunting (%)
Most Common Industries - Mining, quarrying, and oil and gas extraction (%)
Most Common Industries - Construction (%)
Most Common Industries - Manufacturing (%)
Most Common Industries - Wholesale trade (%)
Most Common Industries - Retail trade (%)
Most Common Industries - Transportation and warehousing, and utilities (%)
Most Common Industries - Transportation and warehousing (%)
Most Common Industries - Utilities (%)
Most Common Industries - Information (%)
Most Common Industries - Finance and insurance, and real estate and rental and leasing (%)
Most Common Industries - Finance and insurance (%)
Most Common Industries - Real estate and rental and leasing (%)
Most Common Industries - Professional, scientific, and management, and administrative and waste management services (%)
Most Common Industries - Professional, scientific, and technical services (%)
Most Common Industries - Management of companies and enterprises (%)
Most Common Industries - Administrative and support and waste management services (%)
Most Common Industries - Educational services, and health care and social assistance (%)
Most Common Industries - Educational services (%)
Most Common Industries - Health care and social assistance (%)
Most Common Industries - Arts, entertainment, and recreation, and accommodation and food services (%)
Most Common Industries - Arts, entertainment, and recreation (%)
Most Common Industries - Accommodation and food services (%)
Most Common Industries - Other services, except public administration (%)
Most Common Industries - Public administration (%)
Occupation diversity
Most Common Occupations - Management, business, science, and arts occupations (%)
Most Common Occupations - Management, business, and financial occupations (%)
Most Common Occupations - Management occupations (%)
Most Common Occupations - Business and financial operations occupations (%)
Most Common Occupations - Computer, engineering, and science occupations (%)
Most Common Occupations - Computer and mathematical occupations (%)
Most Common Occupations - Architecture and engineering occupations (%)
Most Common Occupations - Life, physical, and social science occupations (%)
Most Common Occupations - Education, legal, community service, arts, and media occupations (%)
Most Common Occupations - Community and social service occupations (%)
Most Common Occupations - Legal occupations (%)
Most Common Occupations - Education, training, and library occupations (%)
Most Common Occupations - Arts, design, entertainment, sports, and media occupations (%)
Most Common Occupations - Healthcare practitioners and technical occupations (%)
Most Common Occupations - Health diagnosing and treating practitioners and other technical occupations (%)
Most Common Occupations - Health technologists and technicians (%)
Most Common Occupations - Service occupations (%)
Most Common Occupations - Healthcare support occupations (%)
Most Common Occupations - Protective service occupations (%)
Most Common Occupations - Fire fighting and prevention, and other protective service workers including supervisors (%)
Most Common Occupations - Law enforcement workers including supervisors (%)
Most Common Occupations - Food preparation and serving related occupations (%)
Most Common Occupations - Building and grounds cleaning and maintenance occupations (%)
Most Common Occupations - Personal care and service occupations (%)
Most Common Occupations - Sales and office occupations (%)
Most Common Occupations - Sales and related occupations (%)
Most Common Occupations - Office and administrative support occupations (%)
Most Common Occupations - Natural resources, construction, and maintenance occupations (%)
Most Common Occupations - Farming, fishing, and forestry occupations (%)
Most Common Occupations - Construction and extraction occupations (%)
Most Common Occupations - Installation, maintenance, and repair occupations (%)
Most Common Occupations - Production, transportation, and material moving occupations (%)
Most Common Occupations - Production occupations (%)
Most Common Occupations - Transportation occupations (%)
Most Common Occupations - Material moving occupations (%)
People in Group quarters - Institutionalized population (%)
People in Group quarters - Correctional institutions (%)
People in Group quarters - Federal prisons and detention centers (%)
People in Group quarters - Halfway houses (%)
People in Group quarters - Local jails and other confinement facilities (including police lockups) (%)
People in Group quarters - Military disciplinary barracks (%)
People in Group quarters - State prisons (%)
People in Group quarters - Other types of correctional institutions (%)
People in Group quarters - Nursing homes (%)
People in Group quarters - Hospitals/wards, hospices, and schools for the handicapped (%)
People in Group quarters - Hospitals/wards and hospices for chronically ill (%)
People in Group quarters - Hospices or homes for chronically ill (%)
People in Group quarters - Military hospitals or wards for chronically ill (%)
People in Group quarters - Other hospitals or wards for chronically ill (%)
People in Group quarters - Hospitals or wards for drug/alcohol abuse (%)
People in Group quarters - Mental (Psychiatric) hospitals or wards (%)
People in Group quarters - Schools, hospitals, or wards for the mentally retarded (%)
People in Group quarters - Schools, hospitals, or wards for the physically handicapped (%)
People in Group quarters - Institutions for the deaf (%)
People in Group quarters - Institutions for the blind (%)
People in Group quarters - Orthopedic wards and institutions for the physically handicapped (%)
People in Group quarters - Wards in general hospitals for patients who have no usual home elsewhere (%)
People in Group quarters - Wards in military hospitals for patients who have no usual home elsewhere (%)
People in Group quarters - Juvenile institutions (%)
People in Group quarters - Long-term care (%)
People in Group quarters - Homes for abused, dependent, and neglected children (%)
People in Group quarters - Residential treatment centers for emotionally disturbed children (%)
People in Group quarters - Training schools for juvenile delinquents (%)
People in Group quarters - Short-term care, detention or diagnostic centers for delinquent children (%)
People in Group quarters - Type of juvenile institution unknown (%)
People in Group quarters - Noninstitutionalized population (%)
People in Group quarters - College dormitories (includes college quarters off campus) (%)
People in Group quarters - Military quarters (%)
People in Group quarters - On base (%)
People in Group quarters - Barracks, unaccompanied personnel housing (UPH), (Enlisted/Officer), ;and similar group living quarters for military personnel (%)
People in Group quarters - Transient quarters for temporary residents (%)
People in Group quarters - Military ships (%)
People in Group quarters - Group homes (%)
People in Group quarters - Homes or halfway houses for drug/alcohol abuse (%)
People in Group quarters - Homes for the mentally ill (%)
People in Group quarters - Homes for the mentally retarded (%)
People in Group quarters - Homes for the physically handicapped (%)
People in Group quarters - Other group homes (%)
People in Group quarters - Religious group quarters (%)
People in Group quarters - Dormitories (%)
People in Group quarters - Agriculture workers' dormitories on farms (%)
People in Group quarters - Job Corps and vocational training facilities (%)
People in Group quarters - Other workers' dormitories (%)
People in Group quarters - Crews of maritime vessels (%)
People in Group quarters - Other nonhousehold living situations (%)
People in Group quarters - Other noninstitutional group quarters (%)
Residents speaking English at home (%)
Residents speaking English at home - Born in the United States (%)
Residents speaking English at home - Native, born elsewhere (%)
Residents speaking English at home - Foreign born (%)
Residents speaking Spanish at home (%)
Residents speaking Spanish at home - Born in the United States (%)
Residents speaking Spanish at home - Native, born elsewhere (%)
Residents speaking Spanish at home - Foreign born (%)
Residents speaking other language at home (%)
Residents speaking other language at home - Born in the United States (%)
Residents speaking other language at home - Native, born elsewhere (%)
Residents speaking other language at home - Foreign born (%)
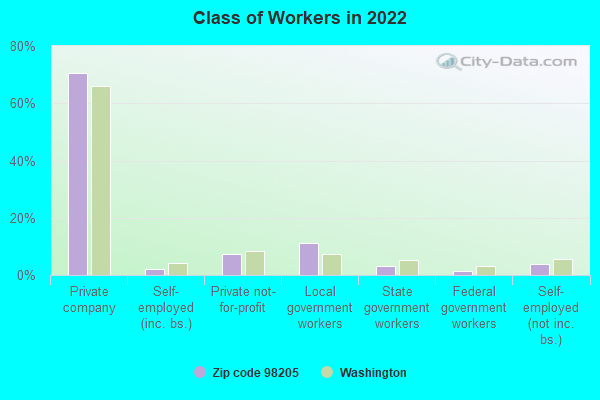
Class of Workers - Employee of private company (%)
Class of Workers - Self-employed in own incorporated business (%)
Class of Workers - Private not-for-profit wage and salary workers (%)
Class of Workers - Local government workers (%)
Class of Workers - State government workers (%)
Class of Workers - Federal government workers (%)
Class of Workers - Self-employed workers in own not incorporated business and Unpaid family workers (%)
House heating fuel used in houses and condos - Utility gas (%)
House heating fuel used in houses and condos - Bottled, tank, or LP gas (%)
House heating fuel used in houses and condos - Electricity (%)
House heating fuel used in houses and condos - Fuel oil, kerosene, etc. (%)
House heating fuel used in houses and condos - Coal or coke (%)
House heating fuel used in houses and condos - Wood (%)
House heating fuel used in houses and condos - Solar energy (%)
House heating fuel used in houses and condos - Other fuel (%)
House heating fuel used in houses and condos - No fuel used (%)
House heating fuel used in apartments - Utility gas (%)
House heating fuel used in apartments - Bottled, tank, or LP gas (%)
House heating fuel used in apartments - Electricity (%)
House heating fuel used in apartments - Fuel oil, kerosene, etc. (%)
House heating fuel used in apartments - Coal or coke (%)
House heating fuel used in apartments - Wood (%)
House heating fuel used in apartments - Solar energy (%)
House heating fuel used in apartments - Other fuel (%)
House heating fuel used in apartments - No fuel used (%)
Armed forces status - In Armed Forces (%)
Armed forces status - Civilian (%)
Armed forces status - Civilian - Veteran (%)
Armed forces status - Civilian - Nonveteran (%)
Fatal accidents locations in years 2005-2021
Fatal accidents locations in 2005
Fatal accidents locations in 2006
Fatal accidents locations in 2007
Fatal accidents locations in 2008
Fatal accidents locations in 2009
Fatal accidents locations in 2010
Fatal accidents locations in 2011
Fatal accidents locations in 2012
Fatal accidents locations in 2013
Fatal accidents locations in 2014
Fatal accidents locations in 2015
Fatal accidents locations in 2016
Fatal accidents locations in 2017
Fatal accidents locations in 2018
Fatal accidents locations in 2019
Fatal accidents locations in 2020
Fatal accidents locations in 2021
Alcohol use - People drinking some alcohol every month (%)
Alcohol use - People not drinking at all (%)
Alcohol use - Average days/month drinking alcohol
Alcohol use - Average drinks/week
Alcohol use - Average days/year people drink much
Audiometry - Average condition of hearing (%)
Audiometry - People that can hear a whisper from across a quiet room (%)
Audiometry - People that can hear normal voice from across a quiet room (%)
Audiometry - Ears ringing, roaring, buzzing (%)
Audiometry - Had a job exposure to loud noise (%)
Audiometry - Had off-work exposure to loud noise (%)
Blood Pressure & Cholesterol - Has high blood pressure (%)
Blood Pressure & Cholesterol - Checking blood pressure at home (%)
Blood Pressure & Cholesterol - Frequently checking blood cholesterol (%)
Blood Pressure & Cholesterol - Has high cholesterol level (%)
Consumer Behavior - Money monthly spent on food at supermarket/grocery store
Consumer Behavior - Money monthly spent on food at other stores
Consumer Behavior - Money monthly spent on eating out
Consumer Behavior - Money monthly spent on carryout/delivered foods
Consumer Behavior - Income spent on food at supermarket/grocery store (%)
Consumer Behavior - Income spent on food at other stores (%)
Consumer Behavior - Income spent on eating out (%)
Consumer Behavior - Income spent on carryout/delivered foods (%)
Current Health Status - General health condition (%)
Current Health Status - Blood donors (%)
Current Health Status - Has blood ever tested for HIV virus (%)
Current Health Status - Left-handed people (%)
Dermatology - People using sunscreen (%)
Diabetes - Diabetics (%)
Diabetes - Had a blood test for high blood sugar (%)
Diabetes - People taking insulin (%)
Diet Behavior & Nutrition - Diet health (%)
Diet Behavior & Nutrition - Milk product consumption (# of products/month)
Diet Behavior & Nutrition - Meals not home prepared (#/week)
Diet Behavior & Nutrition - Meals from fast food or pizza place (#/week)
Diet Behavior & Nutrition - Ready-to-eat foods (#/month)
Diet Behavior & Nutrition - Frozen meals/pizza (#/month)
Drug Use - People that ever used marijuana or hashish (%)
Drug Use - Ever used hard drugs (%)
Drug Use - Ever used any form of cocaine (%)
Drug Use - Ever used heroin (%)
Drug Use - Ever used methamphetamine (%)
Health Insurance - People covered by health insurance (%)
Kidney Conditions-Urology - Avg. # of times urinating at night
Medical Conditions - People with asthma (%)
Medical Conditions - People with anemia (%)
Medical Conditions - People with psoriasis (%)
Medical Conditions - People with overweight (%)
Medical Conditions - Elderly people having difficulties in thinking or remembering (%)
Medical Conditions - People who ever received blood transfusion (%)
Medical Conditions - People having trouble seeing even with glass/contacts (%)
Medical Conditions - People with arthritis (%)
Medical Conditions - People with gout (%)
Medical Conditions - People with congestive heart failure (%)
Medical Conditions - People with coronary heart disease (%)
Medical Conditions - People with angina pectoris (%)
Medical Conditions - People who ever had heart attack (%)
Medical Conditions - People who ever had stroke (%)
Medical Conditions - People with emphysema (%)
Medical Conditions - People with thyroid problem (%)
Medical Conditions - People with chronic bronchitis (%)
Medical Conditions - People with any liver condition (%)
Medical Conditions - People who ever had cancer or malignancy (%)
Mental Health - People who have little interest in doing things (%)
Mental Health - People feeling down, depressed, or hopeless (%)
Mental Health - People who have trouble sleeping or sleeping too much (%)
Mental Health - People feeling tired or having little energy (%)
Mental Health - People with poor appetite or overeating (%)
Mental Health - People feeling bad about themself (%)
Mental Health - People who have trouble concentrating on things (%)
Mental Health - People moving or speaking slowly or too fast (%)
Mental Health - People having thoughts they would be better off dead (%)
Oral Health - Average years since last visit a dentist
Oral Health - People embarrassed because of mouth (%)
Oral Health - People with gum disease (%)
Oral Health - General health of teeth and gums (%)
Oral Health - Average days a week using dental floss/device
Oral Health - Average days a week using mouthwash for dental problem
Oral Health - Average number of teeth
Pesticide Use - Households using pesticides to control insects (%)
Pesticide Use - Households using pesticides to kill weeds (%)
Physical Activity - People doing vigorous-intensity work activities (%)
Physical Activity - People doing moderate-intensity work activities (%)
Physical Activity - People walking or bicycling (%)
Physical Activity - People doing vigorous-intensity recreational activities (%)
Physical Activity - People doing moderate-intensity recreational activities (%)
Physical Activity - Average hours a day doing sedentary activities
Physical Activity - Average hours a day watching TV or videos
Physical Activity - Average hours a day using computer
Physical Functioning - People having limitations keeping them from working (%)
Physical Functioning - People limited in amount of work they can do (%)
Physical Functioning - People that need special equipment to walk (%)
Physical Functioning - People experiencing confusion/memory problems (%)
Physical Functioning - People requiring special healthcare equipment (%)
Prescription Medications - Average number of prescription medicines taking
Preventive Aspirin Use - Adults 40+ taking low-dose aspirin (%)
Reproductive Health - Vaginal deliveries (%)
Reproductive Health - Cesarean deliveries (%)
Reproductive Health - Deliveries resulted in a live birth (%)
Reproductive Health - Pregnancies resulted in a delivery (%)
Reproductive Health - Women breastfeeding newborns (%)
Reproductive Health - Women that had a hysterectomy (%)
Reproductive Health - Women that had both ovaries removed (%)
Reproductive Health - Women that have ever taken birth control pills (%)
Reproductive Health - Women taking birth control pills (%)
Reproductive Health - Women that have ever used Depo-Provera or injectables (%)
Reproductive Health - Women that have ever used female hormones (%)
Sexual Behavior - People 18+ that ever had sex (vaginal, anal, or oral) (%)
Sexual Behavior - Males 18+ that ever had vaginal sex with a woman (%)
Sexual Behavior - Males 18+ that ever performed oral sex on a woman (%)
Sexual Behavior - Males 18+ that ever had anal sex with a woman (%)
Sexual Behavior - Males 18+ that ever had any sex with a man (%)
Sexual Behavior - Females 18+ that ever had vaginal sex with a man (%)
Sexual Behavior - Females 18+ that ever performed oral sex on a man (%)
Sexual Behavior - Females 18+ that ever had anal sex with a man (%)
Sexual Behavior - Females 18+ that ever had any kind of sex with a woman (%)
Sexual Behavior - Average age people first had sex
Sexual Behavior - Average number of female sex partners in lifetime (males 18+)
Sexual Behavior - Average number of female vaginal sex partners in lifetime (males 18+)
Sexual Behavior - Average age people first performed oral sex on a woman (18+)
Sexual Behavior - Average number of woman performed oral sex on in lifetime (18+)
Sexual Behavior - Average number of male sex partners in lifetime (males 18+)
Sexual Behavior - Average number of male anal sex partners in lifetime (males 18+)
Sexual Behavior - Average age people first performed oral sex on a man (18+)
Sexual Behavior - Average number of male oral sex partners in lifetime (18+)
Sexual Behavior - People using protection when performing oral sex (%)
Sexual Behavior - Average number of times people have vaginal or anal sex a year
Sexual Behavior - People having sex without condom (%)
Sexual Behavior - Average number of male sex partners in lifetime (females 18+)
Sexual Behavior - Average number of male vaginal sex partners in lifetime (females 18+)
Sexual Behavior - Average number of female sex partners in lifetime (females 18+)
Sexual Behavior - Circumcised males 18+ (%)
Sleep Disorders - Average hours sleeping at night
Sleep Disorders - People that has trouble sleeping (%)
Smoking-Cigarette Use - People smoking cigarettes (%)
Taste & Smell - People 40+ having problems with smell (%)
Taste & Smell - People 40+ having problems with taste (%)
Taste & Smell - People 40+ that ever had wisdom teeth removed (%)
Taste & Smell - People 40+ that ever had tonsils teeth removed (%)
Taste & Smell - People 40+ that ever had a loss of consciousness because of a head injury (%)
Taste & Smell - People 40+ that ever had a broken nose or other serious injury to face or skull (%)
Taste & Smell - People 40+ that ever had two or more sinus infections (%)
Weight - Average height (inches)
Weight - Average weight (pounds)
Weight - Average BMI
Weight - People that are obese (%)
Weight - People that ever were obese (%)
Weight - People trying to lose weight (%)
Urban population: 15,409
Rural population: 1,030
Estimated median house/condo value in 2022: $575,437
98205:
$575,437Washington:
$569,500
According to our research of Washington and other state lists, there was 1 registered sex offender living in 98205 zip code as of May 23, 2024 . The ratio of all residents to sex offenders in zip code 98205 is 12,966 to 1.The ratio of registered sex offenders to all residents in this zip code is much lower than the state average.
Median resident age: This zip code:
35.8 yearsWashington median age:
38.4 years
Average household size: This zip code:
2.9 peopleWashington:
2.5 people
Averages for the 2004 tax year for zip code 98205, filed in 2005:
Average Adjusted Gross Income (AGI) in 2004: $48,636 (Individual Income Tax Returns) Here:
$48,636State:
$54,331
Salary/wage: $46,804 (reported on 89.8% of returns )Here:
$46,804State:
$45,761
(% of AGI for various income ranges: 132.2% for AGIs below $10k , 77.2% for AGIs $10k-25k , 87.5% for AGIs $25k-50k , 90.0% for AGIs $50k-75k , 90.8% for AGIs $75k-100k , 77.6% for AGIs over 100k ) Taxable interest for individuals: $815 (reported on 40.1% of returns )This zip code:
$815Washington:
$2,110
(% of AGI for various income ranges: 5.6% for AGIs below $10k , 1.6% for AGIs $10k-25k , 0.6% for AGIs $25k-50k , 0.5% for AGIs $50k-75k , 0.3% for AGIs $75k-100k , 0.8% for AGIs over 100k ) Taxable dividends: $1,524 (reported on 22.1% of returns )(% of AGI for various income ranges: 2.4% for AGIs below $10k , 1.0% for AGIs $10k-25k , 0.5% for AGIs $25k-50k , 0.4% for AGIs $50k-75k , 0.5% for AGIs $75k-100k , 1.3% for AGIs over 100k ) Net capital gain/loss: +$4,755 (reported on 17.0% of returns )Here:
+$4,755State:
+$15,835
(% of AGI for various income ranges: -2.0% for AGIs below $10k , 0.6% for AGIs $10k-25k , 0.5% for AGIs $25k-50k , 0.4% for AGIs $50k-75k , 1.2% for AGIs $75k-100k , 5.1% for AGIs over 100k ) Profit/loss from business: +$10,059 (reported on 13.4% of returns )Here:
+$10,059State:
+$13,994
(% of AGI for various income ranges: 6.5% for AGIs below $10k , 4.0% for AGIs $10k-25k , 3.4% for AGIs $25k-50k , 1.7% for AGIs $50k-75k , 2.1% for AGIs $75k-100k , 3.7% for AGIs over 100k ) IRA payment deduction: $2,439 (reported on 2.0% of returns )98205:
$2,439Washington:
$3,001
(% of AGI for various income ranges: 0.8% for AGIs below $10k , 0.2% for AGIs $25k-50k , 0.1% for AGIs $50k-75k , 0.1% for AGIs $75k-100k , 0.1% for AGIs over 100k ) Self-employed pension: $7,684 (reported on 0.3% of returns )Here:
$7,684Washington:
$14,244
Total itemized deductions: $17,048 (24% of AGI, reported on 49.0% of returns )Here:
$17,048State:
$19,669
Here:
24.5% of AGIState:
20.7% of AGI
(% of AGI for various income ranges: 25.4% for AGIs below $10k , 13.4% for AGIs $10k-25k , 17.0% for AGIs $25k-50k , 18.6% for AGIs $50k-75k , 18.4% for AGIs $75k-100k , 15.1% for AGIs over 100k ) Charity contributions deductions: $2,071 (3% of AGI, reported on 40.1% of returns )Here:
2.8% of AGIState:
3.5% of AGI
(% of AGI for various income ranges: 1.3% for AGIs below $10k , 1.0% for AGIs $10k-25k , 1.3% for AGIs $25k-50k , 1.6% for AGIs $50k-75k , 2.0% for AGIs $75k-100k , 2.1% for AGIs over 100k ) Total tax: $5,740 (reported on 81.1% of returns )(% of AGI for various income ranges: 4.5% for AGIs below $10k , 4.3% for AGIs $10k-25k , 6.7% for AGIs $25k-50k , 7.8% for AGIs $50k-75k , 9.4% for AGIs $75k-100k , 15.8% for AGIs over 100k ) Earned income credit: $1,556 (reported on 9.8% of returns )Percentage of individuals using paid preparers for their 2004 taxes: 46.2%(% for various income ranges: 36.1% for AGIs below $10k , 50.0% for AGIs $10k-25k , 49.4% for AGIs $25k-50k , 46.4% for AGIs $50k-75k , 43.2% for AGIs $75k-100k , 50.8% for AGIs over 100k )
Estimated median household income in 2022: This zip code:
$125,666Washington:
$91,306
Nearest zip codes: 98201 ,
98270 ,
98207 ,
98203 ,
98258 ,
98208 .
Marysville Zip Code Map
Percentage of family households: This zip code:
57.2%Washington:
45.0%
Percentage of households with unmarried partners: This zip code:
8.4%Washington:
48.7%
No gay or lesbian households reported
Household received Food Stamps/SNAP in the past 12 months: 244Household did not receive Food Stamps/SNAP in the past 12 months: 5,432
Women who had a birth in the past 12 months: 149 (111 now married , 37 unmarried) Women who did not have a birth in the past 12 months: 3,981 (1,966 now married , 1,998 unmarried)
Housing units in zip code 98205 with a mortgage: 3,446 (55
second mortgage , 353
home equity loan , 13
both second mortgage and home equity loan )
Houses without a mortgage: 974
Median monthly owner costs for units with a mortgage: $2,599
Median monthly owner costs for units without a mortgage: $790
Residents with income below the poverty level in 2022:
This zip code:
5.5%Whole state:
10.0%
Residents with income below 50% of the poverty level in 2022:
This zip code:
4.5%Whole state:
4.6%
Median number of rooms in houses and condos: Median number of rooms in apartments: Notable locations in this zip code not listed on our city pages
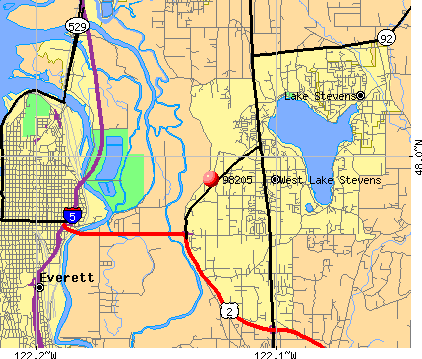
Click to draw/clear zip code borders Notable locations in zip code 98205: (A) , Homeland (B) , Dagmars Marina (C) , Dagmars Yacht Club (D) , Seacrest Marina (E) , Everett Water Pollution Control Facility (F) , Lake Stevens Sewage Treatment Plant (G) . Display/hide their locations on the map
Churches in zip code 98205 include: (A) , Lake Country Baptist Church (B) , Lamb of God Luthern Church (C) . Display/hide their locations on the map
Streams, rivers, and creeks: (A) , Snohomish River (B) , Steamboat Slough (C) , Union Slough (D) , Burri Creek (E) . Display/hide their locations on the map
Year house built (houses)
1,614 2014 or later1,322 2010 to 20131,280 2000 to 20091,319 1990 to 1999351 1980 to 1989620 1970 to 1979326 1960 to 1969113 1950 to 195977 1940 to 1949180 1939 or earlier
Zip code 98205 household income distribution in 2022 79 Less than $10,00067 $10,000 to $14,9998 $15,000 to $19,999126 $20,000 to $24,99921 $25,000 to $29,99956 $30,000 to $34,99914 $35,000 to $39,999106 $40,000 to $44,999143 $45,000 to $49,999297 $50,000 to $59,999530 $60,000 to $74,9991,147 $75,000 to $99,9991,056 $100,000 to $124,999665 $125,000 to $149,999934 $150,000 to $199,999723 $200,000 or moreEstimate of home value of owner-occupied houses/condos in 2022 in zip code 98205 13 $10,000 to $14,9995 $15,000 to $19,9995 $20,000 to $24,99910 $30,000 to $34,99930 $40,000 to $49,9996 $50,000 to $59,9995 $70,000 to $79,9998 $80,000 to $89,99911 $90,000 to $99,99914 $100,000 to $124,99913 $125,000 to $149,99910 $150,000 to $174,99919 $175,000 to $199,99988 $200,000 to $249,999348 $250,000 to $299,9991,533 $300,000 to $399,9991,275 $400,000 to $499,9991,359 $500,000 to $749,999189 $750,000 to $999,999101 $1,000,000 to $1,499,99918 $2,000,000 or moreRent paid by renters in 2022 in zip code 98205 3 $200 to $24926 $250 to $2994 $500 to $5492 $600 to $6494 $650 to $69910 $800 to $89920 $900 to $99990 $1,000 to $1,249170 $1,250 to $1,499790 $1,500 to $1,999144 $2,000 to $2,49919 No cash rent
Median gross rent in 2022: $2,402.
Median price asked for vacant for-sale houses and condos in 2022: $1,978,962.
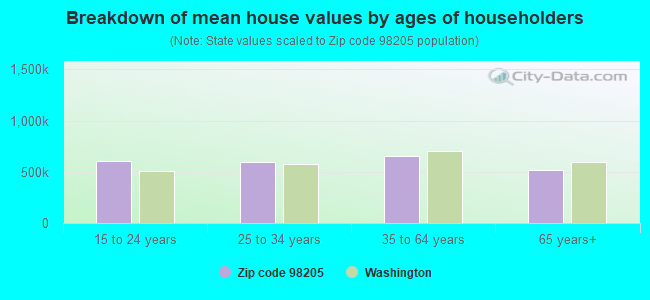
Estimated median house (or condo) value in 2022 for: White Non-Hispanic householders: $594,472Black or African American householders: $705,018American Indian or Alaska Native householders: $542,707Asian householders: $570,426Some other race householders: $577,774Two or more races householders: $498,956Hispanic or Latino householders: $607,497Estimated median house or condo value in 2022: $575,437
98205:
$575,437Washington:
$569,500
Lower value quartile - upper value quartile: $506,432 - $757,206
Mean price in 2022: Detached houses: $725,863Here:
$725,863State:
$734,307
Townhouses or other attached units: $594,911Here:
$594,911State:
$657,697
In 2-unit structures: $444,491Here:
$444,491State:
$534,634
In 3-to-4-unit structures: $435,161Here:
$435,161State:
$510,239
In 5-or-more-unit structures: $313,369Here:
$313,369State:
$503,183
Mobile homes: $177,971Here:
$177,971State:
$218,362
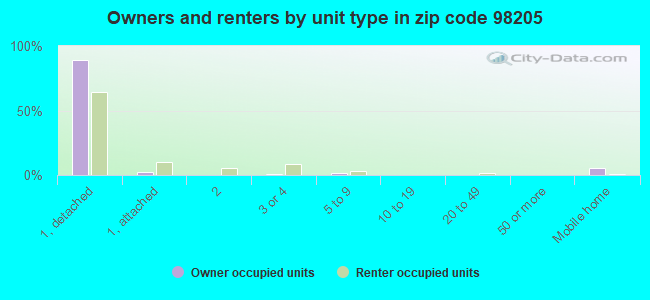
Housing units in structures:
One, detached: 4,816One, attached: 214Two: 633 or 4: 1275 to 9: 8620 to 49: 1450 or more: 12Mobile homes: 267Boats, RVs, vans, etc.: 22Unemployment : 3.8%
Means of transportation to work in zip code 98205 73.7% 6,479 Drove a car alone9.7% 852 Carpooled1.4% 120 Bus or trolley bus0.1% 12 Subway or elevated0.2% 15 Motorcycle0.7% 61 Walked0.1% 7 Other means13.0% 1,139 Worked at homeTravel time to work (commute) in zip code 98205 64 Less than 5 minutes420 5 to 9 minutes642 10 to 14 minutes1,014 15 to 19 minutes1,008 20 to 24 minutes602 25 to 29 minutes1,089 30 to 34 minutes294 35 to 39 minutes319 40 to 44 minutes722 45 to 59 minutes866 60 to 89 minutes377 90 or more minutes
Percentage of zip code residents living and working in this county: 76.8%
Household type by relationship:
Households: 16,440
Male householders: 2,801 (433 living alone ), Female householders: 2,801 (426 living alone )3,234 spouses (3,161 opposite-sex spouses ), 745 unmarried partners , (745 opposite-sex unmarried partners ), 5,053 children (4,854 natural , 64 adopted , 134 stepchildren ), 428 grandchildren , 171 brothers or sisters , 304 parents , 11 foster children , 194 other relatives , 716 non-relatives In group quarters: 6 (-1 institutionalized population )
Size of family households: 1,484 2-persons , 906 3-persons , 1,184 4-persons , 260 5-persons , 265 6-persons , 28 7-or-more-persons
Size of nonfamily households: 862 1-person , 367 2-persons , 100 3-persons , 28 4-persons , 7 5-persons
2,752 married couples with children. single-parent households (97 men , 901 women ).
89.7% of residents of 98205 zip code speak English at home. of residents speak Spanish at home (72% very well, 16% well, 7% not well, 6% not at all ).of residents speak other Indo-European language at home (49% very well, 42% well, 9% not well ).of residents speak Asian or Pacific Island language at home (76% very well, 9% well, 12% not well, 4% not at all ).of residents speak other language at home (100% very well ).
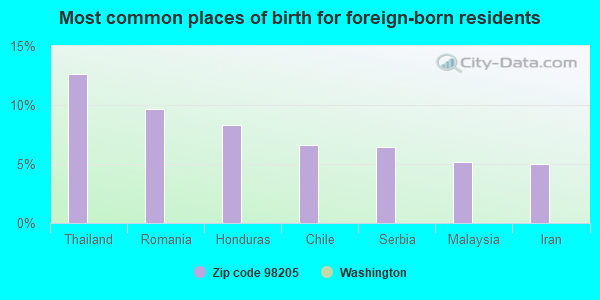
Foreign born population: 1,131 (6.9%)
(66.0%
of them are naturalized citizens )
This zip code:
6.9%Whole state:
15.3%
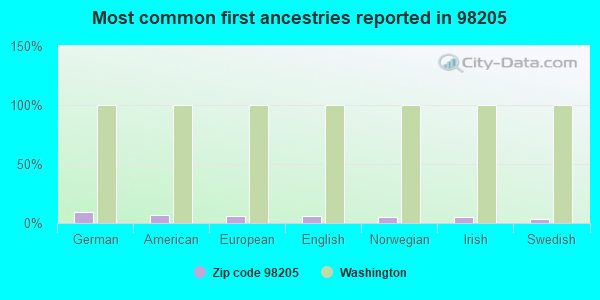
13% Thailand 10% Romania 8% Honduras 7% Chile 6% Serbia 5% Malaysia 5% Iran 9% German 7% American 6% European 6% English 5% Norwegian 5% Irish 3% Swedish
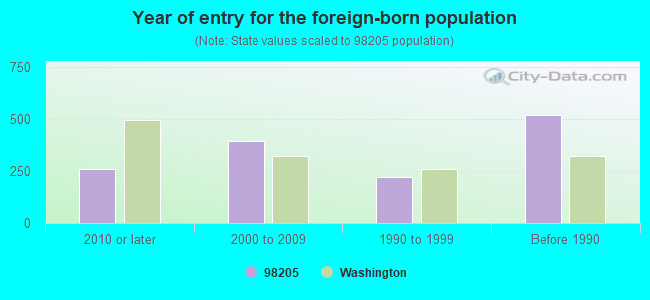
Year of entry for the foreign-born population
261 2010 or later 396 2000 to 2009 222 1990 to 1999 519 Before 1990
Facilities with environmental interests located in this zip code:
CEDAR GROVE COMPOSTING INC EVERETT (3460 34TH AVE NE in EVERETT, WA)
National Pollutant Discharge Elimination System NON-MAJOR (Tracking pollutant discharge elimination systems) - permit STATE MASTER (Washington State Department of Ecology's Facility/Site identification system) - TOXICS-NW1505, VOLUNTARY CLEAN UP PROGRAM, WATQUAL-SO3005630, NPDES STORMWATER PERMIT Business SIC classification: CRUSHED AND BROKEN STONE; FERTILIZERS, MIXING ONLY
AIR PRODUCTS MFG CORP EVERETT (8600 SOPER HILL RD STE A in EVERETT, WA)
Small Quantity Generators, between 100 kg and 1000 kg of hazardous waste/month (Resource Conservation and Recovery Act (tracking hazardous waste)) STATE MASTER (Washington State Department of Ecology's Facility/Site identification system) - TOXICS-2786, UNDERGROUND STORAGE TANK PROGRAM, HAZWASTE-CRK000045110, EPCRA, HAZWASTE-WA0000074195, HAZARDOUS WASTE PROGRAM, SQG Business SIC classification: INDUSTRIAL GASES; PRINTED CIRCUIT BOARDSBusiness NAICS classification: BARE PRINTED CIRCUIT BOARD MANUFACTURING.Organizations: RICHARD BERG (CONTACT/OPERATOR)
, SOLECTRON CORP (CONTACT/OWNER)
Alternative names: HEWLETT PACKARD COMPANY UST 2786, SOLECTRON WASHINGTON INC
AMBERSON EGG FARM (9131 42ND STREET NE in EVERETT, WA)
(Integrated Compliance Information System) - ICIS-10-1999-0084, FORMAL ENFORCEMENT ACTION National Pollutant Discharge Elimination System NON-MAJOR (Tracking pollutant discharge elimination systems) - permit Business SIC classification: POULTRY AND EGGS; DAIRY PRODUCTS, EXCEPT DRIED OR CANNEDAlternative names: AMBERSON FARMS
ARNOLDS BODY SHOP EVERETT (511 91ST AVE NE in EVERETT, WA)
(Resource Conservation and Recovery Act (tracking hazardous waste)) Business NAICS classification: GENERAL AUTOMOTIVE REPAIR.
BOWEN PAINTING (9015 VERNON ROAD, BLDG 3 in EVERETT, WA)
(Resource Conservation and Recovery Act (tracking hazardous waste)) Business NAICS classification: OTHER MILLWORK (INCLUDING FLOORING ).Organizations: FRONTIER PREFINISH INC (CONTACT/OWNER)
Alternative names: FRONTIER PREFINISH INC, FRONTIER PREFINISH INC, GENES PREFINISH
Housing units lacking complete plumbing facilities: 0.9%
Housing units lacking complete kitchen facilities: 0.7%
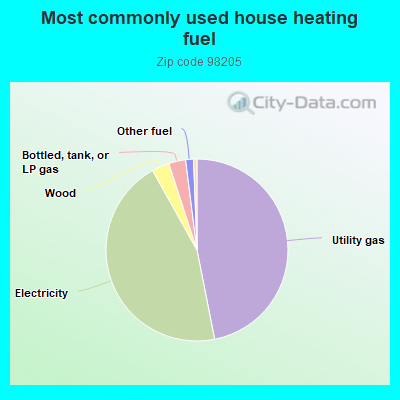
46.9% Utility gas 45.0% Electricity 3.1% Wood 3.0% Bottled, tank, or LP gas 1.4% Other fuel 0.6% Fuel oil, kerosene, etc.
Population in 1990: 10,083. Population change in the 1990s: +7,813 (+77.5%).
Place of birth for U.S.-born residents:
This state: 10,024Northeast: 526Midwest: 929South: 1,016West: 2,332
44% of the 98205 zip code residents lived in the same house 5 years ago.
Out of people who lived in different houses, 66% lived in this county.
Out of people who lived in different counties, 50% lived in Washington.
90% of the 98205 zip code residents lived in the same house 1 year ago.
Out of people who lived in different houses, 67% moved from this county.
Out of people who lived in different houses, 24% moved from different county within same state.
Out of people who lived in different houses, 13% moved from different state.
Out of people who lived in different houses, 3% moved from abroad.
Private vs. public school enrollment:
Students in private schools in grades 1 to 8 (elementary and middle school): 166
Here:
9.9%Washington:
12.4%
Students in private schools in grades 9 to 12 (high school): 47
Students in private undergraduate colleges: 31
Here:
6.1%Washington:
16.5%
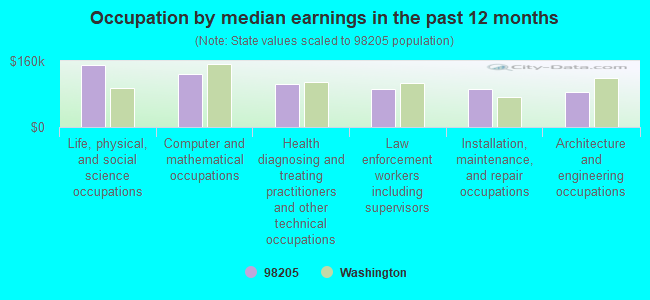
Occupation by median earnings in the past 12 months ($)
149,289 Life, physical, and social science occupations 127,475 Computer and mathematical occupations 103,655 Health diagnosing and treating practitioners and other technical occupations 93,008 Law enforcement workers including supervisors 92,197 Installation, maintenance, and repair occupations 85,256 Architecture and engineering occupations
Companies with federal contracts located in this zip code:
MERCER MARINE AT DAGMARS INC (2010 ROSS AVE in EVERETT, WA; small business) in 2 contracts in 2002
$3,218 with U.S. Army Corps of Engineers - civil program financing only for Maintenance, Repair and Rebuilding of Equipment -- Ships, Small Craft, Pontoons, and Floating Docks. Signed on 2002-02-13. Completion date: 2002-01-28.
with U.S. Army Corps of Engineers - civil program financing only for Non-nuclear Ship Repair (West) Ship repair (including overhauls and conversions) performed on. non-nuclear propelled and nonpropelled ships west of the 108th meridian. Signed on 2002-02-19. Completion date: 2002-02-22.
Top industries in this zip code by the number of employees in 2005:
Accommodation and Food Services: Limited-Service Restaurants (20-49 employees: 3 establishments, 10-19 employees: 3 establishments, 1-4 employees: 1 establishment)Health Care and Social Assistance: Child Day Care Services (50-99: 1, 20-49: 1, 5-9: 2, 1-4: 8)Construction: Electrical Contractors (50-99: 1, 5-9: 1, 1-4: 2)Construction: Land Subdivision (50-99: 1, 1-4: 1)Health Care and Social Assistance: Services for the Elderly and Persons with Disabilities (50-99: 1)
People in group quarters in 2010:
5 people in group homes intended for adults
People in group quarters in 2000:
10 people in other noninstitutional group quarters
7 people in homes for the mentally retarded
Fatal accident statistics in 2013:
Fatal accident count: 2Vehicles involved in fatal accidents: 3Fatal accidents caused by drunken drivers: 1Fatalities: 2Persons involved in fatal accidents: 4Pedestrians involved in fatal accidents: 0
Fatal accident statistics in 2012:
Fatal accident count: 1Vehicles involved in fatal accidents: 2Fatal accidents caused by drunken drivers: 1Fatalities: 1Persons involved in fatal accidents: 1Pedestrians involved in fatal accidents: 3
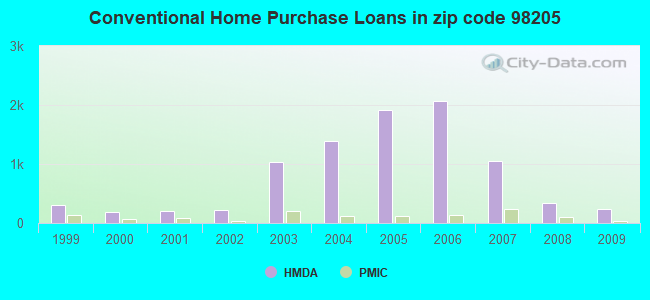
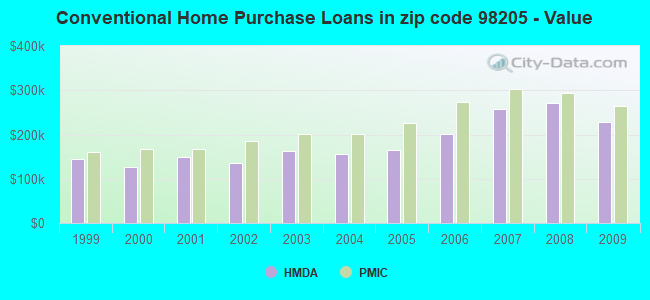
Home Mortgage Disclosure Act Aggregated Statistics For Year 2009(Based on 1 full and 20 partial tracts) A) FHA, FSA/RHS & VA B) Conventional C) Refinancings D) Home Improvement Loans E) Loans on Dwellings For 5+ Families F) Non-occupant Loans on G) Loans On Manufactured Number Average Value Number Average Value Number Average Value Number Average Value Number Average Value Number Average Value Number Average Value
LOANS ORIGINATED 459 $254,043 242 $228,081 1,498 $246,400 23 $146,272 4 $293,852 97 $235,321 42 $201,476 APPLICATIONS APPROVED, NOT ACCEPTED 16 $232,674 26 $230,955 206 $266,536 5 $14,650 0 $0 9 $194,612 5 $109,270 APPLICATIONS DENIED 57 $258,569 28 $249,294 428 $269,613 21 $123,220 0 $0 27 $191,899 8 $181,721 APPLICATIONS WITHDRAWN 45 $237,347 28 $249,809 361 $268,254 11 $101,250 0 $0 24 $208,242 7 $266,891 FILES CLOSED FOR INCOMPLETENESS 5 $301,658 8 $142,522 75 $258,211 3 $98,510 0 $0 6 $202,788 6 $115,470
Aggregated Statistics For Year 2008(Based on 1 full and 20 partial tracts) A) FHA, FSA/RHS & VA B) Conventional C) Refinancings D) Home Improvement Loans E) Loans on Dwellings For 5+ Families F) Non-occupant Loans on G) Loans On Manufactured Number Average Value Number Average Value Number Average Value Number Average Value Number Average Value Number Average Value Number Average Value
LOANS ORIGINATED 333 $289,330 338 $271,849 1,059 $262,459 54 $151,711 0 $0 155 $246,857 30 $176,681 APPLICATIONS APPROVED, NOT ACCEPTED 30 $289,008 35 $294,808 152 $270,826 10 $89,256 0 $0 12 $249,577 5 $209,048 APPLICATIONS DENIED 64 $297,571 82 $264,888 586 $273,349 125 $156,271 0 $0 32 $231,674 36 $150,712 APPLICATIONS WITHDRAWN 37 $281,805 52 $260,420 338 $281,920 14 $151,708 4 $455,258 27 $240,946 8 $206,198 FILES CLOSED FOR INCOMPLETENESS 7 $313,480 12 $242,243 74 $284,267 9 $124,668 0 $0 4 $272,405 6 $256,087
Aggregated Statistics For Year 2007(Based on 1 full and 20 partial tracts) A) FHA, FSA/RHS & VA B) Conventional C) Refinancings D) Home Improvement Loans F) Non-occupant Loans on G) Loans On Manufactured Number Average Value Number Average Value Number Average Value Number Average Value Number Average Value Number Average Value
LOANS ORIGINATED 89 $291,138 1,056 $257,204 1,591 $242,973 119 $115,510 197 $253,004 40 $316,409 APPLICATIONS APPROVED, NOT ACCEPTED 6 $337,545 155 $384,205 272 $222,298 23 $135,833 35 $254,897 17 $1,406,361 APPLICATIONS DENIED 22 $270,380 230 $261,767 711 $235,060 134 $115,443 66 $221,270 24 $107,172 APPLICATIONS WITHDRAWN 11 $264,427 152 $258,371 370 $252,258 54 $196,579 53 $219,888 11 $185,251 FILES CLOSED FOR INCOMPLETENESS 2 $226,000 30 $311,405 114 $267,886 5 $120,790 12 $236,339 1 $181,000
Aggregated Statistics For Year 2006(Based on 1 full and 20 partial tracts) A) FHA, FSA/RHS & VA B) Conventional C) Refinancings D) Home Improvement Loans E) Loans on Dwellings For 5+ Families F) Non-occupant Loans on G) Loans On Manufactured Number Average Value Number Average Value Number Average Value Number Average Value Number Average Value Number Average Value Number Average Value
LOANS ORIGINATED 77 $271,816 2,062 $200,426 1,883 $199,511 174 $115,923 3 $282,267 271 $203,220 45 $129,775 APPLICATIONS APPROVED, NOT ACCEPTED 3 $252,887 221 $188,527 306 $183,334 26 $130,380 0 $0 33 $194,546 4 $141,642 APPLICATIONS DENIED 16 $258,592 382 $196,099 743 $197,721 133 $111,665 0 $0 77 $204,166 28 $79,191 APPLICATIONS WITHDRAWN 10 $290,420 235 $203,910 591 $214,466 68 $103,119 0 $0 45 $202,050 15 $164,693 FILES CLOSED FOR INCOMPLETENESS 1 $376,960 55 $189,205 118 $222,034 6 $101,205 0 $0 9 $140,207 2 $152,955
Aggregated Statistics For Year 2005(Based on 1 full and 20 partial tracts) A) FHA, FSA/RHS & VA B) Conventional C) Refinancings D) Home Improvement Loans F) Non-occupant Loans on G) Loans On Manufactured Number Average Value Number Average Value Number Average Value Number Average Value Number Average Value Number Average Value
LOANS ORIGINATED 91 $226,991 1,921 $164,274 1,902 $179,457 172 $79,648 293 $180,022 41 $116,613 APPLICATIONS APPROVED, NOT ACCEPTED 8 $222,201 172 $170,821 304 $188,414 17 $61,288 52 $158,931 6 $138,133 APPLICATIONS DENIED 9 $195,577 346 $160,477 732 $182,107 125 $83,735 82 $166,955 26 $108,298 APPLICATIONS WITHDRAWN 10 $225,978 213 $186,204 629 $183,622 67 $133,777 61 $186,500 19 $147,064 FILES CLOSED FOR INCOMPLETENESS 0 $0 24 $181,200 162 $217,964 14 $47,748 8 $226,561 7 $196,557
Aggregated Statistics For Year 2004(Based on 1 full and 20 partial tracts) A) FHA, FSA/RHS & VA B) Conventional C) Refinancings D) Home Improvement Loans E) Loans on Dwellings For 5+ Families F) Non-occupant Loans on G) Loans On Manufactured Number Average Value Number Average Value Number Average Value Number Average Value Number Average Value Number Average Value Number Average Value
LOANS ORIGINATED 181 $197,515 1,385 $155,919 1,495 $170,986 100 $65,504 4 $215,238 204 $157,674 38 $108,569 APPLICATIONS APPROVED, NOT ACCEPTED 9 $186,712 137 $167,401 246 $166,273 10 $111,946 0 $0 19 $165,453 11 $119,857 APPLICATIONS DENIED 25 $189,155 207 $149,348 800 $163,743 96 $42,312 0 $0 49 $166,027 44 $90,094 APPLICATIONS WITHDRAWN 17 $183,776 139 $155,917 485 $168,505 24 $51,325 0 $0 25 $186,803 6 $81,280 FILES CLOSED FOR INCOMPLETENESS 0 $0 15 $145,809 175 $186,015 11 $48,612 0 $0 6 $168,973 7 $140,710
Aggregated Statistics For Year 2003(Based on 1 full and 20 partial tracts) A) FHA, FSA/RHS & VA B) Conventional C) Refinancings D) Home Improvement Loans F) Non-occupant Loans on Number Average Value Number Average Value Number Average Value Number Average Value Number Average Value
LOANS ORIGINATED 376 $191,993 1,028 $162,207 3,252 $163,615 98 $42,729 242 $147,813 APPLICATIONS APPROVED, NOT ACCEPTED 16 $210,266 107 $153,021 422 $163,124 27 $35,723 34 $149,514 APPLICATIONS DENIED 37 $200,276 182 $150,967 762 $163,395 45 $32,582 56 $159,766 APPLICATIONS WITHDRAWN 28 $181,608 110 $148,633 583 $173,986 14 $25,058 27 $149,450 FILES CLOSED FOR INCOMPLETENESS 9 $197,579 29 $162,284 114 $159,396 3 $73,937 17 $147,179
Aggregated Statistics For Year 2002(Based on 12 partial tracts) A) FHA, FSA/RHS & VA B) Conventional C) Refinancings D) Home Improvement Loans E) Loans on Dwellings For 5+ Families F) Non-occupant Loans on Number Average Value Number Average Value Number Average Value Number Average Value Number Average Value Number Average Value
LOANS ORIGINATED 160 $179,031 225 $135,570 735 $156,105 20 $21,506 2 $961,655 73 $99,892 APPLICATIONS APPROVED, NOT ACCEPTED 11 $154,039 19 $165,752 83 $156,101 8 $10,275 0 $0 8 $89,062 APPLICATIONS DENIED 5 $155,530 21 $98,358 209 $152,956 21 $16,076 2 $999,120 18 $67,566 APPLICATIONS WITHDRAWN 11 $172,195 20 $131,860 133 $159,259 3 $80,483 0 $0 6 $98,022 FILES CLOSED FOR INCOMPLETENESS 2 $139,875 6 $217,265 40 $130,193 0 $0 0 $0 1 $242,550
Aggregated Statistics For Year 2001(Based on 12 partial tracts) A) FHA, FSA/RHS & VA B) Conventional C) Refinancings D) Home Improvement Loans F) Non-occupant Loans on Number Average Value Number Average Value Number Average Value Number Average Value Number Average Value
LOANS ORIGINATED 183 $170,118 200 $149,750 576 $143,190 37 $38,764 53 $118,384 APPLICATIONS APPROVED, NOT ACCEPTED 6 $148,563 20 $142,172 77 $151,414 0 $0 2 $179,010 APPLICATIONS DENIED 5 $157,528 28 $78,878 169 $118,561 32 $20,540 5 $164,926 APPLICATIONS WITHDRAWN 15 $149,692 33 $120,887 116 $127,313 6 $19,123 5 $101,244 FILES CLOSED FOR INCOMPLETENESS 0 $0 5 $148,846 42 $134,481 2 $16,650 10 $61,528
Aggregated Statistics For Year 2000(Based on 12 partial tracts) A) FHA, FSA/RHS & VA B) Conventional C) Refinancings D) Home Improvement Loans E) Loans on Dwellings For 5+ Families F) Non-occupant Loans on Number Average Value Number Average Value Number Average Value Number Average Value Number Average Value Number Average Value
LOANS ORIGINATED 118 $157,792 179 $126,210 91 $111,712 49 $42,023 2 $2,138,950 14 $130,739 APPLICATIONS APPROVED, NOT ACCEPTED 3 $182,617 24 $145,561 27 $142,346 8 $29,255 0 $0 2 $81,595 APPLICATIONS DENIED 11 $144,362 49 $108,723 95 $85,103 44 $26,616 0 $0 6 $88,582 APPLICATIONS WITHDRAWN 0 $0 16 $179,208 48 $123,222 5 $25,590 0 $0 1 $661,500 FILES CLOSED FOR INCOMPLETENESS 0 $0 3 $72,160 13 $122,451 3 $22,203 0 $0 0 $0
Aggregated Statistics For Year 1999(Based on 1 full and 8 partial tracts) A) FHA, FSA/RHS & VA B) Conventional C) Refinancings D) Home Improvement Loans F) Non-occupant Loans on Number Average Value Number Average Value Number Average Value Number Average Value Number Average Value
LOANS ORIGINATED 208 $158,390 312 $144,330 397 $121,480 67 $21,770 38 $117,914 APPLICATIONS APPROVED, NOT ACCEPTED 2 $117,100 31 $125,799 91 $114,018 18 $19,558 14 $128,041 APPLICATIONS DENIED 13 $149,915 76 $113,749 183 $123,779 47 $19,176 10 $117,494 APPLICATIONS WITHDRAWN 15 $166,251 45 $130,189 113 $119,000 7 $60,551 4 $119,315 FILES CLOSED FOR INCOMPLETENESS 3 $162,390 7 $154,884 50 $128,764 1 $30,340 2 $216,970
Private Mortgage Insurance Companies Aggregated Statistics For Year 2009(Based on 1 full and 20 partial tracts) A) Conventional B) Refinancings C) Non-occupant Loans on Number Average Value Number Average Value Number Average Value
LOANS ORIGINATED 30 $263,300 20 $293,186 2 $221,145 APPLICATIONS APPROVED, NOT ACCEPTED 11 $277,699 15 $258,051 0 $0 APPLICATIONS DENIED 3 $364,727 6 $256,352 0 $0 APPLICATIONS WITHDRAWN 4 $358,550 5 $296,330 0 $0 FILES CLOSED FOR INCOMPLETENESS 0 $0 2 $380,850 2 $318,055
Aggregated Statistics For Year 2008(Based on 1 full and 20 partial tracts) A) Conventional B) Refinancings C) Non-occupant Loans on D) Loans On Manufactured Number Average Value Number Average Value Number Average Value Number Average Value
LOANS ORIGINATED 106 $293,075 126 $297,682 2 $196,870 1 $246,000 APPLICATIONS APPROVED, NOT ACCEPTED 67 $318,325 42 $322,059 4 $353,058 0 $0 APPLICATIONS DENIED 7 $422,689 15 $279,919 4 $275,818 1 $162,000 APPLICATIONS WITHDRAWN 6 $328,850 7 $274,750 0 $0 0 $0 FILES CLOSED FOR INCOMPLETENESS 0 $0 2 $225,635 0 $0 0 $0
Aggregated Statistics For Year 2007(Based on 1 full and 20 partial tracts) A) Conventional B) Refinancings C) Non-occupant Loans on D) Loans On Manufactured Number Average Value Number Average Value Number Average Value Number Average Value
LOANS ORIGINATED 243 $302,493 104 $300,829 11 $315,281 3 $152,300 APPLICATIONS APPROVED, NOT ACCEPTED 25 $303,932 24 $285,765 4 $303,468 0 $0 APPLICATIONS DENIED 1 $157,000 10 $254,224 0 $0 1 $157,000 APPLICATIONS WITHDRAWN 11 $275,378 5 $307,512 0 $0 0 $0 FILES CLOSED FOR INCOMPLETENESS 9 $304,604 3 $384,953 0 $0 0 $0
Aggregated Statistics For Year 2006(Based on 1 full and 20 partial tracts) A) Conventional B) Refinancings C) Non-occupant Loans on D) Loans On Manufactured Number Average Value Number Average Value Number Average Value Number Average Value
LOANS ORIGINATED 129 $274,021 53 $264,270 8 $223,179 2 $184,005 APPLICATIONS APPROVED, NOT ACCEPTED 13 $216,371 23 $242,623 2 $248,470 1 $136,000 APPLICATIONS DENIED 0 $0 0 $0 0 $0 0 $0 APPLICATIONS WITHDRAWN 5 $236,318 4 $267,635 1 $284,000 0 $0 FILES CLOSED FOR INCOMPLETENESS 0 $0 1 $351,010 0 $0 0 $0
Aggregated Statistics For Year 2005(Based on 1 full and 20 partial tracts) A) Conventional B) Refinancings C) Non-occupant Loans on D) Loans On Manufactured Number Average Value Number Average Value Number Average Value Number Average Value
LOANS ORIGINATED 112 $226,738 103 $224,285 11 $207,756 4 $171,508 APPLICATIONS APPROVED, NOT ACCEPTED 20 $261,214 19 $220,900 4 $219,210 0 $0 APPLICATIONS DENIED 3 $191,793 2 $221,470 0 $0 0 $0 APPLICATIONS WITHDRAWN 3 $280,280 8 $212,951 1 $376,320 0 $0 FILES CLOSED FOR INCOMPLETENESS 3 $250,890 2 $183,500 0 $0 0 $0
Aggregated Statistics For Year 2004(Based on 1 full and 20 partial tracts) A) Conventional B) Refinancings C) Non-occupant Loans on D) Loans On Manufactured Number Average Value Number Average Value Number Average Value Number Average Value
LOANS ORIGINATED 121 $201,835 107 $196,826 21 $204,097 1 $126,000 APPLICATIONS APPROVED, NOT ACCEPTED 16 $181,539 27 $204,691 5 $144,782 0 $0 APPLICATIONS DENIED 3 $223,593 5 $192,114 2 $230,925 0 $0 APPLICATIONS WITHDRAWN 8 $200,770 15 $206,546 3 $161,700 0 $0 FILES CLOSED FOR INCOMPLETENESS 2 $134,050 1 $149,000 2 $134,050 0 $0
Aggregated Statistics For Year 2003(Based on 1 full and 20 partial tracts) A) Conventional B) Refinancings C) Non-occupant Loans on Number Average Value Number Average Value Number Average Value
LOANS ORIGINATED 199 $200,958 293 $183,575 30 $187,362 APPLICATIONS APPROVED, NOT ACCEPTED 25 $215,424 79 $185,573 4 $193,842 APPLICATIONS DENIED 1 $195,000 3 $170,177 0 $0 APPLICATIONS WITHDRAWN 8 $204,771 18 $196,496 1 $155,490 FILES CLOSED FOR INCOMPLETENESS 1 $214,430 1 $188,000 0 $0
Aggregated Statistics For Year 2002(Based on 12 partial tracts) A) Conventional B) Refinancings C) Non-occupant Loans on Number Average Value Number Average Value Number Average Value
LOANS ORIGINATED 38 $184,642 95 $177,351 6 $126,635 APPLICATIONS APPROVED, NOT ACCEPTED 6 $231,070 15 $161,709 1 $242,550 APPLICATIONS DENIED 0 $0 2 $159,025 0 $0 APPLICATIONS WITHDRAWN 2 $159,860 7 $176,749 0 $0 FILES CLOSED FOR INCOMPLETENESS 0 $0 2 $177,345 0 $0
Aggregated Statistics For Year 2001(Based on 12 partial tracts) A) Conventional B) Refinancings C) Non-occupant Loans on Number Average Value Number Average Value Number Average Value
LOANS ORIGINATED 89 $167,801 97 $168,046 8 $143,526 APPLICATIONS APPROVED, NOT ACCEPTED 3 $188,863 9 $173,766 0 $0 APPLICATIONS DENIED 0 $0 7 $154,150 0 $0 APPLICATIONS WITHDRAWN 2 $269,760 3 $213,700 2 $154,030 FILES CLOSED FOR INCOMPLETENESS 2 $140,710 0 $0 0 $0
Aggregated Statistics For Year 2000(Based on 12 partial tracts) A) Conventional B) Refinancings C) Non-occupant Loans on Number Average Value Number Average Value Number Average Value
LOANS ORIGINATED 70 $167,276 15 $160,781 5 $97,326 APPLICATIONS APPROVED, NOT ACCEPTED 5 $177,886 3 $163,767 0 $0 APPLICATIONS DENIED 3 $152,150 2 $157,360 1 $186,690 APPLICATIONS WITHDRAWN 0 $0 0 $0 0 $0 FILES CLOSED FOR INCOMPLETENESS 2 $91,585 0 $0 2 $91,585
Aggregated Statistics For Year 1999(Based on 1 full and 8 partial tracts) A) Conventional B) Refinancings C) Non-occupant Loans on Number Average Value Number Average Value Number Average Value
LOANS ORIGINATED 135 $159,816 66 $152,496 3 $111,657 APPLICATIONS APPROVED, NOT ACCEPTED 9 $125,480 13 $157,763 3 $133,063 APPLICATIONS DENIED 3 $181,930 5 $174,440 0 $0 APPLICATIONS WITHDRAWN 2 $265,655 3 $179,430 0 $0 FILES CLOSED FOR INCOMPLETENESS 1 $280,750 0 $0 0 $0
2002 - 2018 National Fire Incident Reporting System (NFIRS) incidents See full 2006 National Fire Incident Reporting System statistics for zip code 98205, Washington
Most common first names in zip code 98205 among deceased individuals Name Count Lived (average)
William 35 72.2 years John 31 70.1 years Robert 25 71.6 years Donald 22 72.3 years James 21 65.5 years George 21 78.7 years Mary 20 82.3 years Helen 20 76.4 years Margaret 20 80.3 years Marie 19 77.9 years
Most common last names in zip code 98205 among deceased individuals Last name Count Lived (average)
Johnson 23 78.4 years Smith 19 74.0 years Anderson 14 70.8 years Miller 13 75.3 years Thompson 11 72.8 years Nelson 9 75.8 years Jensen 7 83.7 years Wilson 7 71.2 years King 6 87.2 years Campbell 6 78.5 years
Businesses in zip code 98205
MasterBrand Cabinets: 4Taco Bell: 1


 Nearest zip codes: 98201, 98270, 98207, 98203, 98258, 98208.
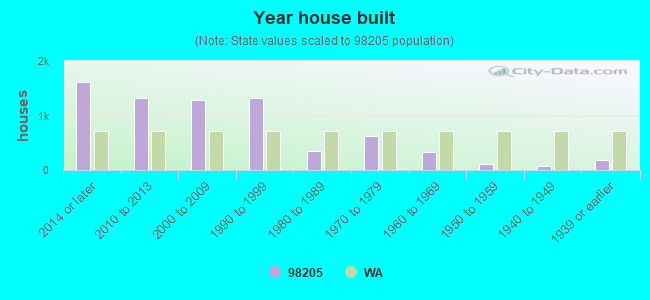


 According to the data from the years 2002 - 2018 the average number of fires per year is 22. The highest number of reported fire incidents - 50 took place in 2006, and the least - 0 in 2016. The data has a dropping trend.
 When looking into fire subcategories, the most reports belonged to: Structure Fires (38.0%), and Outside Fires (36.3%).