Races in Westmore, Vermont (VT) Detailed Stats
Ancestries, Foreign-born residents, place of birth

Discuss Westmore, Vermont races on our local forum with over 2,400,000 registered users
1.0% of Westmore, VT residents are foreign-born , which is 308.0% less than the foreign-born rate of 4.0% across the entire state of Vermont.
Race distribution in Westmore

- 29897.4%White alone
- 51.6%American Indian alone
- 20.7%Asian alone
- 10.3%Two or more races

2000
2022
-
- 585,43196.2%White alone
- 6,8091.1%Two or more races
- 5,5040.9%Hispanic
- 5,1600.8%Asian alone
- 2,9210.5%Black alone
- 2,3250.4%American Indian alone
- 5570.09%Other race alone
- 1200.02%Native Hawaiian and Other
Pacific Islander alone

-
- 583,54690.2%White alone
- 27,3404.2%Two or more races
- 14,7702.3%Hispanic
- 11,5121.8%Asian alone
- 6,2641.0%Black alone
- 2,5210.4%Other race alone
- 1,0520.2%American Indian alone
- 590.01%Native Hawaiian and Other
Pacific Islander alone

Income and house value in Westmore
- Median household income in 2022
- $48,549White non-Hispanic householders
- $108,104Two or more races householders
- Median 2022 house value
- $225,631White Non-Hispanic householders
- $146,860Two or more races householders
Household income for White non-Hispanic householders

Household income for Two or more races householders

Foreign-born residents in Westmore
3 residents are foreign born
| This city: | 1.0% |
| Vermont: | 3.8% |
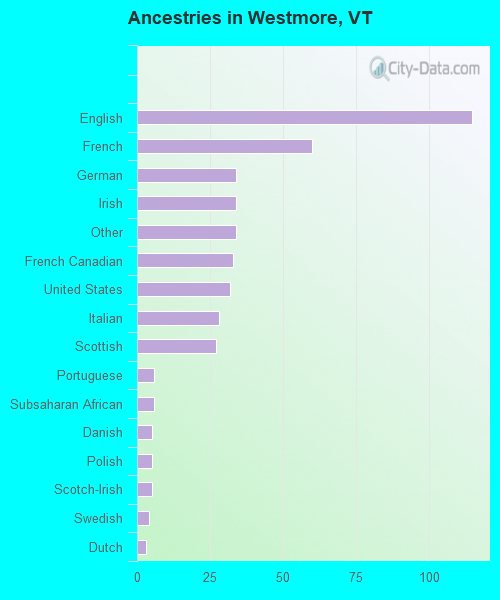
Ancestries in Westmore

- 11526.7%English
- 6013.9%French
- 347.9%German
- 347.9%Irish
- 347.9%Other
- 337.7%French Canadian
- 327.4%United States
- 286.5%Italian
- 276.3%Scottish
- 61.4%Portuguese
- 61.4%Subsaharan African
- 51.2%Danish
- 51.2%Polish
- 51.2%Scotch-Irish
- 40.9%Swedish
- 30.7%Dutch
Zip codes: 05860.