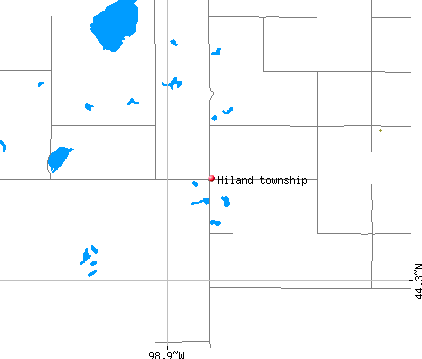
Hiland township, Hand County, South Dakota (SD) detailed profile
Land area: 35.7 sq. mi.
Water area: 0.0 sq. mi.
Population: 32 (all rural)
| Males: 16 | |
| Females: 16 |
Occupied houses/apartments: 32 (27 owner occupied, 5 renter occupied)
| % of renters here: | 16% |
| State: | 32% |
Races in Hiland township:
- White Non-Hispanic: 100.0%
Median age of males: 42.5
Median age of females: 42.5
Discuss South Dakota on our huge forum. We have over 16 million posts!
Average household size: 2.46
| Hiland township: | 2.5 people |
| South Dakota: | 2.5 people |
Average family size: 2.90
| Hiland township: | $47,151 |
| South Dakota: | $48,947 |
| Here: | $361 |
| State: | $529 |
Estimated median house or condo value in 2013: $90,315 (it was $46,400 in 2000)
| : | $90,315 |
| South Dakota: | $138,400 |
| Population density: 1 people per square mile | (very low). |
| This township: | 3.7% |
| Whole state: | 13.2% |
| This township: | 1.9% |
| Whole state: | 5.8% |
Notable locations in this township outside city limits:
Notable location: Hiland Township Hall (A). Display/hide its location on the map
84% of Hiland township residents lived in the same house 5 years ago.
Out of people who lived in different houses, 12% lived in this county.
Out of people who lived in different counties, 47% lived in South Dakota.
Place of birth for U.S.-born residents:
- This state: 65
- Northeast: 0
- Midwest: 42
- South: 0
- West: 0
Median price asked for vacant for-sale houses in 2000: $42,500
Percentage of households with unmarried partners: 0.0%
No gay or lesbian households reported
Housing units in structures:
- One, detached: 34
- Mobile homes: 15
Median worth of mobile homes: $61,700
Housing units in Hiland township with a mortgage: 8 (0 second mortgage, 0 home equity loan, 0 both second mortgage and home equity loan)
Houses without a mortgage: 4
- Agriculture, forestry, fishing and hunting (49%)
- Construction (11%)
- Machinery (11%)
- Truck transportation (9%)
- Health care (9%)
- Food (4%)
- Nonmetallic mineral products (4%)
- Health care (30%)
- Agriculture, forestry, fishing and hunting (20%)
- Educational services (12%)
- Finance and insurance (8%)
- Farm product raw materials merchant wholesalers (6%)
- Miscellaneous nondurable goods merchant wholesalers (6%)
- Food and beverage stores (4%)
- Farmers and farm managers (37%)
- Agricultural workers including supervisors (12%)
- Driver/sales workers and truck drivers (9%)
- Assemblers and fabricators (7%)
- Other health diagnosing and treating practitioners and technical occupations (5%)
- Other healthcare support occupations (4%)
- Carpenters (4%)
- Building and grounds cleaning and maintenance occupations (18%)
- Agricultural workers including supervisors (14%)
- Farmers and farm managers (12%)
- Financial clerks except bookkeeping, accounting, and auditing clerks (10%)
- Other office and administrative support workers including supervisors (8%)
- Computer specialists (4%)
- Preschool, kindergarten, elementary and middle school teachers (4%)
Most common first ancestries reported in Hiland township:
- Norwegian (55.7%)
- German (24.7%)
- United States or American (12.4%)
- Irish (4.1%)
- Swiss (2.1%)
Means of transportation to work:
- Drove a car alone: 31 (62%)
- Walked: 5 (10%)
- Worked at home: 14 (28%)
Most commonly used house heating fuel:
- Bottled, tank, or LP gas (49%)
- Fuel oil, kerosene, etc. (46%)
- Electricity (5%)
91.4% of residents of Hiland township speak English at home.
8.6% of residents speak other Indo-European language at home (100% speak English very well).
Household type by relationship:
Households: 107- In family households: 103 (31 male householders, 2 female householders)
28 spouses, 37 children (37 natural, 0 adopted, 0 stepchildren), 0 grandchildren, 0 brothers or sisters, 3 parents, 0 other relatives, 2 non-relatives
- In nonfamily households: 4 (4 male householders (4 living alone)), 0 female householders (0 living alone)), 0 nonrelatives
Size of family households: 15 2-persons, 5 3-persons, 11 4-persons, 2 5-persons,
Size of nonfamily households: 4 1-person,
7 married couples with children.
2 single-parent households (2 men, 0 women).
Private vs. public school enrollment:
Students in private schools in grades 1 to 8 (elementary and middle school): 0
| Here: | 0.0% |
| South Dakota: | 8.0% |
Students in private schools in grades 9 to 12 (high school): 0
| Here: | 0.0% |
| South Dakota: | 5.6% |
Students in private undergraduate colleges: 0
| Here: | 0.0% |
| South Dakota: | 17.8% |