Estimated zip code population in 2022: 439 Zip code population in 2010: 661 Zip code population in 2000: 523
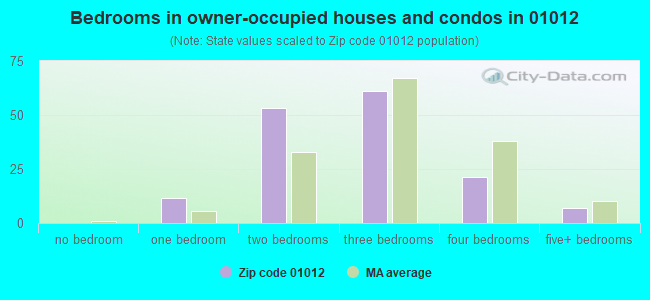
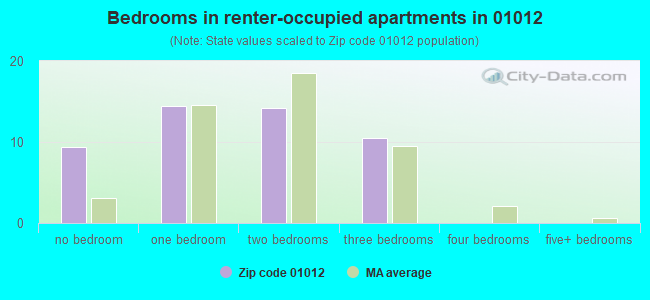
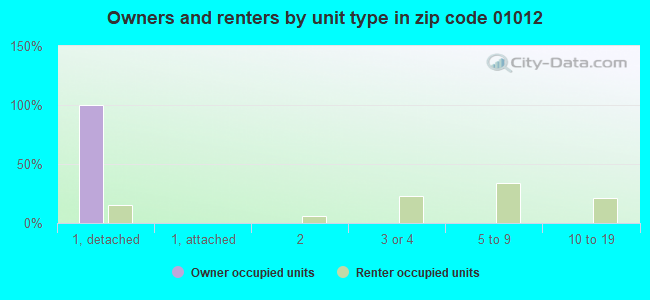
Houses and condos: 249 Renter-occupied apartments: 48
% of renters here:
24%
State:
38%
March 2022 cost of living index in zip code 01012: 87.5 (less than average, U.S. average is 100)
Land area: 13.1 sq. mi. Water area: 0.2 sq. mi.
Population density: 33 people per square mile
(very low).
OSM Map
Google Map
MSN Map
OSM Map
General Map
Google Map
MSN Map
OSM Map
Google Map
MSN Map
OSM Map
Google Map
MSN Map
Please wait while loading the map...
Real estate property taxes paid for housing units in 2022:
This zip code:
1.7% ($5,506)
Massachusetts:
1.0% ($5,536)
Median real estate property taxes paid for housing units with mortgages in 2022: $6,084 (1.5%) Median real estate property taxes paid for housing units with no mortgage in 2022: $4,580 (1.6%)
Business Search- 14 Million verified businesses
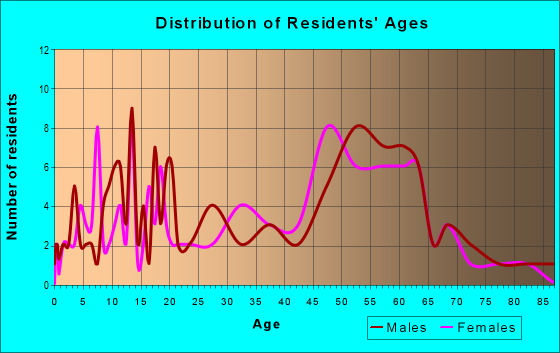
Males: 224
(50.9%)
Females: 215
(49.1%)
For population 25 years and over in 01012:
High school or higher: 93.2%
Bachelor's degree or higher: 20.5%
Graduate or professional degree: 12.2%
Mean travel time to work (commute): 31.8 minutes
For population 15 years and over in 01012:
Never married: 30.2%
Now married: 48.7%
Separated: 0.0%
Widowed: 7.6%
Divorced: 13.5%
Zip code 01012 compared to state average:
Median house value below state average.
Unemployed percentage significantly below state average.
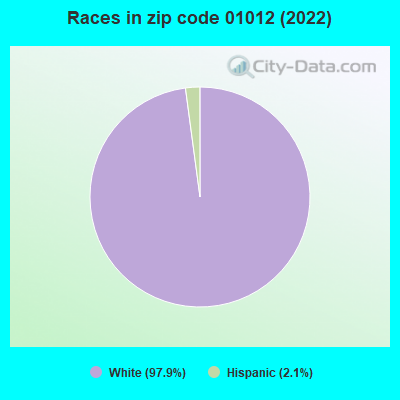
Black race population percentage significantly below state average.
Hispanic race population percentage significantly below state average.
Median age significantly above state average.
Foreign-born population percentage significantly below state average.
Renting percentage below state average.
Length of stay since moving in significantly above state average.
Number of college students below state average.
Percentage of population with a bachelor's degree or higher below state average.
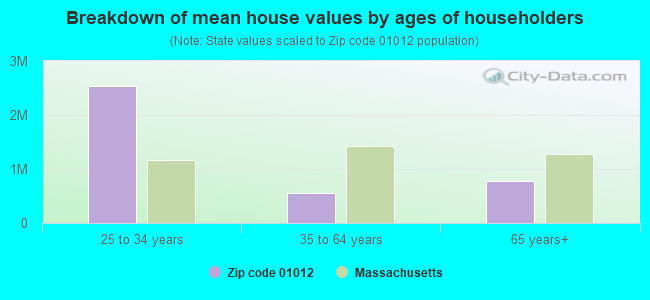
Estimated median house/condo value in 2022: $333,373
01012:
$333,373
Massachusetts:
$534,700
According to our research of Massachusetts and other state lists, there was 1 registered sex offender living in 01012 zip code as of May 28, 2024. The ratio of all residents to sex offenders in zip code 01012 is 535 to 1.
Median resident age:
This zip code:
55.2 years
Massachusetts median age:
40.3 years
Average household size:
This zip code:
2.2 people
Massachusetts:
2.4 people
Averages for the 2020 tax year for zip code 01012, filed in 2021:
Average Adjusted Gross Income (AGI) in 2020: $60,551 (Individual Income Tax Returns)
Here:
$60,551
State:
$105,130
Salary/wage: $56,359 (reported on 70.7% of returns)
Here:
$56,359
State:
$82,951
(% of AGI for various income ranges: 756.2% for AGIs below $25k, 3735.0% for AGIs $25k-50k, 5932.0% for AGIs $50k-75k, 7633.3% for AGIs $75k-100k, 20605.0% for AGIs $100k-200k)
Taxable interest for individuals: $631 (reported on 39.0% of returns)
This zip code:
$631
Massachusetts:
$2,361
(% of AGI for various income ranges: 6.2% for AGIs below $25k, 18.3% for AGIs $25k-50k, 28.0% for AGIs $50k-75k, 56.7% for AGIs $75k-100k, 135.0% for AGIs $100k-200k)
Ordinary dividends: $2,338 (reported on 19.5% of returns)
Here:
$2,338
State:
$10,365
(% of AGI for various income ranges: 58.8% for AGIs below $25k, 132.0% for AGIs $50k-75k, 185.0% for AGIs $100k-200k)
Net capital gain/loss in AGI: +$5,822 (reported on 22.0% of returns)
Here:
+$5,822
State:
+$48,178
(% of AGI for various income ranges: 57.5% for AGIs below $25k, 318.0% for AGIs $50k-75k, 797.5% for AGIs $100k-200k)
Profit/loss from business: +$9,712 (reported on 19.5% of returns)
Here:
+$9,712
State:
+$20,792
(% of AGI for various income ranges: 282.5% for AGIs below $25k, 508.0% for AGIs $50k-75k, 742.5% for AGIs $100k-200k)
Taxable individual retirement arrangement distribution: $14,667 (reported on 14.6% of returns)
01012:
$14,667
Massachusetts:
$22,790
(% of AGI for various income ranges: 731.7% for AGIs $25k-50k, 1470.0% for AGIs $75k-100k)
Total itemized deductions: $22,133 (reported on 7.3% of returns)
Here:
$22,133
State:
$36,722
(% of AGI for various income ranges: 2213.3% for AGIs $75k-100k)
Taxes paid: $8,400 (reported on 7.3% of returns)
01012:
$8,400
State:
$8,782
(% of AGI for various income ranges: 504.0% for AGIs $50k-75k)
Earned income credit: $1,900 (reported on 7.3% of returns)
Here:
$1,900
State:
$1,909
(% of AGI for various income ranges: 71.2% for AGIs below $25k)
Percentage of individuals using paid preparers for their 2020 taxes: 90.2%
Here:
90%
State:
92%
(% for various income ranges: 90.9% for AGIs below $25k, 100.0% for AGIs $25k-50k, 87.5% for AGIs $50k-75k, 80.0% for AGIs $75k-100k, 87.5% for AGIs $100k-200k)
Averages for the 2012 tax year for zip code 01012, filed in 2013:
Average Adjusted Gross Income (AGI) in 2012: $56,467 (Individual Income Tax Returns)
Here:
$56,467
State:
$81,425
Salary/wage: $44,462 (reported on 87.9% of returns)
Here:
$44,462
State:
$64,752
(% of AGI for various income ranges: 66.9% for AGIs below $25k, 79.4% for AGIs $25k-50k, 74.3% for AGIs $50k-75k, 77.0% for AGIs $75k-100k, 61.9% for AGIs $100k-200k)
Taxable interest for individuals: $613 (reported on 45.5% of returns)
This zip code:
$613
Massachusetts:
$2,136
(% of AGI for various income ranges: 1.0% for AGIs below $25k, 0.2% for AGIs $25k-50k, 0.3% for AGIs $50k-75k, 0.7% for AGIs $100k-200k)
Ordinary dividends: $1,500 (reported on 27.3% of returns)
Here:
$1,500
State:
$9,473
(% of AGI for various income ranges: 2.8% for AGIs below $25k, 0.9% for AGIs $50k-75k, 0.7% for AGIs $100k-200k)
Net capital gain/loss in AGI: +$1,420 (reported on 15.2% of returns)
Here:
+$1,420
State:
+$31,437
Profit/loss from business: +$18,543 (reported on 21.2% of returns)
Here:
+$18,543
State:
+$20,662
(% of AGI for various income ranges: 12.2% for AGIs below $25k, 15.0% for AGIs $25k-50k, 31.1% for AGIs $75k-100k)
Taxable individual retirement arrangement distribution: $11,033 (reported on 9.1% of returns)
01012:
$11,033
Massachusetts:
$18,892
Total itemized deductions: $18,853 (22% of AGI, reported on 45.5% of returns)
Here:
$18,853
State:
$28,907
Here:
21.6% of AGI
State:
18.2% of AGI
(% of AGI for various income ranges: 24.1% for AGIs below $25k, 10.3% for AGIs $25k-50k, 16.0% for AGIs $50k-75k, 16.4% for AGIs $75k-100k, 14.4% for AGIs $100k-200k)
Charity contributions: $1,164 (reported on 33.3% of returns)
Here:
$1,164
State:
$4,208
(% of AGI for various income ranges: 1.5% for AGIs below $25k, 1.0% for AGIs $50k-75k, 0.8% for AGIs $100k-200k)
Taxes paid: $9,400 (reported on 45.5% of returns)
01012:
$9,400
State:
$13,303
(% of AGI for various income ranges: 8.1% for AGIs below $25k, 4.3% for AGIs $25k-50k, 7.2% for AGIs $50k-75k, 7.7% for AGIs $75k-100k, 8.6% for AGIs $100k-200k)
Earned income credit: $1,400 (reported on 12.1% of returns)
Here:
$1,400
State:
$1,971
(% of AGI for various income ranges: 3.9% for AGIs below $25k)
Percentage of individuals using paid preparers for their 2012 taxes: 57.6%
Here:
58%
State:
56%
(% for various income ranges: 58.3% for AGIs below $25k, 57.1% for AGIs $25k-50k, 83.3% for AGIs $50k-75k, 60.0% for AGIs $100k-200k)
Averages for the 2004 tax year for zip code 01012, filed in 2005:
Average Adjusted Gross Income (AGI) in 2004: $41,568 (Individual Income Tax Returns)
Here:
$41,568
State:
$62,877
Salary/wage: $37,012 (reported on 86.1% of returns)
Here:
$37,012
State:
$52,969
(% of AGI for various income ranges: 85.3% for AGIs below $10k, 72.3% for AGIs $10k-25k, 80.7% for AGIs $25k-50k, 86.7% for AGIs $50k-75k, 80.4% for AGIs $75k-100k, 61.9% for AGIs over 100k)
Taxable interest for individuals: $552 (reported on 54.5% of returns)
This zip code:
$552
Massachusetts:
$1,945
(% of AGI for various income ranges: 4.6% for AGIs below $10k, 2.1% for AGIs $10k-25k, 0.4% for AGIs $25k-50k, 0.7% for AGIs $50k-75k, 0.3% for AGIs $75k-100k, 0.5% for AGIs over 100k)
Taxable dividends: $793 (reported on 23.7% of returns)
Here:
$793
State:
$5,323
(% of AGI for various income ranges: 4.2% for AGIs below $10k, 0.2% for AGIs $10k-25k, 0.8% for AGIs $25k-50k, 0.3% for AGIs $50k-75k, 0.1% for AGIs $75k-100k, 0.4% for AGIs over 100k)
Net capital gain/loss: +$3,226 (reported on 21.6% of returns)
Here:
+$3,226
State:
+$20,377
(% of AGI for various income ranges: -9.1% for AGIs below $10k, 0.6% for AGIs $25k-50k, 0.7% for AGIs $50k-75k, 0.2% for AGIs $75k-100k, 6.3% for AGIs over 100k)
Profit/loss from business: +$10,258 (reported on 23.9% of returns)
Here:
+$10,258
State:
+$17,837
(% of AGI for various income ranges: 10.7% for AGIs below $10k, 6.9% for AGIs $10k-25k, 7.4% for AGIs $25k-50k, 2.2% for AGIs $50k-75k, 14.9% for AGIs $75k-100k)
IRA payment deduction: $2,308 (reported on 3.3% of returns)
01012:
$2,308
Massachusetts:
$3,100
Total itemized deductions: $15,720 (24% of AGI, reported on 41.4% of returns)
Here:
$15,720
State:
$22,573
Here:
23.6% of AGI
State:
19.5% of AGI
(% of AGI for various income ranges: 18.2% for AGIs $10k-25k, 12.0% for AGIs $25k-50k, 18.5% for AGIs $50k-75k, 16.1% for AGIs $75k-100k, 16.4% for AGIs over 100k)
Charity contributions deductions: $1,445 (2% of AGI, reported on 35.2% of returns)
Here:
$1,445
State:
$3,295
Here:
2.1% of AGI
State:
2.7% of AGI
(% of AGI for various income ranges: 0.8% for AGIs $10k-25k, 0.6% for AGIs $25k-50k, 0.9% for AGIs $50k-75k, 1.1% for AGIs $75k-100k, 2.5% for AGIs over 100k)
Total tax: $5,138 (reported on 83.5% of returns)
01012:
$5,138
State:
$11,494
(% of AGI for various income ranges: 3.6% for AGIs below $10k, 5.3% for AGIs $10k-25k, 8.0% for AGIs $25k-50k, 8.6% for AGIs $50k-75k, 10.8% for AGIs $75k-100k, 16.5% for AGIs over 100k)
Earned income credit: $1,273 (reported on 8.5% of returns)
Here:
$1,273
State:
$1,518
Percentage of individuals using paid preparers for their 2004 taxes: 56.0%
Here:
56%
State:
58%
(% for various income ranges: 45.9% for AGIs below $10k, 54.3% for AGIs $10k-25k, 57.8% for AGIs $25k-50k, 70.2% for AGIs $50k-75k, 58.3% for AGIs $75k-100k, 50.0% for AGIs over 100k)
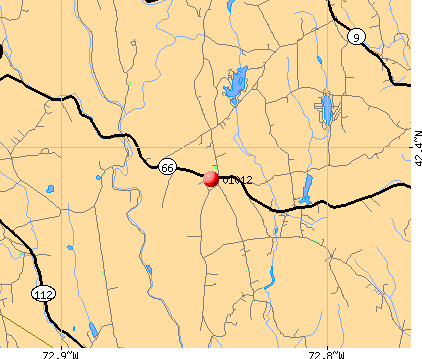
Notable locations in zip code 01012: Chesterfield Fire Department Station 1 Headquarters (A), Chesterfield Town Hall (B). Display/hide their locations on the map
Size of family households: 62 2-persons, 32 3-persons, 33 4-persons, 3 5-persons
Size of nonfamily households: 68 1-person
39 married couples with children.
33 single-parent households (14 men, 19 women).
96.6% of residents of 01012 zip code speak English at home.
2.8% of residents speak Spanish at home (17% very well, 83% not well).
Foreign born population: 0 (0.0%)
:
0.0%
Whole state:
18.0%
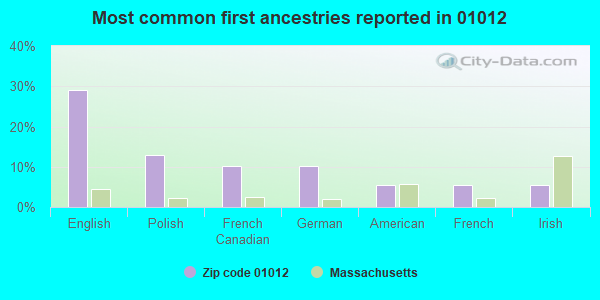
29%English
13%Polish
10%French Canadian
10%German
5%American
5%French
5%Irish
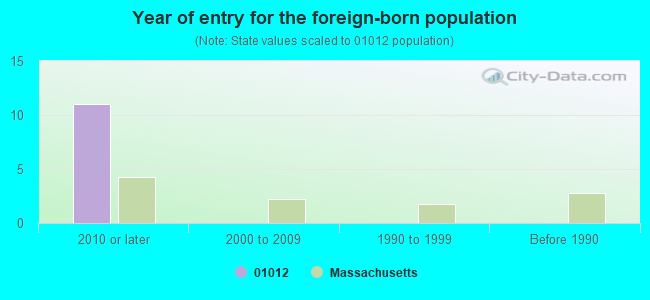
Year of entry for the foreign-born population
112010 or later
02000 to 2009
01990 to 1999
0Before 1990
Facilities with environmental interests located in this zip code:
NEW HINGHAM REGIONAL ELEM (30 SMITH RD in CHESTERFIELD, MA)
(National Center for Education Statistics) - STATE ID-632025 Organizations: CHESTERFIELD-GOSHEN (SCHOOL DISTRICT)
NEW ENGLAND TELE (SOUTH BRYANT ST in CHESTERFIELD, MA)
(Resource Conservation and Recovery Act (tracking hazardous waste))
Housing units lacking complete plumbing facilities: 1.5% Housing units lacking complete kitchen facilities: 1.5%
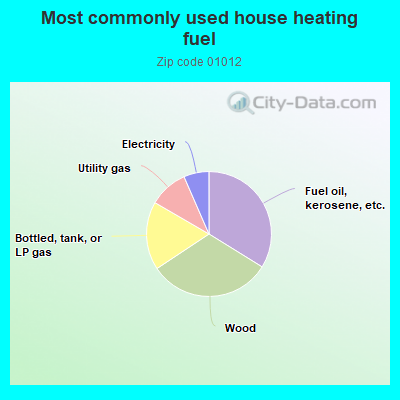
34.2%Fuel oil, kerosene, etc.
32.2%Wood
17.9%Bottled, tank, or LP gas
10.2%Utility gas
6.6%Electricity
Population in 1990: 177. Population change in the 1990s: +346 (+195.5%).
Place of birth for U.S.-born residents:
This state: 366
Northeast: 46
Midwest: 3
West: 9
72% of the 01012 zip code residents lived in the same house 5 years ago. Out of people who lived in different houses, 78% lived in this county. Out of people who lived in different counties, 50% lived in Massachusetts.
100% of the 01012 zip code residents lived in the same house 1 year ago.
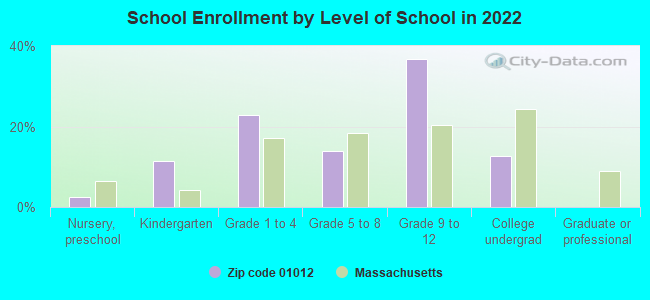
Private vs. public school enrollment:
Students in private schools in grades 1 to 8 (elementary and middle school): 5
Here:
18.6%
Massachusetts:
10.3%
Students in private schools in grades 9 to 12 (high school): 7
Here:
24.0%
Massachusetts:
12.3%
Students in private undergraduate colleges:
Here:
0.0%
Massachusetts:
51.2%
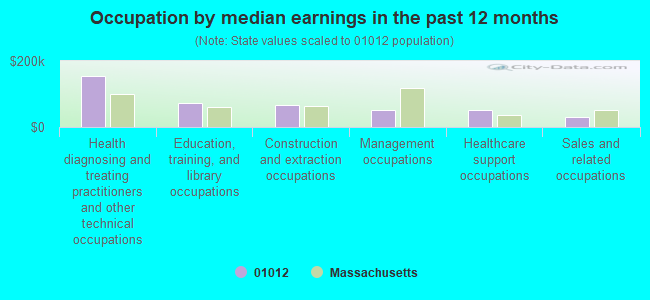
Occupation by median earnings in the past 12 months ($)
154,934Health diagnosing and treating practitioners and other technical occupations
72,888Education, training, and library occupations
67,197Construction and extraction occupations
52,058Management occupations
51,619Healthcare support occupations
29,264Sales and related occupations
Top industries in this zip code by the number of employees in 2005:
Health Care and Social Assistance: Child Day Care Services (10-19 employees: 1 establishment, 5-9 employees: 1 establishment)
Health Care and Social Assistance: Other Individual and Family Services (10-19: 1, 1-4: 1)
Wholesale Trade: Electrical Apparatus and Equipment, Wiring Supplies, and Related Equipment Merchant Wholesalers (10-19: 1)
Construction: Site Preparation Contractors (1-4: 1)
Construction: Residential Remodelers (1-4: 1)
Professional, Scientific, and Technical Services: Landscape Architectural Services (1-4: 1)
Construction: Poured Concrete Foundation and Structure Contractors (1-4: 1)
Administrative and Support and Waste Management and Remediation Services: Office Administrative Services (1-4: 1)
Home Mortgage Disclosure Act Aggregated Statistics For Year 2009 (Based on 2 partial tracts)
A) FHA, FSA/RHS & VA Home Purchase Loans
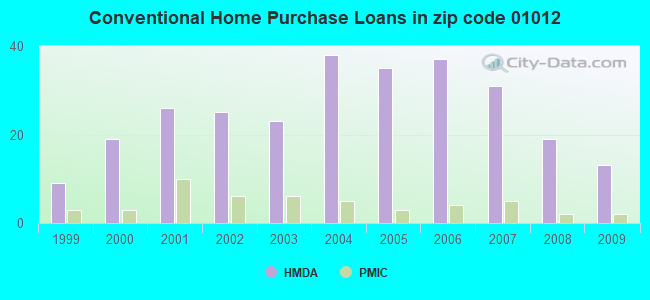
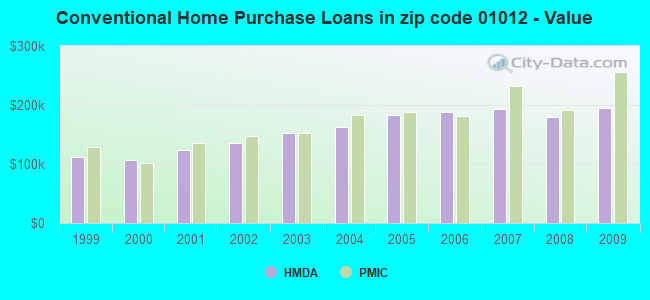
B) Conventional Home Purchase Loans
C) Refinancings
D) Home Improvement Loans
F) Non-occupant Loans on < 5 Family Dwellings (A B C & D)
Number
Average Value
Number
Average Value
Number
Average Value
Number
Average Value
Number
Average Value
LOANS ORIGINATED
5
$201,038
13
$195,295
62
$192,230
15
$137,117
3
$195,687
APPLICATIONS APPROVED, NOT ACCEPTED
0
$0
1
$195,690
4
$185,685
1
$143,450
0
$0
APPLICATIONS DENIED
0
$0
2
$226,900
20
$205,000
3
$115,340
1
$104,720
APPLICATIONS WITHDRAWN
1
$123,070
1
$47,650
9
$216,580
1
$149,060
1
$150,590
FILES CLOSED FOR INCOMPLETENESS
0
$0
1
$308,050
3
$134,620
1
$178,360
1
$38,980
Aggregated Statistics For Year 2008 (Based on 2 partial tracts)
A) FHA, FSA/RHS & VA Home Purchase Loans
B) Conventional Home Purchase Loans
C) Refinancings
D) Home Improvement Loans
F) Non-occupant Loans on < 5 Family Dwellings (A B C & D)
Number
Average Value
Number
Average Value
Number
Average Value
Number
Average Value
Number
Average Value
LOANS ORIGINATED
4
$178,360
19
$179,111
32
$176,362
15
$83,405
4
$185,240
APPLICATIONS APPROVED, NOT ACCEPTED
0
$0
2
$122,815
3
$170,120
2
$46,245
0
$0
APPLICATIONS DENIED
2
$144,345
5
$141,974
14
$187,897
3
$112,027
1
$145,750
APPLICATIONS WITHDRAWN
0
$0
2
$65,865
7
$191,391
1
$124,090
0
$0
FILES CLOSED FOR INCOMPLETENESS
0
$0
0
$0
2
$195,305
0
$0
0
$0
Aggregated Statistics For Year 2007 (Based on 2 partial tracts)
A) FHA, FSA/RHS & VA Home Purchase Loans
B) Conventional Home Purchase Loans
C) Refinancings
D) Home Improvement Loans
F) Non-occupant Loans on < 5 Family Dwellings (A B C & D)
Number
Average Value
Number
Average Value
Number
Average Value
Number
Average Value
Number
Average Value
LOANS ORIGINATED
1
$223,460
31
$193,821
37
$154,512
16
$76,138
6
$206,473
APPLICATIONS APPROVED, NOT ACCEPTED
0
$0
4
$207,790
7
$213,231
2
$69,180
0
$0
APPLICATIONS DENIED
1
$69,820
5
$154,918
23
$205,236
6
$79,243
2
$231,995
APPLICATIONS WITHDRAWN
0
$0
1
$134,790
10
$198,566
1
$14,010
1
$142,690
FILES CLOSED FOR INCOMPLETENESS
0
$0
0
$0
4
$193,138
1
$29,300
1
$118,990
Aggregated Statistics For Year 2006 (Based on 2 partial tracts)
A) FHA, FSA/RHS & VA Home Purchase Loans
B) Conventional Home Purchase Loans
C) Refinancings
D) Home Improvement Loans
E) Loans on Dwellings For 5+ Families
F) Non-occupant Loans on < 5 Family Dwellings (A B C & D)
Number
Average Value
Number
Average Value
Number
Average Value
Number
Average Value
Number
Average Value
Number
Average Value
LOANS ORIGINATED
1
$87,910
37
$187,526
41
$141,849
20
$72,300
1
$81,540
5
$182,538
APPLICATIONS APPROVED, NOT ACCEPTED
0
$0
3
$228,217
8
$118,164
2
$56,440
0
$0
1
$70,070
APPLICATIONS DENIED
0
$0
4
$146,255
27
$160,930
7
$64,937
0
$0
2
$132,495
APPLICATIONS WITHDRAWN
0
$0
2
$279,515
19
$160,953
1
$131,220
0
$0
1
$231,360
FILES CLOSED FOR INCOMPLETENESS
0
$0
1
$181,160
3
$174,623
1
$30,070
0
$0
0
$0
Aggregated Statistics For Year 2005 (Based on 2 partial tracts)
A) FHA, FSA/RHS & VA Home Purchase Loans
B) Conventional Home Purchase Loans
C) Refinancings
D) Home Improvement Loans
F) Non-occupant Loans on < 5 Family Dwellings (A B C & D)
Number
Average Value
Number
Average Value
Number
Average Value
Number
Average Value
Number
Average Value
LOANS ORIGINATED
1
$144,730
35
$183,012
51
$170,981
21
$85,637
5
$152,930
APPLICATIONS APPROVED, NOT ACCEPTED
0
$0
6
$160,227
7
$156,266
1
$65,230
1
$234,160
APPLICATIONS DENIED
0
$0
6
$191,185
30
$166,563
6
$101,283
1
$26,750
APPLICATIONS WITHDRAWN
0
$0
3
$118,990
23
$169,121
4
$101,538
1
$63,700
FILES CLOSED FOR INCOMPLETENESS
0
$0
1
$142,180
5
$165,008
0
$0
0
$0
Aggregated Statistics For Year 2004 (Based on 2 partial tracts)
A) FHA, FSA/RHS & VA Home Purchase Loans
B) Conventional Home Purchase Loans
C) Refinancings
D) Home Improvement Loans
F) Non-occupant Loans on < 5 Family Dwellings (A B C & D)
G) Loans On Manufactured Home Dwelling (A B C & D)
Number
Average Value
Number
Average Value
Number
Average Value
Number
Average Value
Number
Average Value
Number
Average Value
LOANS ORIGINATED
1
$156,190
38
$162,723
59
$147,270
16
$103,576
6
$132,453
0
$0
APPLICATIONS APPROVED, NOT ACCEPTED
0
$0
3
$168,337
10
$136,267
2
$35,670
1
$134,020
0
$0
APPLICATIONS DENIED
0
$0
5
$132,546
20
$153,568
5
$30,322
2
$142,305
1
$26,500
APPLICATIONS WITHDRAWN
0
$0
4
$148,675
27
$143,113
2
$111,350
1
$65,740
0
$0
FILES CLOSED FOR INCOMPLETENESS
0
$0
1
$102,940
6
$173,178
0
$0
0
$0
0
$0
Aggregated Statistics For Year 2003 (Based on 2 partial tracts)
A) FHA, FSA/RHS & VA Home Purchase Loans
B) Conventional Home Purchase Loans
C) Refinancings
D) Home Improvement Loans
F) Non-occupant Loans on < 5 Family Dwellings (A B C & D)
Number
Average Value
Number
Average Value
Number
Average Value
Number
Average Value
Number
Average Value
LOANS ORIGINATED
1
$211,230
23
$151,938
104
$126,511
4
$23,442
7
$115,097
APPLICATIONS APPROVED, NOT ACCEPTED
0
$0
3
$113,300
9
$123,380
1
$87,650
0
$0
APPLICATIONS DENIED
0
$0
3
$120,267
16
$112,717
3
$40,343
0
$0
APPLICATIONS WITHDRAWN
0
$0
2
$122,560
18
$123,988
1
$23,190
2
$62,045
FILES CLOSED FOR INCOMPLETENESS
0
$0
1
$173,260
2
$130,585
0
$0
0
$0
Aggregated Statistics For Year 2002 (Based on 2 partial tracts)
A) FHA, FSA/RHS & VA Home Purchase Loans
B) Conventional Home Purchase Loans
C) Refinancings
D) Home Improvement Loans
F) Non-occupant Loans on < 5 Family Dwellings (A B C & D)
Number
Average Value
Number
Average Value
Number
Average Value
Number
Average Value
Number
Average Value
LOANS ORIGINATED
3
$125,360
25
$135,238
56
$122,836
4
$30,640
3
$96,740
APPLICATIONS APPROVED, NOT ACCEPTED
1
$84,850
2
$123,195
7
$113,094
2
$21,020
1
$34,650
APPLICATIONS DENIED
1
$115,680
4
$85,550
11
$119,038
2
$21,660
1
$53,250
APPLICATIONS WITHDRAWN
1
$50,710
2
$113,260
9
$106,280
1
$20,380
0
$0
FILES CLOSED FOR INCOMPLETENESS
0
$0
0
$0
3
$141,583
0
$0
0
$0
Aggregated Statistics For Year 2001 (Based on 2 partial tracts)
A) FHA, FSA/RHS & VA Home Purchase Loans
B) Conventional Home Purchase Loans
C) Refinancings
D) Home Improvement Loans
F) Non-occupant Loans on < 5 Family Dwellings (A B C & D)
Number
Average Value
Number
Average Value
Number
Average Value
Number
Average Value
Number
Average Value
LOANS ORIGINATED
3
$113,810
26
$124,421
48
$111,082
4
$24,842
4
$87,015
APPLICATIONS APPROVED, NOT ACCEPTED
0
$0
3
$126,297
4
$85,678
1
$8,410
0
$0
APPLICATIONS DENIED
1
$68,290
2
$65,485
10
$101,028
2
$19,235
1
$37,460
APPLICATIONS WITHDRAWN
0
$0
2
$55,290
11
$112,969
1
$16,560
1
$83,320
FILES CLOSED FOR INCOMPLETENESS
0
$0
1
$58,860
1
$100,390
0
$0
0
$0
Aggregated Statistics For Year 2000 (Based on 2 partial tracts)
A) FHA, FSA/RHS & VA Home Purchase Loans
B) Conventional Home Purchase Loans
C) Refinancings
D) Home Improvement Loans
F) Non-occupant Loans on < 5 Family Dwellings (A B C & D)
Number
Average Value
Number
Average Value
Number
Average Value
Number
Average Value
Number
Average Value
LOANS ORIGINATED
2
$109,565
19
$106,117
14
$93,202
3
$10,700
2
$64,080
APPLICATIONS APPROVED, NOT ACCEPTED
0
$0
1
$51,470
1
$38,220
0
$0
0
$0
APPLICATIONS DENIED
1
$51,210
4
$66,695
8
$72,459
2
$25,605
1
$35,670
APPLICATIONS WITHDRAWN
0
$0
3
$75,507
5
$61,814
0
$0
0
$0
FILES CLOSED FOR INCOMPLETENESS
0
$0
1
$83,320
2
$69,435
0
$0
0
$0
Aggregated Statistics For Year 1999 (Based on 1 partial tract)
A) FHA, FSA/RHS & VA Home Purchase Loans
B) Conventional Home Purchase Loans
C) Refinancings
D) Home Improvement Loans
F) Non-occupant Loans on < 5 Family Dwellings (A B C & D)
Detailed PMIC statistics for the following Tracts:8226.00
2002 - 2018 National Fire Incident Reporting System (NFIRS) incidents
According to the data from the years 2002 - 2018 the average number of fire incidents per year is 8. The highest number of reported fire incidents - 16 took place in 2009, and the least - 0 in 2011. The data has a constant trend.
When looking into fire subcategories, the most incidents belonged to: Structure Fires (50.8%), and Outside Fires (36.2%).
Fire incident types reported to NFIRS in Zip Code 01012


 Nearest zip codes: 01084, 01098, 01050, 01032, 01096, 01026.


 According to the data from the years 2002 - 2018 the average number of fire incidents per year is 8. The highest number of reported fire incidents - 16 took place in 2009, and the least - 0 in 2011. The data has a constant trend.
 When looking into fire subcategories, the most incidents belonged to: Structure Fires (50.8%), and Outside Fires (36.2%).