Estimated zip code population in 2022: 1,884 Zip code population in 2010: 1,685 Zip code population in 2000: 1,452
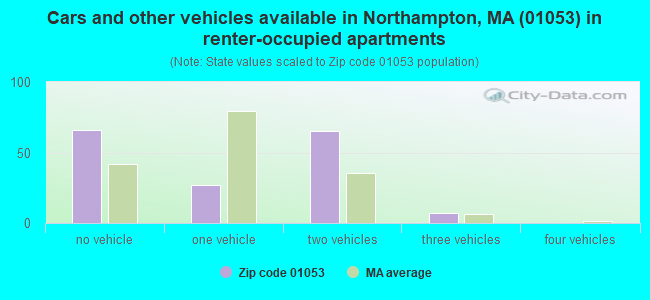
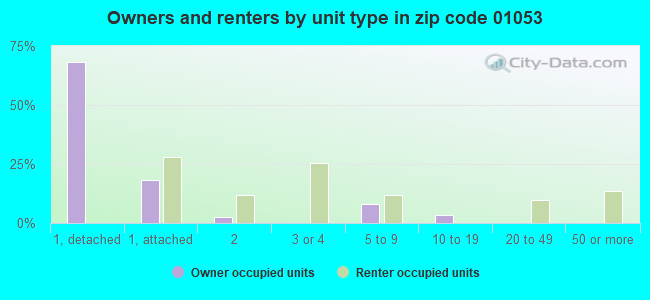
Houses and condos: 787 Renter-occupied apartments: 166
% of renters here:
22%
State:
38%
March 2022 cost of living index in zip code 01053: 109.1 (more than average, U.S. average is 100)
Land area: 5.1 sq. mi. Water area: 0.1 sq. mi.
Population density: 367 people per square mile
(very low).
OSM Map
Google Map
MSN Map
OSM Map
General Map
Google Map
MSN Map
OSM Map
Google Map
MSN Map
OSM Map
Google Map
MSN Map
Please wait while loading the map...
Real estate property taxes paid for housing units in 2022:
This zip code:
1.3% ($4,499)
Massachusetts:
1.0% ($5,536)
Median real estate property taxes paid for housing units with mortgages in 2022: $4,589 (1.2%) Median real estate property taxes paid for housing units with no mortgage in 2022: $4,333 (1.5%)
Averages for the 2020 tax year for zip code 01053, filed in 2021:
Average Adjusted Gross Income (AGI) in 2020: $91,667 (Individual Income Tax Returns)
Here:
$91,667
State:
$105,130
Salary/wage: $62,126 (reported on 69.9% of returns)
Here:
$62,126
State:
$82,951
(% of AGI for various income ranges: 1012.1% for AGIs below $25k, 2806.9% for AGIs $25k-50k, 5725.6% for AGIs $50k-75k, 11922.5% for AGIs $75k-100k, 13470.0% for AGIs $100k-200k)
Taxable interest for individuals: $1,364 (reported on 50.5% of returns)
This zip code:
$1,364
Massachusetts:
$2,361
(% of AGI for various income ranges: 35.0% for AGIs below $25k, 30.6% for AGIs $25k-50k, 34.4% for AGIs $50k-75k, 100.0% for AGIs $75k-100k, 198.9% for AGIs $100k-200k)
Ordinary dividends: $10,085 (reported on 36.6% of returns)
Here:
$10,085
State:
$10,365
(% of AGI for various income ranges: 71.4% for AGIs below $25k, 86.2% for AGIs $25k-50k, 235.6% for AGIs $50k-75k, 712.5% for AGIs $75k-100k, 773.3% for AGIs $100k-200k)
Net capital gain/loss in AGI: +$33,976 (reported on 31.2% of returns)
Here:
+$33,976
State:
+$48,178
(% of AGI for various income ranges: 37.9% for AGIs below $25k, 106.9% for AGIs $25k-50k, 196.7% for AGIs $50k-75k, 722.5% for AGIs $75k-100k, 1333.3% for AGIs $100k-200k)
Profit/loss from business: +$31,424 (reported on 22.6% of returns)
Here:
+$31,424
State:
+$20,792
(% of AGI for various income ranges: 148.6% for AGIs below $25k, 268.8% for AGIs $25k-50k, 850.0% for AGIs $50k-75k, 1697.8% for AGIs $100k-200k)
Taxable individual retirement arrangement distribution: $19,727 (reported on 16.1% of returns)
01053:
$19,727
Massachusetts:
$22,790
(% of AGI for various income ranges: 163.6% for AGIs below $25k, 215.6% for AGIs $25k-50k, 240.0% for AGIs $50k-75k, 1320.0% for AGIs $75k-100k, 1823.3% for AGIs $100k-200k)
Self-employed (Keogh) retirement plans: $32,550 (reported on 2.2% of returns)
01053:
$32,550
Massachusetts:
$26,868
(% of AGI for various income ranges: 723.3% for AGIs $50k-75k)
Total itemized deductions: $41,217 (reported on 12.9% of returns)
Here:
$41,217
State:
$36,722
(% of AGI for various income ranges: 520.0% for AGIs below $25k, 1248.9% for AGIs $50k-75k, 1280.0% for AGIs $100k-200k)
Charity contributions: $17,111 (reported on 9.7% of returns)
Here:
$17,111
State:
$12,529
(% of AGI for various income ranges: 112.2% for AGIs $50k-75k, 235.6% for AGIs $100k-200k)
Taxes paid: $7,383 (reported on 12.9% of returns)
01053:
$7,383
State:
$8,782
(% of AGI for various income ranges: 392.2% for AGIs $50k-75k, 258.9% for AGIs $100k-200k)
Earned income credit: $1,517 (reported on 6.5% of returns)
Here:
$1,517
State:
$1,909
(% of AGI for various income ranges: 28.6% for AGIs below $25k, 31.9% for AGIs $25k-50k)
Percentage of individuals using paid preparers for their 2020 taxes: 94.6%
Here:
95%
State:
92%
(% for various income ranges: 92.0% for AGIs below $25k, 95.2% for AGIs $25k-50k, 93.3% for AGIs $50k-75k, 100.0% for AGIs $75k-100k, 93.8% for AGIs $100k-200k, 100.0% for AGIs over 200k)
Averages for the 2012 tax year for zip code 01053, filed in 2013:
Average Adjusted Gross Income (AGI) in 2012: $60,000 (Individual Income Tax Returns)
Here:
$60,000
State:
$81,425
Salary/wage: $48,342 (reported on 78.9% of returns)
Here:
$48,342
State:
$64,752
(% of AGI for various income ranges: 63.1% for AGIs below $25k, 75.8% for AGIs $25k-50k, 68.5% for AGIs $50k-75k, 68.4% for AGIs $75k-100k, 62.8% for AGIs $100k-200k, 50.6% for AGIs over 200k)
Taxable interest for individuals: $1,034 (reported on 55.6% of returns)
This zip code:
$1,034
Massachusetts:
$2,136
(% of AGI for various income ranges: 1.5% for AGIs below $25k, 1.3% for AGIs $25k-50k, 1.7% for AGIs $50k-75k, 0.5% for AGIs $75k-100k, 0.5% for AGIs $100k-200k, 0.9% for AGIs over 200k)
Ordinary dividends: $5,417 (reported on 32.2% of returns)
Here:
$5,417
State:
$9,473
(% of AGI for various income ranges: 2.6% for AGIs below $25k, 1.5% for AGIs $25k-50k, 2.1% for AGIs $50k-75k, 2.1% for AGIs $75k-100k, 4.6% for AGIs $100k-200k, 2.8% for AGIs over 200k)
Net capital gain/loss in AGI: +$7,885 (reported on 22.2% of returns)
Here:
+$7,885
State:
+$31,437
(% of AGI for various income ranges: 0.7% for AGIs below $25k, 0.5% for AGIs $25k-50k, 0.1% for AGIs $50k-75k, 1.0% for AGIs $75k-100k, 3.2% for AGIs $100k-200k, 8.0% for AGIs over 200k)
Profit/loss from business: +$10,915 (reported on 22.2% of returns)
Here:
+$10,915
State:
+$20,662
(% of AGI for various income ranges: 6.4% for AGIs below $25k, 4.5% for AGIs $25k-50k, 5.5% for AGIs $50k-75k, 8.0% for AGIs $100k-200k)
Taxable individual retirement arrangement distribution: $15,946 (reported on 14.4% of returns)
01053:
$15,946
Massachusetts:
$18,892
(% of AGI for various income ranges: 6.8% for AGIs below $25k, 1.9% for AGIs $25k-50k, 8.3% for AGIs $50k-75k, 6.6% for AGIs $100k-200k)
Total itemized deductions: $22,017 (21% of AGI, reported on 40.0% of returns)
Here:
$22,017
State:
$28,907
Here:
21.3% of AGI
State:
18.2% of AGI
(% of AGI for various income ranges: 12.4% for AGIs below $25k, 12.0% for AGIs $25k-50k, 13.3% for AGIs $50k-75k, 15.4% for AGIs $75k-100k, 15.3% for AGIs $100k-200k, 16.9% for AGIs over 200k)
Charity contributions: $3,497 (reported on 32.2% of returns)
Here:
$3,497
State:
$4,208
(% of AGI for various income ranges: 0.5% for AGIs below $25k, 0.7% for AGIs $25k-50k, 1.2% for AGIs $50k-75k, 1.9% for AGIs $75k-100k, 1.7% for AGIs $100k-200k, 3.7% for AGIs over 200k)
Taxes paid: $10,208 (reported on 40.0% of returns)
01053:
$10,208
State:
$13,303
(% of AGI for various income ranges: 4.3% for AGIs below $25k, 3.9% for AGIs $25k-50k, 5.8% for AGIs $50k-75k, 6.1% for AGIs $75k-100k, 8.2% for AGIs $100k-200k, 8.9% for AGIs over 200k)
Earned income credit: $1,333 (reported on 10.0% of returns)
Here:
$1,333
State:
$1,971
(% of AGI for various income ranges: 2.1% for AGIs below $25k, 0.5% for AGIs $25k-50k)
Percentage of individuals using paid preparers for their 2012 taxes: 62.2%
Here:
62%
State:
56%
(% for various income ranges: 54.5% for AGIs below $25k, 55.0% for AGIs $25k-50k, 71.4% for AGIs $50k-75k, 66.7% for AGIs $75k-100k, 72.7% for AGIs $100k-200k, 100.0% for AGIs over 200k)
Averages for the 2004 tax year for zip code 01053, filed in 2005:
Average Adjusted Gross Income (AGI) in 2004: $64,508 (Individual Income Tax Returns)
Here:
$64,508
State:
$62,877
Salary/wage: $47,967 (reported on 82.3% of returns)
Here:
$47,967
State:
$52,969
(% of AGI for various income ranges: 134.7% for AGIs below $10k, 67.6% for AGIs $10k-25k, 73.6% for AGIs $25k-50k, 77.3% for AGIs $50k-75k, 72.0% for AGIs $75k-100k, 47.2% for AGIs over 100k)
Taxable interest for individuals: $2,130 (reported on 65.5% of returns)
This zip code:
$2,130
Massachusetts:
$1,945
(% of AGI for various income ranges: 8.7% for AGIs below $10k, 3.2% for AGIs $10k-25k, 2.5% for AGIs $25k-50k, 0.7% for AGIs $50k-75k, 0.8% for AGIs $75k-100k, 2.8% for AGIs over 100k)
Taxable dividends: $3,479 (reported on 39.5% of returns)
Here:
$3,479
State:
$5,323
(% of AGI for various income ranges: 7.3% for AGIs below $10k, 1.6% for AGIs $10k-25k, 2.0% for AGIs $25k-50k, 1.4% for AGIs $50k-75k, 1.5% for AGIs $75k-100k, 2.6% for AGIs over 100k)
Net capital gain/loss: +$9,305 (reported on 26.3% of returns)
Here:
+$9,305
State:
+$20,377
(% of AGI for various income ranges: -16.0% for AGIs below $10k, -0.4% for AGIs $10k-25k, 0.6% for AGIs $25k-50k, 0.4% for AGIs $50k-75k, 0.8% for AGIs $75k-100k, 7.5% for AGIs over 100k)
Profit/loss from business: +$13,379 (reported on 23.5% of returns)
Here:
+$13,379
State:
+$17,837
(% of AGI for various income ranges: 12.7% for AGIs $10k-25k, 4.3% for AGIs $25k-50k, 4.7% for AGIs $50k-75k, 7.7% for AGIs $75k-100k, 3.3% for AGIs over 100k)
IRA payment deduction: $2,784 (reported on 6.6% of returns)
01053:
$2,784
Massachusetts:
$3,100
Self-employed pension: $13,100 (reported on 2.6% of returns)
Here:
$13,100
Massachusetts:
$14,516
Total itemized deductions: $17,891 (17% of AGI, reported on 45.0% of returns)
Here:
$17,891
State:
$22,573
Here:
16.6% of AGI
State:
19.5% of AGI
(% of AGI for various income ranges: 13.3% for AGIs $10k-25k, 14.1% for AGIs $25k-50k, 15.0% for AGIs $50k-75k, 15.6% for AGIs $75k-100k, 10.1% for AGIs over 100k)
Charity contributions deductions: $2,637 (2% of AGI, reported on 42.0% of returns)
Here:
$2,637
State:
$3,295
Here:
2.4% of AGI
State:
2.7% of AGI
(% of AGI for various income ranges: 1.0% for AGIs $10k-25k, 1.9% for AGIs $25k-50k, 1.7% for AGIs $50k-75k, 1.6% for AGIs $75k-100k, 1.8% for AGIs over 100k)
Total tax: $10,778 (reported on 85.3% of returns)
01053:
$10,778
State:
$11,494
(% of AGI for various income ranges: 4.0% for AGIs below $10k, 6.1% for AGIs $10k-25k, 8.5% for AGIs $25k-50k, 9.1% for AGIs $50k-75k, 11.3% for AGIs $75k-100k, 19.8% for AGIs over 100k)
Earned income credit: $1,362 (reported on 6.1% of returns)
Here:
$1,362
State:
$1,518
Percentage of individuals using paid preparers for their 2004 taxes: 60.4%
Here:
60%
State:
58%
(% for various income ranges: 42.9% for AGIs below $10k, 57.3% for AGIs $10k-25k, 55.3% for AGIs $25k-50k, 64.8% for AGIs $50k-75k, 66.3% for AGIs $75k-100k, 81.2% for AGIs over 100k)
Household received Food Stamps/SNAP in the past 12 months: 12 Household did not receive Food Stamps/SNAP in the past 12 months: 725
Women who had a birth in the past 12 months: 12 (13 now married, 0 unmarried) Women who did not have a birth in the past 12 months: 302 (19 now married, 289 unmarried)
Housing units in zip code 01053 with a mortgage: 355 (99 second mortgage, 91 both second mortgage and home equity loan) Median monthly owner costs for units with a mortgage: $2,221 Median monthly owner costs for units without a mortgage: $904
Residents with income below the poverty level in 2022:
This zip code:
12.0%
Whole state:
10.4%
Residents with income below 50% of the poverty level in 2022:
This zip code:
2.4%
Whole state:
5.1%
Median number of rooms in houses and condos:
Here:
6.0
State:
6.5
Median number of rooms in apartments:
Here:
3.5
State:
4.0
Notable locations in this zip code not listed on our city pages
Notable locations in zip code 01053: Northampton Country Club (A), Hampshire County Sanatorium (B), Department of Veterans Affairs Medical Center Library (C). Display/hide their locations on the map
Streams, rivers, and creeks: Marble Brook (A), Roberts Meadow Brook (B), Day Brook (C), Clark Brook (D), Beaver Brook (E). Display/hide their locations on the map
In group quarters: 493 (-1 institutionalized population)
Size of family households: 265 2-persons, 139 3-persons, 22 4-persons, 13 5-persons, 9 6-persons
Size of nonfamily households: 289 1-person, 13 2-persons, 6 3-persons
87 married couples with children.
59 single-parent households (20 men, 39 women).
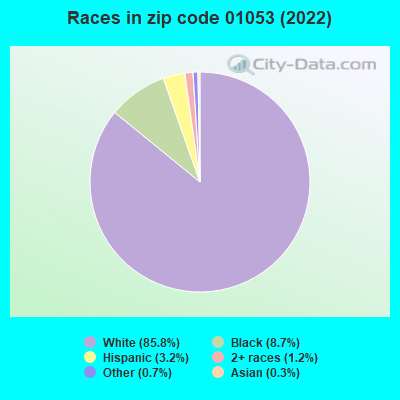
92.2% of residents of 01053 zip code speak English at home.
1.6% of residents speak Spanish at home (93% very well, 7% well).
6.3% of residents speak other Indo-European language at home (98% very well, 2% not well).
0.5% of residents speak other language at home (100% very well).
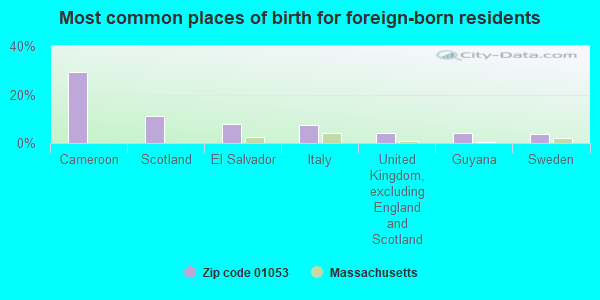
Foreign born population: 164 (8.7%) (98.1% of them are naturalized citizens)
This zip code:
8.7%
Whole state:
18.0%
29%Cameroon
11%Scotland
8%El Salvador
7%Italy
4%United Kingdom, excluding England and Scotland
4%Guyana
4%Sweden
10%Irish
9%English
6%American
6%Icelander
5%French Canadian
5%Polish
4%French
Year of entry for the foreign-born population
92010 or later
472000 to 2009
161990 to 1999
88Before 1990
Facilities with environmental interests located in this zip code:
LEEDS ELEMENTARY SCHOOL (FLORENCE STREET in LEEDS, MA)
AIR MINOR (AIRS/AFS) STATE MASTER (MA-EPICS) - NEI-0420021, AIR PROGRAM, NEI-0420546, CRITERIA AND HAZARDOUS AIR POLLUTANT INVENTORY (Inventory of air pollution sources) Business SIC classification: ELEMENTARY AND SECONDARY SCHOOLS Organizations: LEEDS SCHOOL (CONTACT/OWNER)
Alternative names: LEEDS SCHOOL, NORTHAMPTON SCH SYS
BERKSHIRE ELECTRIC CABLE COMPANY (118 RIVER ROAD in LEEDS, MA)
AIR MINOR (AIRS/AFS) CRITERIA AND HAZARDOUS AIR POLLUTANT INVENTORY (Inventory of air pollution sources) National Pollutant Discharge Elimination System NON-MAJOR (Tracking pollutant discharge elimination systems) - permit TRI REPORTER (Tracking of toxic chemicals releasing facilities) Business SIC classification: DRAWING AND INSULATING OF NONFERROUS WIRE
LEEDS (20 FLORENCE STREET in LEEDS, MA)
(National Center for Education Statistics) - STATE ID-210025 Organizations: NORTHAMPTON (SCHOOL DISTRICT)
DUCHARME CO INC (95 SPRING ST in NORTHAMPTON, MA)
(Resource Conservation and Recovery Act (tracking hazardous waste))
Housing units lacking complete plumbing facilities: 3.3% Housing units lacking complete kitchen facilities: 6.8%
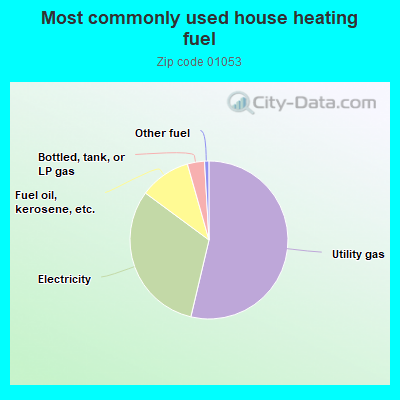
53.8%Utility gas
31.5%Electricity
10.5%Fuel oil, kerosene, etc.
3.5%Bottled, tank, or LP gas
0.9%Other fuel
Population in 1990: 1,350. Population change in the 1990s: +102 (+7.6%).
Place of birth for U.S.-born residents:
This state: 1,195
Northeast: 227
Midwest: 73
South: 139
West: 80
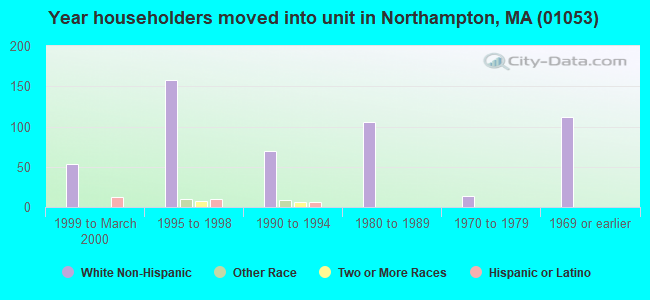
55% of the 01053 zip code residents lived in the same house 5 years ago. Out of people who lived in different houses, 74% lived in this county. Out of people who lived in different counties, 50% lived in Massachusetts.
85% of the 01053 zip code residents lived in the same house 1 year ago. Out of people who lived in different houses, 38% moved from this county. Out of people who lived in different houses, 33% moved from different county within same state. Out of people who lived in different houses, 8% moved from different state. Out of people who lived in different houses, 22% moved from abroad.
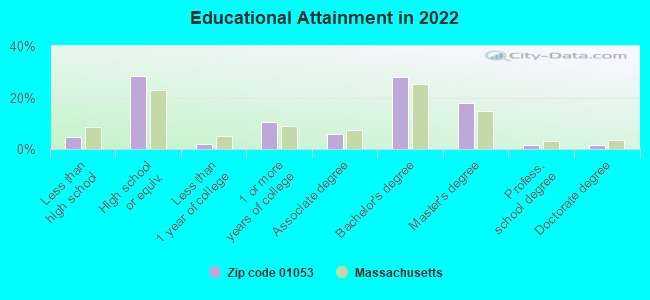
Private vs. public school enrollment:
Students in private schools in grades 1 to 8 (elementary and middle school):
Here:
0.0%
Massachusetts:
10.3%
Students in private schools in grades 9 to 12 (high school): 14
Here:
21.7%
Massachusetts:
12.3%
Students in private undergraduate colleges:
Here:
0.0%
Massachusetts:
51.2%
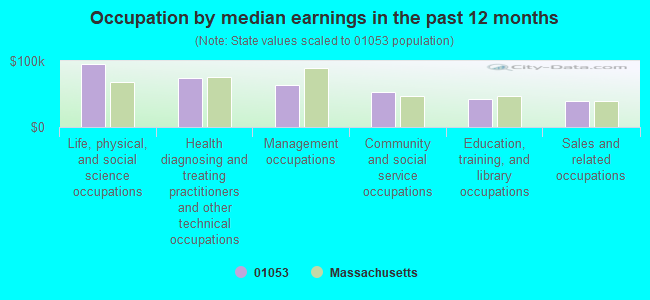
Occupation by median earnings in the past 12 months ($)
95,071Life, physical, and social science occupations
74,799Health diagnosing and treating practitioners and other technical occupations
63,825Management occupations
53,593Community and social service occupations
42,253Education, training, and library occupations
39,061Sales and related occupations
Top industries in this zip code by the number of employees in 2005:
Health Care and Social Assistance: Psychiatric and Substance Abuse Hospitals (500-999 employees: 1 establishment)
Health Care and Social Assistance: Nursing Care Facilities (100-249: 1)
Health Care and Social Assistance: Homes for the Elderly (20-49: 1)
Other Services (except Public Administration): Religious Organizations (10-19: 1, 1-4: 1)
Accommodation and Food Services: Full-Service Restaurants (10-19: 1, 1-4: 1)
Health Care and Social Assistance: Child Day Care Services (10-19: 1)
Other Services (except Public Administration): Civic and Social Organizations (10-19: 1)
People in group quarters in 2010:
223 people in nursing facilities/skilled-nursing facilities
152 people in residential treatment centers for adults
5 people in workers' group living quarters and job corps centers
People in group quarters in 2000:
100 people in nursing homes
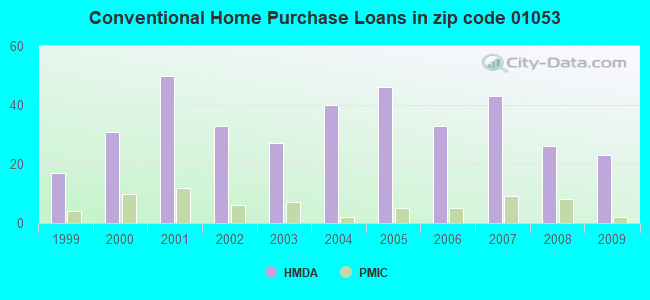
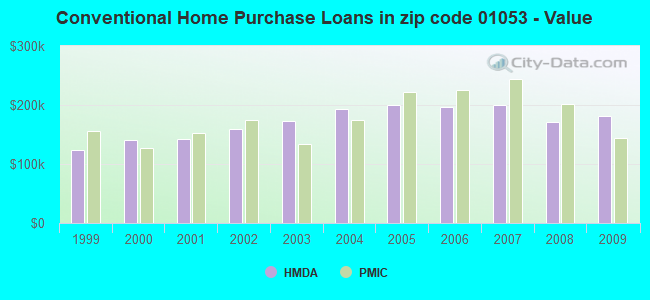
Home Mortgage Disclosure Act Aggregated Statistics For Year 2009 (Based on 2 partial tracts)
A) FHA, FSA/RHS & VA Home Purchase Loans
B) Conventional Home Purchase Loans
C) Refinancings
D) Home Improvement Loans
F) Non-occupant Loans on < 5 Family Dwellings (A B C & D)
Number
Average Value
Number
Average Value
Number
Average Value
Number
Average Value
Number
Average Value
LOANS ORIGINATED
5
$235,640
23
$181,294
76
$201,243
11
$95,407
4
$295,310
APPLICATIONS APPROVED, NOT ACCEPTED
0
$0
2
$136,325
4
$165,648
1
$26,660
2
$124,140
APPLICATIONS DENIED
0
$0
2
$108,145
13
$225,609
2
$79,205
1
$152,320
APPLICATIONS WITHDRAWN
0
$0
2
$267,700
9
$265,629
0
$0
0
$0
FILES CLOSED FOR INCOMPLETENESS
0
$0
1
$138,610
5
$140,134
1
$176,690
0
$0
Aggregated Statistics For Year 2008 (Based on 2 partial tracts)
A) FHA, FSA/RHS & VA Home Purchase Loans
B) Conventional Home Purchase Loans
C) Refinancings
D) Home Improvement Loans
E) Loans on Dwellings For 5+ Families
F) Non-occupant Loans on < 5 Family Dwellings (A B C & D)
G) Loans On Manufactured Home Dwelling (A B C & D)
Number
Average Value
Number
Average Value
Number
Average Value
Number
Average Value
Number
Average Value
Number
Average Value
Number
Average Value
LOANS ORIGINATED
4
$212,868
26
$171,594
26
$158,091
11
$128,849
1
$190,400
2
$192,305
1
$38,080
APPLICATIONS APPROVED, NOT ACCEPTED
0
$0
3
$235,080
5
$233,506
3
$56,867
0
$0
1
$76,160
0
$0
APPLICATIONS DENIED
0
$0
0
$0
7
$235,009
4
$70,068
0
$0
0
$0
1
$323,680
APPLICATIONS WITHDRAWN
0
$0
3
$204,870
4
$183,545
1
$190,400
0
$0
1
$66,260
0
$0
FILES CLOSED FOR INCOMPLETENESS
0
$0
0
$0
1
$121,860
0
$0
0
$0
0
$0
0
$0
Aggregated Statistics For Year 2007 (Based on 2 partial tracts)
B) Conventional Home Purchase Loans
C) Refinancings
D) Home Improvement Loans
F) Non-occupant Loans on < 5 Family Dwellings (A B C & D)
G) Loans On Manufactured Home Dwelling (A B C & D)
Number
Average Value
Number
Average Value
Number
Average Value
Number
Average Value
Number
Average Value
LOANS ORIGINATED
43
$200,567
23
$143,677
17
$82,298
6
$138,992
0
$0
APPLICATIONS APPROVED, NOT ACCEPTED
3
$239,903
2
$113,480
4
$37,700
0
$0
0
$0
APPLICATIONS DENIED
1
$91,390
11
$229,242
8
$61,404
1
$76,160
2
$23,230
APPLICATIONS WITHDRAWN
5
$219,036
10
$183,317
0
$0
1
$471,430
0
$0
FILES CLOSED FOR INCOMPLETENESS
1
$185,830
1
$91,390
0
$0
0
$0
0
$0
Aggregated Statistics For Year 2006 (Based on 2 partial tracts)
B) Conventional Home Purchase Loans
C) Refinancings
D) Home Improvement Loans
E) Loans on Dwellings For 5+ Families
F) Non-occupant Loans on < 5 Family Dwellings (A B C & D)
G) Loans On Manufactured Home Dwelling (A B C & D)
Number
Average Value
Number
Average Value
Number
Average Value
Number
Average Value
Number
Average Value
Number
Average Value
LOANS ORIGINATED
33
$197,139
39
$178,917
17
$76,787
1
$319,870
7
$257,964
1
$19,800
APPLICATIONS APPROVED, NOT ACCEPTED
1
$34,270
4
$150,035
1
$7,620
0
$0
1
$31,990
0
$0
APPLICATIONS DENIED
3
$262,753
11
$185,623
3
$18,787
0
$0
3
$195,223
0
$0
APPLICATIONS WITHDRAWN
2
$104,340
16
$138,849
2
$97,865
0
$0
0
$0
0
$0
FILES CLOSED FOR INCOMPLETENESS
1
$154,600
3
$234,573
0
$0
0
$0
0
$0
0
$0
Aggregated Statistics For Year 2005 (Based on 2 partial tracts)
A) FHA, FSA/RHS & VA Home Purchase Loans
B) Conventional Home Purchase Loans
C) Refinancings
D) Home Improvement Loans
F) Non-occupant Loans on < 5 Family Dwellings (A B C & D)
Number
Average Value
Number
Average Value
Number
Average Value
Number
Average Value
Number
Average Value
LOANS ORIGINATED
1
$194,210
46
$199,208
33
$193,908
18
$106,624
6
$150,035
APPLICATIONS APPROVED, NOT ACCEPTED
0
$0
2
$127,950
3
$134,040
1
$2,280
1
$2,280
APPLICATIONS DENIED
0
$0
3
$148,513
10
$184,155
3
$109,163
0
$0
APPLICATIONS WITHDRAWN
0
$0
3
$201,317
7
$237,946
0
$0
0
$0
FILES CLOSED FOR INCOMPLETENESS
0
$0
0
$0
3
$202,587
1
$22,850
1
$322,920
Aggregated Statistics For Year 2004 (Based on 2 partial tracts)
A) FHA, FSA/RHS & VA Home Purchase Loans
B) Conventional Home Purchase Loans
C) Refinancings
D) Home Improvement Loans
F) Non-occupant Loans on < 5 Family Dwellings (A B C & D)
G) Loans On Manufactured Home Dwelling (A B C & D)
Number
Average Value
Number
Average Value
Number
Average Value
Number
Average Value
Number
Average Value
Number
Average Value
LOANS ORIGINATED
1
$117,290
40
$193,275
60
$147,217
14
$122,128
8
$168,124
2
$44,175
APPLICATIONS APPROVED, NOT ACCEPTED
0
$0
5
$224,216
5
$151,558
0
$0
0
$0
0
$0
APPLICATIONS DENIED
0
$0
4
$61,880
8
$148,892
2
$10,280
1
$7,620
1
$60,930
APPLICATIONS WITHDRAWN
0
$0
7
$176,800
16
$144,656
0
$0
0
$0
0
$0
FILES CLOSED FOR INCOMPLETENESS
0
$0
1
$171,360
4
$178,975
0
$0
0
$0
0
$0
Aggregated Statistics For Year 2003 (Based on 2 partial tracts)
A) FHA, FSA/RHS & VA Home Purchase Loans
B) Conventional Home Purchase Loans
C) Refinancings
D) Home Improvement Loans
F) Non-occupant Loans on < 5 Family Dwellings (A B C & D)
Number
Average Value
Number
Average Value
Number
Average Value
Number
Average Value
Number
Average Value
LOANS ORIGINATED
1
$130,230
27
$173,081
178
$138,389
4
$44,172
5
$148,512
APPLICATIONS APPROVED, NOT ACCEPTED
0
$0
5
$115,002
13
$158,295
3
$26,657
1
$114,240
APPLICATIONS DENIED
0
$0
1
$712,860
14
$142,637
1
$53,310
1
$111,960
APPLICATIONS WITHDRAWN
0
$0
1
$731,140
14
$113,968
1
$26,660
1
$44,170
FILES CLOSED FOR INCOMPLETENESS
0
$0
0
$0
2
$77,300
0
$0
0
$0
Aggregated Statistics For Year 2002 (Based on 2 partial tracts)
A) FHA, FSA/RHS & VA Home Purchase Loans
B) Conventional Home Purchase Loans
C) Refinancings
D) Home Improvement Loans
E) Loans on Dwellings For 5+ Families
F) Non-occupant Loans on < 5 Family Dwellings (A B C & D)
Number
Average Value
Number
Average Value
Number
Average Value
Number
Average Value
Number
Average Value
Number
Average Value
LOANS ORIGINATED
2
$113,860
33
$159,752
130
$130,685
3
$19,800
1
$266,560
8
$122,999
APPLICATIONS APPROVED, NOT ACCEPTED
1
$74,640
4
$253,992
5
$93,982
1
$7,620
0
$0
1
$137,090
APPLICATIONS DENIED
0
$0
1
$99,010
5
$95,504
1
$19,040
0
$0
0
$0
APPLICATIONS WITHDRAWN
0
$0
4
$135,375
11
$110,432
1
$19,040
0
$0
2
$129,090
FILES CLOSED FOR INCOMPLETENESS
0
$0
1
$309,970
2
$134,420
2
$15,230
0
$0
0
$0
Aggregated Statistics For Year 2001 (Based on 2 partial tracts)
A) FHA, FSA/RHS & VA Home Purchase Loans
B) Conventional Home Purchase Loans
C) Refinancings
D) Home Improvement Loans
E) Loans on Dwellings For 5+ Families
F) Non-occupant Loans on < 5 Family Dwellings (A B C & D)
Number
Average Value
Number
Average Value
Number
Average Value
Number
Average Value
Number
Average Value
Number
Average Value
LOANS ORIGINATED
3
$118,047
50
$142,891
72
$115,848
2
$22,850
0
$0
8
$108,719
APPLICATIONS APPROVED, NOT ACCEPTED
1
$101,290
5
$107,538
2
$125,665
0
$0
1
$304,640
1
$91,390
APPLICATIONS DENIED
0
$0
2
$132,140
4
$100,722
2
$30,845
0
$0
2
$43,790
APPLICATIONS WITHDRAWN
0
$0
2
$105,860
5
$79,054
1
$38,080
0
$0
1
$42,650
FILES CLOSED FOR INCOMPLETENESS
0
$0
1
$190,400
5
$123,074
1
$15,230
0
$0
2
$116,525
Aggregated Statistics For Year 2000 (Based on 2 partial tracts)
A) FHA, FSA/RHS & VA Home Purchase Loans
B) Conventional Home Purchase Loans
C) Refinancings
D) Home Improvement Loans
F) Non-occupant Loans on < 5 Family Dwellings (A B C & D)
Number
Average Value
Number
Average Value
Number
Average Value
Number
Average Value
Number
Average Value
LOANS ORIGINATED
5
$121,246
31
$141,314
16
$93,582
2
$59,025
1
$45,700
APPLICATIONS APPROVED, NOT ACCEPTED
0
$0
2
$198,015
5
$35,642
2
$13,330
0
$0
APPLICATIONS DENIED
0
$0
5
$91,240
4
$58,072
0
$0
1
$96,720
APPLICATIONS WITHDRAWN
0
$0
2
$76,160
3
$77,683
0
$0
0
$0
FILES CLOSED FOR INCOMPLETENESS
0
$0
0
$0
2
$73,495
0
$0
0
$0
Aggregated Statistics For Year 1999 (Based on 1 partial tract)
A) FHA, FSA/RHS & VA Home Purchase Loans
B) Conventional Home Purchase Loans
C) Refinancings
D) Home Improvement Loans
E) Loans on Dwellings For 5+ Families
F) Non-occupant Loans on < 5 Family Dwellings (A B C & D)


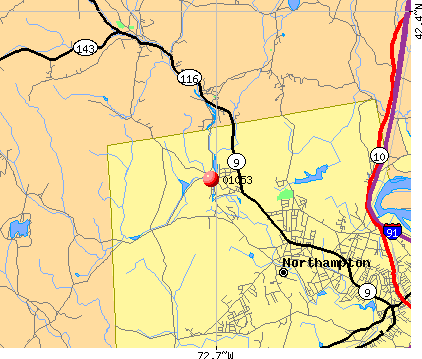 Nearest zip codes: 01062, 01039, 01096, 01027, 01088, 01066.