Estimated zip code population in 2022: 6,019 Zip code population in 2010: 5,911 Zip code population in 2000: 5,745
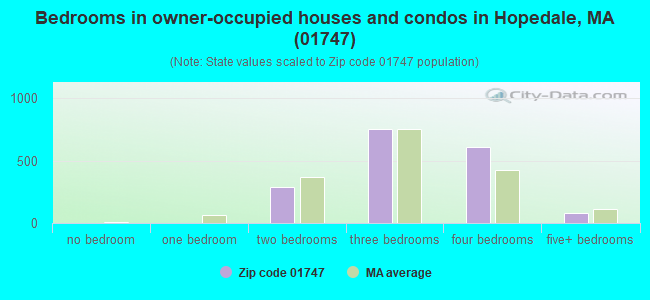
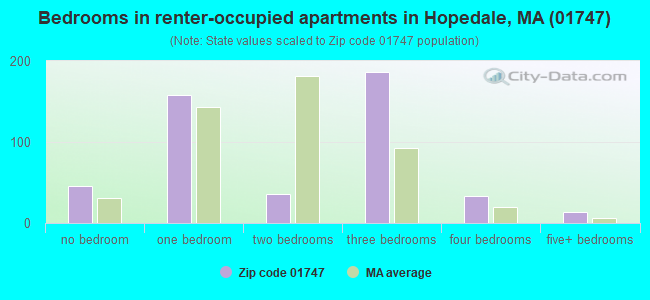
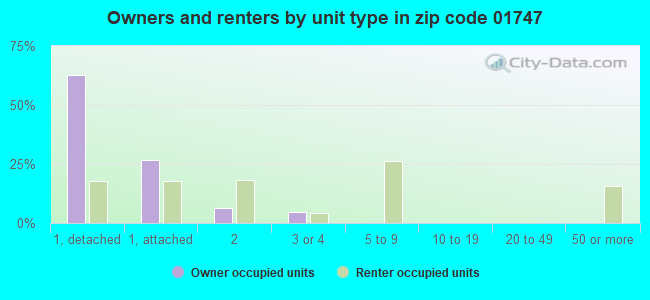
Houses and condos: 2,328 Renter-occupied apartments: 469
% of renters here:
21%
State:
38%
March 2022 cost of living index in zip code 01747: 125.6 (high, U.S. average is 100)
Land area: 5.2 sq. mi. Water area: 0.2 sq. mi.
Population density: 1,164 people per square mile
(low).
OSM Map
Google Map
MSN Map
OSM Map
General Map
Google Map
MSN Map
OSM Map
Google Map
MSN Map
OSM Map
Google Map
MSN Map
Please wait while loading the map...
Real estate property taxes paid for housing units in 2022:
This zip code:
1.3% ($5,651)
Massachusetts:
1.0% ($5,536)
Median real estate property taxes paid for housing units with mortgages in 2022: $5,528 (1.1%) Median real estate property taxes paid for housing units with no mortgage in 2022: $5,860 (1.4%)
Business Search- 14 Million verified businesses
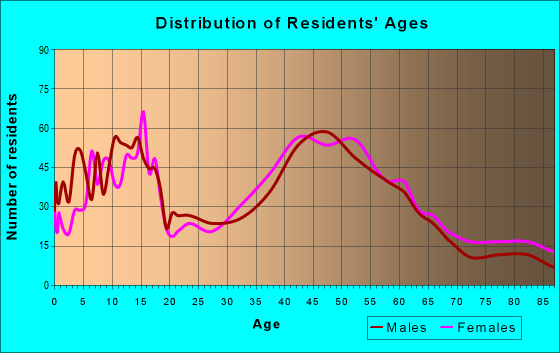
Males: 2,701
(44.9%)
Females: 3,317
(55.1%)
For population 25 years and over in 01747:
High school or higher: 95.1%
Bachelor's degree or higher: 46.8%
Graduate or professional degree: 17.2%
Unemployed: 2.9%
Mean travel time to work (commute): 26.0 minutes
For population 15 years and over in 01747:
Never married: 32.8%
Now married: 52.6%
Separated: 1.5%
Widowed: 6.6%
Divorced: 6.5%
Zip code 01747 compared to state average:
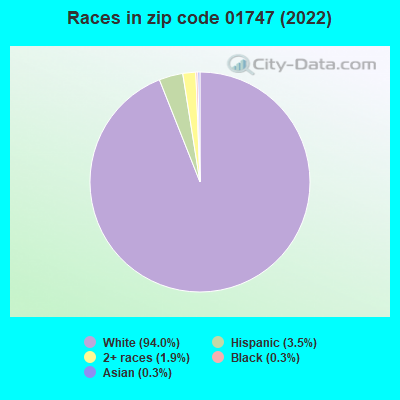
Black race population percentage significantly below state average.
Hispanic race population percentage significantly below state average.
Foreign-born population percentage significantly below state average.
Renting percentage below state average.
Length of stay since moving in significantly above state average.
Estimated median house/condo value in 2022: $447,959
01747:
$447,959
Massachusetts:
$534,700
According to our research of Massachusetts and other state lists, there were 2 registered sex offenders living in 01747 zip code as of May 28, 2024. The ratio of all residents to sex offenders in zip code 01747 is 3,014 to 1. The ratio of registered sex offenders to all residents in this zip code is lower than the state average.
Median resident age:
This zip code:
43.8 years
Massachusetts median age:
40.3 years
Average household size:
This zip code:
2.7 people
Massachusetts:
2.4 people
Averages for the 2020 tax year for zip code 01747, filed in 2021:
Average Adjusted Gross Income (AGI) in 2020: $91,613 (Individual Income Tax Returns)
Here:
$91,613
State:
$105,130
Salary/wage: $83,141 (reported on 83.6% of returns)
Here:
$83,141
State:
$82,951
(% of AGI for various income ranges: 1050.4% for AGIs below $25k, 3502.1% for AGIs $25k-50k, 6865.7% for AGIs $50k-75k, 9760.0% for AGIs $75k-100k, 19669.8% for AGIs $100k-200k, 80025.0% for AGIs over 200k)
Taxable interest for individuals: $1,080 (reported on 41.6% of returns)
This zip code:
$1,080
Massachusetts:
$2,361
(% of AGI for various income ranges: 24.0% for AGIs below $25k, 32.4% for AGIs $25k-50k, 71.3% for AGIs $50k-75k, 88.1% for AGIs $75k-100k, 84.6% for AGIs $100k-200k, 436.0% for AGIs over 200k)
Ordinary dividends: $3,442 (reported on 25.6% of returns)
Here:
$3,442
State:
$10,365
(% of AGI for various income ranges: 26.8% for AGIs below $25k, 57.9% for AGIs $25k-50k, 94.3% for AGIs $50k-75k, 128.1% for AGIs $75k-100k, 169.3% for AGIs $100k-200k, 1188.0% for AGIs over 200k)
Net capital gain/loss in AGI: +$19,710 (reported on 21.5% of returns)
Here:
+$19,710
State:
+$48,178
(% of AGI for various income ranges: 6.8% for AGIs below $25k, 73.7% for AGIs $25k-50k, 98.3% for AGIs $50k-75k, 131.0% for AGIs $75k-100k, 322.0% for AGIs $100k-200k, 11199.0% for AGIs over 200k)
Profit/loss from business: +$15,347 (reported on 14.2% of returns)
Here:
+$15,347
State:
+$20,792
(% of AGI for various income ranges: 112.6% for AGIs below $25k, 177.6% for AGIs $25k-50k, 370.7% for AGIs $50k-75k, 276.7% for AGIs $75k-100k, 472.2% for AGIs $100k-200k, 2039.0% for AGIs over 200k)
Taxable individual retirement arrangement distribution: $15,547 (reported on 10.1% of returns)
01747:
$15,547
Massachusetts:
$22,790
(% of AGI for various income ranges: 83.6% for AGIs below $25k, 142.9% for AGIs $25k-50k, 236.3% for AGIs $50k-75k, 451.4% for AGIs $75k-100k, 405.4% for AGIs $100k-200k, 695.0% for AGIs over 200k)
Total itemized deductions: $25,305 (reported on 13.6% of returns)
Here:
$25,305
State:
$36,722
(% of AGI for various income ranges: 328.2% for AGIs $25k-50k, 462.3% for AGIs $50k-75k, 694.3% for AGIs $75k-100k, 968.0% for AGIs $100k-200k, 2820.0% for AGIs over 200k)
Charity contributions: $4,374 (reported on 9.8% of returns)
Here:
$4,374
State:
$12,529
(% of AGI for various income ranges: 5.2% for AGIs below $25k, 23.0% for AGIs $50k-75k, 48.1% for AGIs $75k-100k, 134.4% for AGIs $100k-200k, 609.0% for AGIs over 200k)
Taxes paid: $8,698 (reported on 13.6% of returns)
01747:
$8,698
State:
$8,782
(% of AGI for various income ranges: 67.6% for AGIs $25k-50k, 155.0% for AGIs $50k-75k, 282.9% for AGIs $75k-100k, 375.1% for AGIs $100k-200k, 886.0% for AGIs over 200k)
Earned income credit: $1,717 (reported on 5.7% of returns)
Here:
$1,717
State:
$1,909
(% of AGI for various income ranges: 35.0% for AGIs below $25k, 35.3% for AGIs $25k-50k)
Percentage of individuals using paid preparers for their 2020 taxes: 93.4%
Here:
93%
State:
92%
(% for various income ranges: 91.6% for AGIs below $25k, 92.5% for AGIs $25k-50k, 93.6% for AGIs $50k-75k, 93.8% for AGIs $75k-100k, 94.4% for AGIs $100k-200k, 96.8% for AGIs over 200k)
Averages for the 2012 tax year for zip code 01747, filed in 2013:
Average Adjusted Gross Income (AGI) in 2012: $76,867 (Individual Income Tax Returns)
Here:
$76,867
State:
$81,425
Salary/wage: $73,135 (reported on 86.9% of returns)
Here:
$73,135
State:
$64,752
(% of AGI for various income ranges: 70.3% for AGIs below $25k, 74.6% for AGIs $25k-50k, 76.0% for AGIs $50k-75k, 82.2% for AGIs $75k-100k, 88.6% for AGIs $100k-200k, 82.2% for AGIs over 200k)
Taxable interest for individuals: $845 (reported on 46.0% of returns)
This zip code:
$845
Massachusetts:
$2,136
(% of AGI for various income ranges: 1.9% for AGIs below $25k, 0.6% for AGIs $25k-50k, 0.8% for AGIs $50k-75k, 0.5% for AGIs $75k-100k, 0.3% for AGIs $100k-200k, 0.4% for AGIs over 200k)
Ordinary dividends: $2,849 (reported on 27.2% of returns)
Here:
$2,849
State:
$9,473
(% of AGI for various income ranges: 1.8% for AGIs below $25k, 1.0% for AGIs $25k-50k, 1.2% for AGIs $50k-75k, 0.9% for AGIs $75k-100k, 0.5% for AGIs $100k-200k, 1.6% for AGIs over 200k)
Net capital gain/loss in AGI: +$6,002 (reported on 20.1% of returns)
Here:
+$6,002
State:
+$31,437
(% of AGI for various income ranges: 0.2% for AGIs $25k-50k, 0.2% for AGIs $50k-75k, 0.5% for AGIs $75k-100k, 1.0% for AGIs $100k-200k, 4.4% for AGIs over 200k)
Profit/loss from business: +$13,588 (reported on 13.4% of returns)
Here:
+$13,588
State:
+$20,662
(% of AGI for various income ranges: 7.0% for AGIs below $25k, 3.9% for AGIs $25k-50k, 3.0% for AGIs $50k-75k, 2.9% for AGIs $75k-100k, 1.4% for AGIs $100k-200k, 2.0% for AGIs over 200k)
Taxable individual retirement arrangement distribution: $12,591 (reported on 11.1% of returns)
01747:
$12,591
Massachusetts:
$18,892
(% of AGI for various income ranges: 4.6% for AGIs below $25k, 2.9% for AGIs $25k-50k, 3.2% for AGIs $50k-75k, 2.5% for AGIs $75k-100k, 1.7% for AGIs $100k-200k, 0.2% for AGIs over 200k)
Total itemized deductions: $23,374 (19% of AGI, reported on 49.7% of returns)
Here:
$23,374
State:
$28,907
Here:
19.1% of AGI
State:
18.2% of AGI
(% of AGI for various income ranges: 16.5% for AGIs below $25k, 13.3% for AGIs $25k-50k, 14.1% for AGIs $50k-75k, 18.1% for AGIs $75k-100k, 16.7% for AGIs $100k-200k, 12.2% for AGIs over 200k)
Charity contributions: $1,960 (reported on 41.6% of returns)
Here:
$1,960
State:
$4,208
(% of AGI for various income ranges: 0.6% for AGIs below $25k, 0.7% for AGIs $25k-50k, 1.1% for AGIs $50k-75k, 1.1% for AGIs $75k-100k, 1.1% for AGIs $100k-200k, 1.2% for AGIs over 200k)
Taxes paid: $10,895 (reported on 49.7% of returns)
01747:
$10,895
State:
$13,303
(% of AGI for various income ranges: 4.3% for AGIs below $25k, 4.3% for AGIs $25k-50k, 5.5% for AGIs $50k-75k, 7.3% for AGIs $75k-100k, 8.2% for AGIs $100k-200k, 7.4% for AGIs over 200k)
Earned income credit: $1,790 (reported on 7.0% of returns)
Here:
$1,790
State:
$1,971
(% of AGI for various income ranges: 3.0% for AGIs below $25k, 0.6% for AGIs $25k-50k)
Percentage of individuals using paid preparers for their 2012 taxes: 52.7%
Here:
53%
State:
56%
(% for various income ranges: 45.8% for AGIs below $25k, 49.2% for AGIs $25k-50k, 55.8% for AGIs $50k-75k, 59.4% for AGIs $75k-100k, 57.1% for AGIs $100k-200k, 61.1% for AGIs over 200k)
Averages for the 2004 tax year for zip code 01747, filed in 2005:
Average Adjusted Gross Income (AGI) in 2004: $66,925 (Individual Income Tax Returns)
Here:
$66,925
State:
$62,877
Salary/wage: $63,949 (reported on 87.3% of returns)
Here:
$63,949
State:
$52,969
(% of AGI for various income ranges: 100.2% for AGIs below $10k, 67.0% for AGIs $10k-25k, 78.5% for AGIs $25k-50k, 85.6% for AGIs $50k-75k, 89.7% for AGIs $75k-100k, 82.9% for AGIs over 100k)
Taxable interest for individuals: $940 (reported on 62.4% of returns)
This zip code:
$940
Massachusetts:
$1,945
(% of AGI for various income ranges: 4.1% for AGIs below $10k, 3.4% for AGIs $10k-25k, 1.6% for AGIs $25k-50k, 1.1% for AGIs $50k-75k, 0.6% for AGIs $75k-100k, 0.5% for AGIs over 100k)
Taxable dividends: $1,699 (reported on 32.8% of returns)
Here:
$1,699
State:
$5,323
(% of AGI for various income ranges: 3.6% for AGIs below $10k, 2.8% for AGIs $10k-25k, 1.0% for AGIs $25k-50k, 0.6% for AGIs $50k-75k, 0.4% for AGIs $75k-100k, 0.8% for AGIs over 100k)
Net capital gain/loss: +$5,834 (reported on 26.2% of returns)
Here:
+$5,834
State:
+$20,377
(% of AGI for various income ranges: -0.9% for AGIs below $10k, 0.1% for AGIs $10k-25k, 0.5% for AGIs $25k-50k, 0.7% for AGIs $50k-75k, 0.0% for AGIs $75k-100k, 3.9% for AGIs over 100k)
Profit/loss from business: +$14,349 (reported on 15.6% of returns)
Here:
+$14,349
State:
+$17,837
(% of AGI for various income ranges: 7.1% for AGIs below $10k, 5.7% for AGIs $10k-25k, 3.4% for AGIs $25k-50k, 2.5% for AGIs $50k-75k, 3.2% for AGIs $75k-100k, 3.3% for AGIs over 100k)
IRA payment deduction: $2,964 (reported on 2.9% of returns)
01747:
$2,964
Massachusetts:
$3,100
Self-employed pension: $13,536 (reported on 1.0% of returns)
Here:
$13,536
Massachusetts:
$14,516
Total itemized deductions: $20,690 (19% of AGI, reported on 52.2% of returns)
Here:
$20,690
State:
$22,573
Here:
19.5% of AGI
State:
19.5% of AGI
(% of AGI for various income ranges: 28.6% for AGIs below $10k, 14.5% for AGIs $10k-25k, 15.0% for AGIs $25k-50k, 18.8% for AGIs $50k-75k, 19.9% for AGIs $75k-100k, 14.5% for AGIs over 100k)
Charity contributions deductions: $2,054 (2% of AGI, reported on 47.9% of returns)
Here:
$2,054
State:
$3,295
Here:
1.9% of AGI
State:
2.7% of AGI
(% of AGI for various income ranges: 1.2% for AGIs below $10k, 1.2% for AGIs $10k-25k, 1.4% for AGIs $25k-50k, 1.5% for AGIs $50k-75k, 1.6% for AGIs $75k-100k, 1.5% for AGIs over 100k)
Total tax: $11,263 (reported on 83.1% of returns)
01747:
$11,263
State:
$11,494
(% of AGI for various income ranges: 3.4% for AGIs below $10k, 4.9% for AGIs $10k-25k, 7.6% for AGIs $25k-50k, 8.9% for AGIs $50k-75k, 9.6% for AGIs $75k-100k, 18.7% for AGIs over 100k)
Earned income credit: $1,260 (reported on 5.3% of returns)
Here:
$1,260
State:
$1,518
Percentage of individuals using paid preparers for their 2004 taxes: 53.9%
Here:
54%
State:
58%
(% for various income ranges: 46.2% for AGIs below $10k, 52.1% for AGIs $10k-25k, 53.6% for AGIs $25k-50k, 57.4% for AGIs $50k-75k, 58.6% for AGIs $75k-100k, 57.1% for AGIs over 100k)
Household received Food Stamps/SNAP in the past 12 months: 146 Household did not receive Food Stamps/SNAP in the past 12 months: 2,033
Women who had a birth in the past 12 months: 66 (37 now married, 26 unmarried) Women who did not have a birth in the past 12 months: 1,536 (553 now married, 983 unmarried)
Housing units in zip code 01747 with a mortgage: 1,037 (230 second mortgage, 12 home equity loan, 161 both second mortgage and home equity loan) Houses without a mortgage: 32
Median monthly owner costs for units with a mortgage: $2,378 Median monthly owner costs for units without a mortgage: $1,176
Residents with income below the poverty level in 2022:
This zip code:
4.4%
Whole state:
10.4%
Residents with income below 50% of the poverty level in 2022:
This zip code:
3.0%
Whole state:
5.1%
Median number of rooms in houses and condos:
Here:
6.9
State:
6.5
Median number of rooms in apartments:
Here:
4.8
State:
4.0
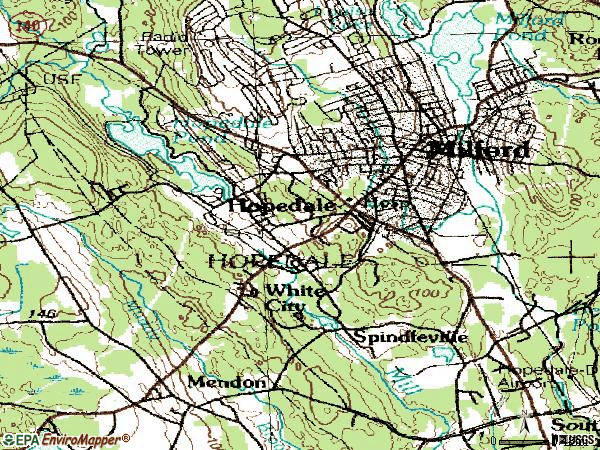
Notable locations in this zip code not listed on our city pages
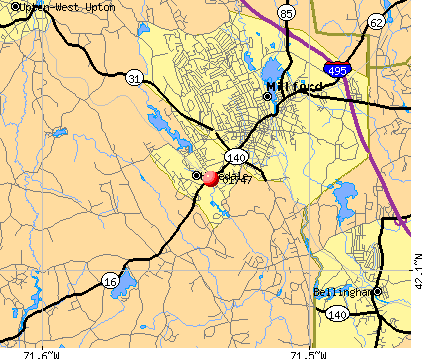
Notable locations in zip code 01747: Hopedale Country Club (A), Rockwell Draper Mill Complex (B), Bancroft Memorial Library (C), Hopedale Fire Department (D), Milford County Home (E). Display/hide their locations on the map
Churches in zip code 01747 include: Union Evangelical Church (A), Sacred Heart of Jesus Church (B), Hopedale Unitarian Parish Church (C), Bethany Assembly of God Church (D). Display/hide their locations on the map
In group quarters: 71 (-1 institutionalized population)
Size of family households: 648 2-persons, 453 3-persons, 293 4-persons, 141 5-persons, 96 6-persons
Size of nonfamily households: 473 1-person, 97 2-persons
1,128 married couples with children.
268 single-parent households (171 men, 97 women).
94.5% of residents of 01747 zip code speak English at home.
2.9% of residents speak Spanish at home (49% very well, 8% well, 27% not well, 17% not at all).
1.4% of residents speak other Indo-European language at home (100% very well).
0.4% of residents speak Asian or Pacific Island language at home (67% very well, 33% well).
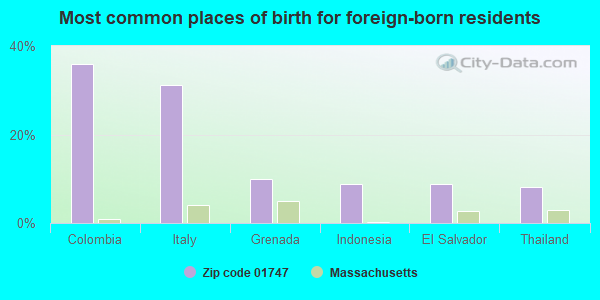
Foreign born population: 170 (2.8%) (52.3% of them are naturalized citizens)
This zip code:
2.8%
Whole state:
18.0%
36%Colombia
31%Italy
10%Grenada
9%Indonesia
9%El Salvador
8%Thailand
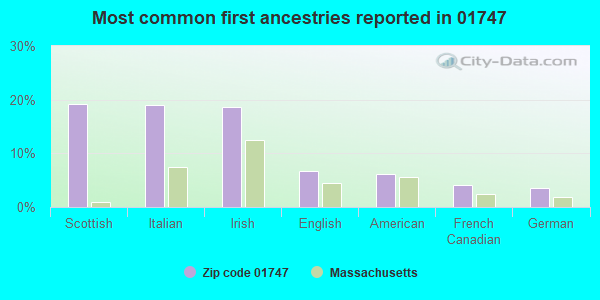
19%Scottish
19%Italian
19%Irish
7%English
6%American
4%French Canadian
4%German
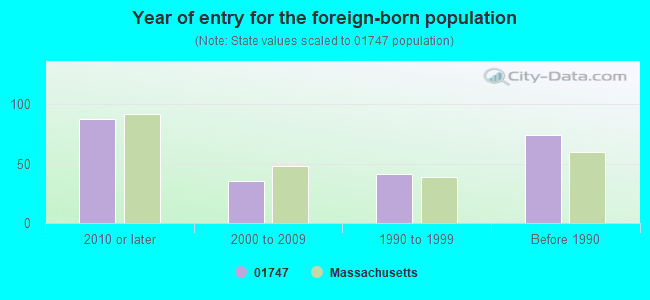
Year of entry for the foreign-born population
882010 or later
352000 to 2009
411990 to 1999
74Before 1990
Facilities with environmental interests located in this zip code:
MILFORD WASTE WATER TREATMENT FACILITY (52 MAIN ST OFF RTE 140 in HOPEDALE, MA)
(Integrated Compliance Information System) - ICIS-01-1996-0087, FORMAL ENFORCEMENT ACTION National Pollutant Discharge Elimination System MAJOR (Tracking pollutant discharge elimination systems) - permit National Pollutant Discharge Elimination System NON-MAJOR (Tracking pollutant discharge elimination systems) - permit Business SIC classification: SEWERAGE SYSTEMS Organizations: MILFORD W W T F (CONTACT/OPERATOR)
Alternative names: MILFORD, TOWN OF, MILFORD W W T F
ALGONQUIN INDUSTRIES INC (2 BUSINESS WAY in HOPEDALE, MA)
AIR MINOR (AIRS/AFS) CRITERIA AND HAZARDOUS AIR POLLUTANT INVENTORY (Inventory of air pollution sources) (Resource Conservation and Recovery Act (tracking hazardous waste)) Business SIC classification: COATING, ENGRAVING, AND ALLIED SERVICES Business NAICS classification: ALL OTHER MISCELLANEOUS FABRICATED METAL PRODUCT MANUFACTURING. Organizations: HOPEDALE AIRPORT PARK (CONTACT/OWNER)
Alternative names: ALGONQUIN INDUSTRIES INC (HI TECH METALS & FINISHES), ALGONQUIN INDUSTRIES/HI TECH METALS, HI TECH METALS & FINISHES, HI TECH METALS & FINISHING
MEMORIAL (6 PROSPECT STREET in HOPEDALE, MA)
(National Center for Education Statistics) - STATE ID-138010 Organizations: HOPEDALE (SCHOOL DISTRICT)
NYNEX MATERIEL ENTERPRISES CO (25 FREEDOM ST in HOPEDALE, MA)
(Resource Conservation and Recovery Act (tracking hazardous waste))
OEM CONCEPTS HOPEDALE AIRPORT (1 BUSINESS WAY in HOPEDALE, MA)
Conditionally Exempt Small Quantity Generators, less than 100 kg/month of hazardous waste (Resource Conservation and Recovery Act (tracking hazardous waste)) - notification Organizations: JOSEPH MEMPHI (CONTACT/OWNER)
, ROBERT MINARCHI (CONTACT/OWNER)
Alternative names: O E M CONCEPTS HOPEDALE AIRPORT
LORD & SON AUTO BODY (13 ELMWOOD AVE in HOPEDALE, MA)
Conditionally Exempt Small Quantity Generators, less than 100 kg/month of hazardous waste (Resource Conservation and Recovery Act (tracking hazardous waste)) - notification
MASSACHUSETTS ELECTRIC COMPANY (245 SOUTH MAIN ST in HOPEDALE, MA)
Small Quantity Generators, between 100 kg and 1000 kg of hazardous waste/month (Resource Conservation and Recovery Act (tracking hazardous waste)) - notification Alternative names: MA ELEC CO SOUTHEAST DIST HDQRS
LEDGES SCHOOL (55 ADIN STREET in HOPEDALE, MA)
COMPLIANCE ACTIVITY (Tracking inspections of insecticide, fungicide, and rodenticide, and toxic substances)
Housing units lacking complete plumbing facilities: 1.0% Housing units lacking complete kitchen facilities: 4.2%
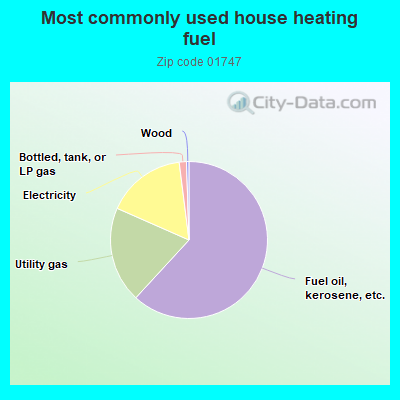
61.9%Fuel oil, kerosene, etc.
19.8%Utility gas
16.4%Electricity
1.5%Bottled, tank, or LP gas
0.5%Wood
Population in 1990: 5,649. Population change in the 1990s: +96 (+1.7%).
Place of birth for U.S.-born residents:
This state: 4,354
Northeast: 844
Midwest: 333
South: 110
West: 97
67% of the 01747 zip code residents lived in the same house 5 years ago. Out of people who lived in different houses, 59% lived in this county. Out of people who lived in different counties, 50% lived in Massachusetts.
96% of the 01747 zip code residents lived in the same house 1 year ago. Out of people who lived in different houses, 36% moved from this county. Out of people who lived in different houses, 45% moved from different county within same state. Out of people who lived in different houses, 24% moved from abroad.
Private vs. public school enrollment:
Students in private schools in grades 1 to 8 (elementary and middle school):
Here:
0.0%
Massachusetts:
10.3%
Students in private schools in grades 9 to 12 (high school): 3
Here:
0.5%
Massachusetts:
12.3%
Students in private undergraduate colleges: 193
Here:
62.1%
Massachusetts:
51.2%
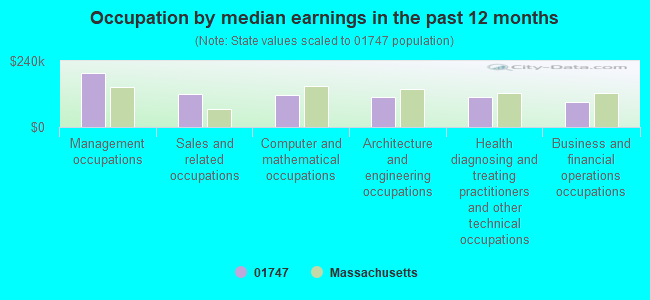
Occupation by median earnings in the past 12 months ($)
196,220Management occupations
119,663Sales and related occupations
117,448Computer and mathematical occupations
110,713Architecture and engineering occupations
108,299Health diagnosing and treating practitioners and other technical occupations
91,143Business and financial operations occupations
Companies with federal contracts located in this zip code (HOPEDALE, MA):
AGGREKO INC (11 HOPEDALE ROAD) : $7,963,208 in 64 contractsfrom 2000 to 2005
Contracts for Lease or Rental of Equipment -- Refrigeration, Air Conditioning, and Air Circulating Equipment, Lease or Rental of Equipment -- Furnace, Steam Plant, and Drying Equipment; and Nuclear Reactors, Lease or Rental of Equipment -- Plumbing, Heating, and Waste Disposal Equipment by Navy, Army Signed by year:2000: $85,560; 2001: $29,400; 2002: $7,459,125; 2003: $117,086; 2004: $106,686; 2005: $165,351; 2006: $0.
Biggest contracts:
$7,459,125 with Navy for Lease or Rental of Equipment -- Refrigeration, Air Conditioning, and Air Circulating Equipment. Signed on 2002-09-10. Completion date: 2003-05-03.
$85,560, same as above.Signed on 2000-04-26. Completion date: 2001-01-12.
$49,000 with Navy for Lease or Rental of Equipment -- Furnace, Steam Plant, and Drying Equipment; and Nuclear Reactors. Signed on 2003-10-16. Completion date: 2004-01-26.
$38,905 with Navy for Lease or Rental of Equipment -- Refrigeration, Air Conditioning, and Air Circulating Equipment. Signed on 2003-04-18. Completion date: 2003-09-30.
CONSULTING ENGINEERS GROUP, IN (7 CHARLESVIEW ROAD - SUITE; small business) : $43,104 in 6 contractsfrom 2001 to 2006
Contracts for Architect - Engineer Services (including landscaping, interior layout, and designing), Maintenance, Repair or Alteration of Real Property -- Other Industrial Buildings, Other Architect and Engineering Services by Navy Signed by year:2000: $0; 2001: $22,504; 2002: $1,600; 2003: $0; 2004: $2,000; 2005: $0; 2006: $17,000.
Biggest contracts:
$20,904 with Navy for Architect - Engineer Services (including landscaping, interior layout, and designing). Taking place in CT. Signed on 2001-08-09. Completion date: 2001-10-28.
$17,000 with Navy for Maintenance, Repair or Alteration of Real Property -- Other Industrial Buildings. Taking place in CT. Signed on 2006-03-24. Completion date: 2006-04-07.
$2,000 with Navy for Other Architect and Engineering Services. Taking place in CT. Signed on 2004-07-06. Completion date: 2004-07-26.
$1,600 with Navy for Architect - Engineer Services (including landscaping, interior layout, and designing). Taking place in CT. Signed on 2001-11-27. Completion date: 2002-01-01.
HENRY, KELLEY M (12 PROGRESS ST; small business)
$10,800 with Army for Other Professional Services. Signed on 2005-10-04. Completion date: 2006-01-31.
S E SHIRES CO , INC (4A SPACEWAY LANE; small business) : $10,055 in 3 contractsfrom 2001 to 2002
$3,740 with Army for Musical Instruments. Taking place in VA. Signed on 2001-05-03. Completion date: 2001-06-01.
$3,330, same as above.Signed on 2002-06-18. Completion date: 2002-06-28.
$2,985, same as above.Signed on 2001-06-05. Completion date: 2001-08-01.
KING-GAGE ENGINEERING CORPORAT (94 MENDON ST STE 100; small business)
$0 with Defense Logistics Agency for Electrical and Electronic assemblies, Boards, Cards, and Associated Hardware. Signed on 2002-09-16. Completion date: 2003-09-16.
Top industries in this zip code by the number of employees in 2005:
Administrative and Support and Waste Management and Remediation Services: Janitorial Services (100-249 employees: 1 establishment, 10-19 employees: 1 establishment, 1-4 employees: 1 establishment)
Utilities: Electric Power Distribution (100-249: 1, 1-4: 1)
Construction: All Other Specialty Trade Contractors (50-99: 1, 5-9: 1, 1-4: 2)
Health Care and Social Assistance: Nursing Care Facilities (50-99: 1)
Health Care and Social Assistance: Offices of Physicians (except Mental Health Specialists) (10-19: 3, 5-9: 2, 1-4: 1)
Administrative and Support and Waste Management and Remediation Services: Landscaping Services (20-49: 1, 1-4: 2)
Other Services (except Public Administration): Communication Equipment Repair and Maintenance (20-49: 1)
People in group quarters in 2010:
49 people in nursing facilities/skilled-nursing facilities
21 people in group homes intended for adults
8 people in group homes for juveniles (non-correctional)
People in group quarters in 2000:
86 people in nursing homes
29 people in schools, hospitals, or wards for the intellectually disabled
8 people in homes or halfway houses for drug/alcohol abuse
6 people in homes for the mentally retarded
Fatal accident statistics in 2012:
Fatal accident count: 1
Vehicles involved in fatal accidents: 1
Fatal accidents caused by drunken drivers: 0
Fatalities: 1
Persons involved in fatal accidents: 1
Pedestrians involved in fatal accidents: 0
Fatal accident statistics in 2011:
Fatal accident count: 1
Vehicles involved in fatal accidents: 1
Fatal accidents caused by drunken drivers: 0
Fatalities: 1
Persons involved in fatal accidents: 1
Pedestrians involved in fatal accidents: 0
Home Mortgage Disclosure Act Aggregated Statistics For Year 2009 (Based on 2 full tracts)
A) FHA, FSA/RHS & VA Home Purchase Loans
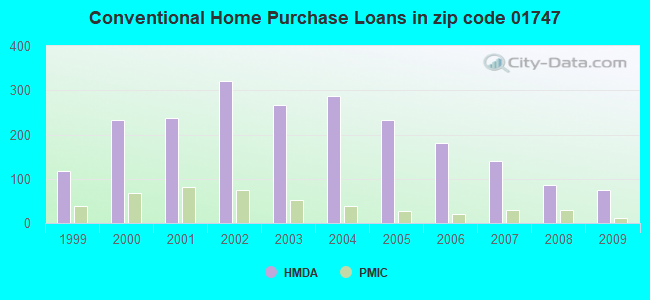
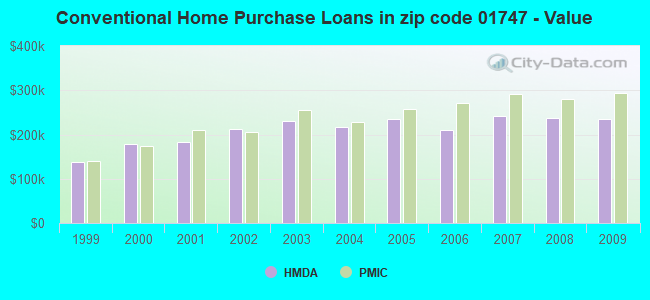
B) Conventional Home Purchase Loans
C) Refinancings
D) Home Improvement Loans
F) Non-occupant Loans on < 5 Family Dwellings (A B C & D)
Number
Average Value
Number
Average Value
Number
Average Value
Number
Average Value
Number
Average Value
LOANS ORIGINATED
44
$220,510
74
$235,071
567
$227,682
14
$151,499
18
$223,076
APPLICATIONS APPROVED, NOT ACCEPTED
0
$0
6
$215,677
38
$204,796
2
$173,935
4
$137,158
APPLICATIONS DENIED
0
$0
18
$192,264
95
$226,693
12
$132,852
8
$175,175
APPLICATIONS WITHDRAWN
8
$203,750
6
$275,973
89
$238,112
6
$89,452
2
$178,900
FILES CLOSED FOR INCOMPLETENESS
2
$327,985
4
$163,992
18
$198,228
2
$19,880
0
$0
Aggregated Statistics For Year 2008 (Based on 2 full tracts)
A) FHA, FSA/RHS & VA Home Purchase Loans
B) Conventional Home Purchase Loans
C) Refinancings
D) Home Improvement Loans
F) Non-occupant Loans on < 5 Family Dwellings (A B C & D)
Number
Average Value
Number
Average Value
Number
Average Value
Number
Average Value
Number
Average Value
LOANS ORIGINATED
18
$229,259
85
$237,647
211
$206,769
44
$75,536
24
$188,344
APPLICATIONS APPROVED, NOT ACCEPTED
2
$241,520
6
$214,352
28
$223,485
4
$9,940
4
$74,542
APPLICATIONS DENIED
2
$171,945
14
$180,606
89
$212,873
8
$30,314
4
$70,568
APPLICATIONS WITHDRAWN
0
$0
2
$414,455
38
$238,431
0
$0
0
$0
FILES CLOSED FOR INCOMPLETENESS
0
$0
0
$0
14
$209,429
4
$109,330
4
$270,340
Aggregated Statistics For Year 2007 (Based on 2 full tracts)
A) FHA, FSA/RHS & VA Home Purchase Loans
B) Conventional Home Purchase Loans
C) Refinancings
D) Home Improvement Loans
F) Non-occupant Loans on < 5 Family Dwellings (A B C & D)
Number
Average Value
Number
Average Value
Number
Average Value
Number
Average Value
Number
Average Value
LOANS ORIGINATED
0
$0
141
$241,497
280
$205,680
62
$94,356
30
$182,082
APPLICATIONS APPROVED, NOT ACCEPTED
0
$0
14
$132,615
62
$181,242
12
$76,696
6
$159,023
APPLICATIONS DENIED
2
$286,245
12
$265,537
135
$286,641
20
$53,472
4
$190,332
APPLICATIONS WITHDRAWN
0
$0
10
$290,616
80
$298,195
10
$65,200
6
$119,268
FILES CLOSED FOR INCOMPLETENESS
0
$0
2
$208,720
28
$249,824
0
$0
0
$0
Aggregated Statistics For Year 2006 (Based on 2 full tracts)
B) Conventional Home Purchase Loans
C) Refinancings
D) Home Improvement Loans
E) Loans on Dwellings For 5+ Families
F) Non-occupant Loans on < 5 Family Dwellings (A B C & D)
G) Loans On Manufactured Home Dwelling (A B C & D)
Number
Average Value
Number
Average Value
Number
Average Value
Number
Average Value
Number
Average Value
Number
Average Value
LOANS ORIGINATED
181
$209,949
332
$203,007
80
$109,702
2
$294,195
26
$193,275
2
$34,785
APPLICATIONS APPROVED, NOT ACCEPTED
16
$161,881
46
$162,956
8
$81,500
0
$0
4
$308,110
0
$0
APPLICATIONS DENIED
34
$146,805
151
$217,697
24
$140,471
0
$0
6
$266,365
0
$0
APPLICATIONS WITHDRAWN
22
$178,902
101
$233,045
16
$186,232
0
$0
6
$207,063
0
$0
FILES CLOSED FOR INCOMPLETENESS
4
$215,678
52
$262,925
2
$433,340
0
$0
2
$433,340
0
$0
Aggregated Statistics For Year 2005 (Based on 2 full tracts)
A) FHA, FSA/RHS & VA Home Purchase Loans
B) Conventional Home Purchase Loans
C) Refinancings
D) Home Improvement Loans
F) Non-occupant Loans on < 5 Family Dwellings (A B C & D)
G) Loans On Manufactured Home Dwelling (A B C & D)
Number
Average Value
Number
Average Value
Number
Average Value
Number
Average Value
Number
Average Value
Number
Average Value
LOANS ORIGINATED
2
$286,245
233
$234,671
415
$219,745
97
$84,512
28
$195,727
0
$0
APPLICATIONS APPROVED, NOT ACCEPTED
0
$0
16
$138,525
42
$141,938
6
$107,342
2
$29,815
0
$0
APPLICATIONS DENIED
0
$0
50
$192,340
155
$226,968
24
$68,827
6
$203,750
2
$21,865
APPLICATIONS WITHDRAWN
0
$0
34
$224,914
161
$223,955
12
$167,969
16
$262,266
0
$0
FILES CLOSED FOR INCOMPLETENESS
0
$0
2
$254,440
76
$276,069
2
$319,040
0
$0
0
$0
Aggregated Statistics For Year 2004 (Based on 2 full tracts)
A) FHA, FSA/RHS & VA Home Purchase Loans
B) Conventional Home Purchase Loans
C) Refinancings
D) Home Improvement Loans
E) Loans on Dwellings For 5+ Families
F) Non-occupant Loans on < 5 Family Dwellings (A B C & D)
Number
Average Value
Number
Average Value
Number
Average Value
Number
Average Value
Number
Average Value
Number
Average Value
LOANS ORIGINATED
6
$296,182
288
$216,159
483
$188,536
54
$70,898
2
$101,380
30
$202,822
APPLICATIONS APPROVED, NOT ACCEPTED
0
$0
22
$256,788
68
$199,774
14
$98,538
0
$0
2
$124,235
APPLICATIONS DENIED
0
$0
28
$212,695
113
$221,191
38
$67,271
0
$0
14
$154,906
APPLICATIONS WITHDRAWN
0
$0
26
$249,545
87
$207,828
14
$71,703
0
$0
6
$115,955
FILES CLOSED FOR INCOMPLETENESS
0
$0
4
$255,930
58
$301,015
6
$193,148
0
$0
0
$0
Aggregated Statistics For Year 2003 (Based on 2 full tracts)
A) FHA, FSA/RHS & VA Home Purchase Loans
B) Conventional Home Purchase Loans
C) Refinancings
D) Home Improvement Loans
F) Non-occupant Loans on < 5 Family Dwellings (A B C & D)
Number
Average Value
Number
Average Value
Number
Average Value
Number
Average Value
Number
Average Value
LOANS ORIGINATED
6
$196,130
266
$230,151
1,344
$177,778
16
$43,234
46
$147,270
APPLICATIONS APPROVED, NOT ACCEPTED
0
$0
14
$259,124
115
$177,398
2
$39,755
6
$180,558
APPLICATIONS DENIED
2
$184,865
18
$216,781
199
$185,605
14
$45,577
0
$0
APPLICATIONS WITHDRAWN
0
$0
22
$195,527
175
$190,056
0
$0
8
$133,182
FILES CLOSED FOR INCOMPLETENESS
0
$0
4
$247,480
22
$201,220
2
$54,665
0
$0
Aggregated Statistics For Year 2002 (Based on 2 full tracts)
A) FHA, FSA/RHS & VA Home Purchase Loans
B) Conventional Home Purchase Loans
C) Refinancings
D) Home Improvement Loans
F) Non-occupant Loans on < 5 Family Dwellings (A B C & D)
Number
Average Value
Number
Average Value
Number
Average Value
Number
Average Value
Number
Average Value
LOANS ORIGINATED
18
$204,302
322
$212,312
948
$166,048
58
$31,222
36
$179,509
APPLICATIONS APPROVED, NOT ACCEPTED
0
$0
12
$181,056
97
$155,745
26
$36,392
0
$0
APPLICATIONS DENIED
0
$0
8
$231,828
66
$157,036
14
$62,758
2
$15,900
APPLICATIONS WITHDRAWN
2
$157,035
28
$187,137
93
$138,676
8
$47,210
2
$139,145
FILES CLOSED FOR INCOMPLETENESS
0
$0
2
$215,675
12
$184,368
0
$0
0
$0
Aggregated Statistics For Year 2001 (Based on 2 full tracts)
A) FHA, FSA/RHS & VA Home Purchase Loans
B) Conventional Home Purchase Loans
C) Refinancings
D) Home Improvement Loans
E) Loans on Dwellings For 5+ Families
F) Non-occupant Loans on < 5 Family Dwellings (A B C & D)
Number
Average Value
Number
Average Value
Number
Average Value
Number
Average Value
Number
Average Value
Number
Average Value
LOANS ORIGINATED
16
$173,808
237
$182,693
708
$154,299
36
$50,358
2
$160,020
14
$158,030
APPLICATIONS APPROVED, NOT ACCEPTED
0
$0
8
$203,750
62
$113,240
14
$50,121
0
$0
0
$0
APPLICATIONS DENIED
0
$0
6
$138,815
117
$117,093
16
$45,719
0
$0
4
$117,280
APPLICATIONS WITHDRAWN
2
$160,020
8
$205,738
85
$127,734
14
$43,164
0
$0
0
$0
FILES CLOSED FOR INCOMPLETENESS
0
$0
0
$0
16
$153,806
2
$13,915
0
$0
0
$0
Aggregated Statistics For Year 2000 (Based on 2 full tracts)
A) FHA, FSA/RHS & VA Home Purchase Loans
B) Conventional Home Purchase Loans
C) Refinancings
D) Home Improvement Loans
F) Non-occupant Loans on < 5 Family Dwellings (A B C & D)
Number
Average Value
Number
Average Value
Number
Average Value
Number
Average Value
Number
Average Value
LOANS ORIGINATED
14
$140,282
233
$179,422
157
$100,061
28
$21,369
8
$92,184
APPLICATIONS APPROVED, NOT ACCEPTED
0
$0
26
$238,612
32
$134,673
20
$24,152
2
$834,875
APPLICATIONS DENIED
2
$120,260
10
$166,578
50
$69,971
26
$35,016
0
$0
APPLICATIONS WITHDRAWN
0
$0
22
$144,206
48
$77,731
14
$66,165
2
$127,220
FILES CLOSED FOR INCOMPLETENESS
0
$0
4
$68,580
2
$30,810
2
$48,700
0
$0
Aggregated Statistics For Year 1999 (Based on 1 full tract)
A) FHA, FSA/RHS & VA Home Purchase Loans
B) Conventional Home Purchase Loans
C) Refinancings
D) Home Improvement Loans
F) Non-occupant Loans on < 5 Family Dwellings (A B C & D)
Detailed PMIC statistics for the following Tracts:7451.00
2002 - 2018 National Fire Incident Reporting System (NFIRS) incidents
According to the data from the years 2002 - 2018 the average number of fire incidents per year is 18. The highest number of fire incidents - 37 took place in 2016, and the least - 5 in 2006. The data has an increasing trend.
When looking into fire subcategories, the most reports belonged to: Structure Fires (65.4%), and Outside Fires (25.9%).
Fire incident types reported to NFIRS in Zip Code 01747


 Nearest zip codes: 01756, 01757, 02019, 01504, 01568, 01529.


 According to the data from the years 2002 - 2018 the average number of fire incidents per year is 18. The highest number of fire incidents - 37 took place in 2016, and the least - 5 in 2006. The data has an increasing trend.
 When looking into fire subcategories, the most reports belonged to: Structure Fires (65.4%), and Outside Fires (25.9%).