Estimated zip code population in 2022: 1,654 Zip code population in 2010: 1,714 Zip code population in 2000: 1,516
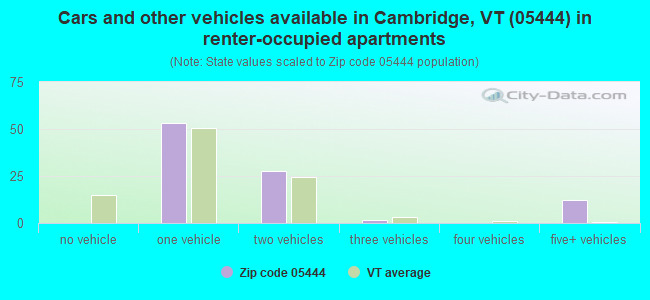
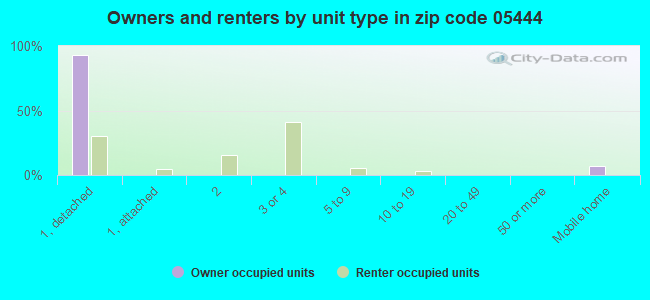
Houses and condos: 648 Renter-occupied apartments: 92
% of renters here:
14%
State:
26%
March 2022 cost of living index in zip code 05444: 93.5 (less than average, U.S. average is 100)
Land area: 20.2 sq. mi. Water area: 0.3 sq. mi.
Population density: 82 people per square mile
(very low).
OSM Map
Google Map
MSN Map
OSM Map
General Map
Google Map
MSN Map
OSM Map
Google Map
MSN Map
OSM Map
Google Map
MSN Map
Please wait while loading the map...
Real estate property taxes paid for housing units in 2022:
This zip code:
1.4% ($4,835)
Vermont:
1.6% ($4,787)
Median real estate property taxes paid for housing units with mortgages in 2022: $4,668 (1.4%) Median real estate property taxes paid for housing units with no mortgage in 2022: $5,235 (1.4%)
Business Search- 14 Million verified businesses
Males: 816
(49.4%)
Females: 837
(50.6%)
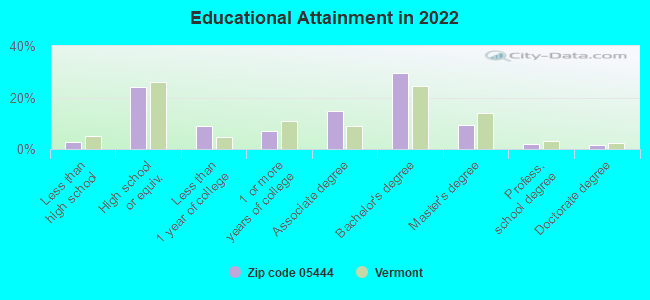
For population 25 years and over in 05444:
High school or higher: 97.6%
Bachelor's degree or higher: 42.3%
Graduate or professional degree: 12.7%
Unemployed: 0.7%
Mean travel time to work (commute): 29.6 minutes
For population 15 years and over in 05444:
Never married: 25.8%
Now married: 65.3%
Separated: 1.1%
Widowed: 0.9%
Divorced: 6.9%
Zip code 05444 compared to state average:
Unemployed percentage significantly below state average.
Black race population percentage significantly below state average.
Renting percentage below state average.
Length of stay since moving in significantly above state average.
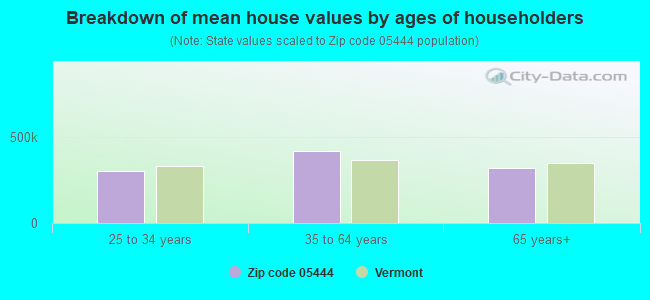
Estimated median house/condo value in 2022: $342,284
05444:
$342,284
Vermont:
$304,700
According to our research of Vermont and other state lists, there was 1 registered sex offender living in 05444 zip code as of May 23, 2024. The ratio of all residents to sex offenders in zip code 05444 is 1,454 to 1. The ratio of registered sex offenders to all residents in this zip code is much lower than the state average.
Median resident age:
This zip code:
41.9 years
Vermont median age:
43.2 years
Average household size:
This zip code:
2.5 people
Vermont:
2.2 people
Averages for the 2020 tax year for zip code 05444, filed in 2021:
Average Adjusted Gross Income (AGI) in 2020: $69,236 (Individual Income Tax Returns)
Here:
$69,236
State:
$70,107
Salary/wage: $57,977 (reported on 86.3% of returns)
Here:
$57,977
State:
$56,381
(% of AGI for various income ranges: 1125.6% for AGIs below $25k, 3879.5% for AGIs $25k-50k, 6935.4% for AGIs $50k-75k, 8460.0% for AGIs $75k-100k, 14145.3% for AGIs $100k-200k)
Taxable interest for individuals: $682 (reported on 38.2% of returns)
This zip code:
$682
Vermont:
$1,276
(% of AGI for various income ranges: 20.0% for AGIs below $25k, 14.2% for AGIs $25k-50k, 25.4% for AGIs $50k-75k, 56.2% for AGIs $75k-100k, 37.3% for AGIs $100k-200k)
Ordinary dividends: $4,305 (reported on 21.6% of returns)
Here:
$4,305
State:
$8,930
(% of AGI for various income ranges: 36.2% for AGIs below $25k, 33.7% for AGIs $25k-50k, 89.2% for AGIs $50k-75k, 70.0% for AGIs $75k-100k, 435.3% for AGIs $100k-200k)
Net capital gain/loss in AGI: +$17,053 (reported on 16.7% of returns)
Here:
+$17,053
State:
+$19,777
(% of AGI for various income ranges: 57.4% for AGIs $25k-50k, 130.8% for AGIs $50k-75k, 230.0% for AGIs $75k-100k, 1632.7% for AGIs $100k-200k)
Profit/loss from business: +$13,039 (reported on 17.6% of returns)
Here:
+$13,039
State:
+$15,467
(% of AGI for various income ranges: 136.2% for AGIs below $25k, 207.9% for AGIs $25k-50k, 203.8% for AGIs $50k-75k, 515.0% for AGIs $75k-100k, 704.7% for AGIs $100k-200k)
Taxable individual retirement arrangement distribution: $15,189 (reported on 8.8% of returns)
05444:
$15,189
Vermont:
$17,245
(% of AGI for various income ranges: 133.8% for AGIs below $25k, 336.2% for AGIs $50k-75k, 477.3% for AGIs $100k-200k)
Total itemized deductions: $27,120 (reported on 4.9% of returns)
Here:
$27,120
State:
$33,390
(% of AGI for various income ranges: 371.5% for AGIs $50k-75k, 582.0% for AGIs $100k-200k)
Charity contributions: $11,933 (reported on 2.9% of returns)
Here:
$11,933
State:
$11,950
(% of AGI for various income ranges: 447.5% for AGIs $75k-100k)
Taxes paid: $7,860 (reported on 4.9% of returns)
05444:
$7,860
State:
$8,349
(% of AGI for various income ranges: 135.4% for AGIs $50k-75k, 144.7% for AGIs $100k-200k)
Earned income credit: $1,760 (reported on 9.8% of returns)
Here:
$1,760
State:
$1,839
(% of AGI for various income ranges: 57.5% for AGIs below $25k, 44.2% for AGIs $25k-50k)
Percentage of individuals using paid preparers for their 2020 taxes: 93.1%
Here:
93%
State:
93%
(% for various income ranges: 88.5% for AGIs below $25k, 95.8% for AGIs $25k-50k, 94.4% for AGIs $50k-75k, 90.9% for AGIs $75k-100k, 95.0% for AGIs $100k-200k, 100.0% for AGIs over 200k)
Averages for the 2012 tax year for zip code 05444, filed in 2013:
Average Adjusted Gross Income (AGI) in 2012: $51,433 (Individual Income Tax Returns)
Here:
$51,433
State:
$55,225
Salary/wage: $46,564 (reported on 87.9% of returns)
Here:
$46,564
State:
$44,925
(% of AGI for various income ranges: 74.4% for AGIs below $25k, 86.5% for AGIs $25k-50k, 82.5% for AGIs $50k-75k, 80.6% for AGIs $75k-100k, 74.5% for AGIs $100k-200k)
Taxable interest for individuals: $643 (reported on 35.4% of returns)
This zip code:
$643
Vermont:
$1,237
(% of AGI for various income ranges: 0.9% for AGIs below $25k, 0.5% for AGIs $25k-50k, 0.4% for AGIs $50k-75k, 0.4% for AGIs $75k-100k, 0.4% for AGIs $100k-200k)
Ordinary dividends: $3,045 (reported on 20.2% of returns)
Here:
$3,045
State:
$7,010
(% of AGI for various income ranges: 0.4% for AGIs below $25k, 0.5% for AGIs $25k-50k, 0.5% for AGIs $50k-75k, 1.3% for AGIs $75k-100k, 2.1% for AGIs $100k-200k)
Net capital gain/loss in AGI: +$1,475 (reported on 12.1% of returns)
Here:
+$1,475
State:
+$13,197
(% of AGI for various income ranges: 0.3% for AGIs $50k-75k, 0.4% for AGIs $75k-100k, 0.7% for AGIs $100k-200k)
Profit/loss from business: +$10,926 (reported on 19.2% of returns)
Here:
+$10,926
State:
+$12,941
(% of AGI for various income ranges: 11.4% for AGIs below $25k, 4.2% for AGIs $25k-50k, 3.5% for AGIs $50k-75k, 3.5% for AGIs $75k-100k, 3.0% for AGIs $100k-200k)
Taxable individual retirement arrangement distribution: $13,333 (reported on 6.1% of returns)
05444:
$13,333
Vermont:
$12,934
Total itemized deductions: $16,444 (19% of AGI, reported on 34.3% of returns)
Here:
$16,444
State:
$22,572
Here:
19.4% of AGI
State:
19.9% of AGI
(% of AGI for various income ranges: 8.8% for AGIs below $25k, 9.0% for AGIs $25k-50k, 9.8% for AGIs $50k-75k, 10.2% for AGIs $75k-100k, 13.6% for AGIs $100k-200k)
Charity contributions: $1,960 (reported on 20.2% of returns)
Here:
$1,960
State:
$3,170
(% of AGI for various income ranges: 0.2% for AGIs $25k-50k, 0.4% for AGIs $50k-75k, 0.5% for AGIs $75k-100k, 1.6% for AGIs $100k-200k)
Taxes paid: $6,791 (reported on 34.3% of returns)
05444:
$6,791
State:
$10,425
(% of AGI for various income ranges: 1.7% for AGIs below $25k, 2.6% for AGIs $25k-50k, 3.6% for AGIs $50k-75k, 4.2% for AGIs $75k-100k, 6.9% for AGIs $100k-200k)
Earned income credit: $1,692 (reported on 13.1% of returns)
Here:
$1,692
State:
$1,828
(% of AGI for various income ranges: 4.1% for AGIs below $25k, 0.6% for AGIs $25k-50k)
Percentage of individuals using paid preparers for their 2012 taxes: 41.4%
Here:
41%
State:
49%
(% for various income ranges: 39.4% for AGIs below $25k, 40.7% for AGIs $25k-50k, 46.7% for AGIs $50k-75k, 41.7% for AGIs $75k-100k, 41.7% for AGIs $100k-200k)
Averages for the 2004 tax year for zip code 05444, filed in 2005:
Average Adjusted Gross Income (AGI) in 2004: $47,749 (Individual Income Tax Returns)
Here:
$47,749
State:
$44,564
Salary/wage: $40,333 (reported on 90.3% of returns)
Here:
$40,333
State:
$37,522
(% of AGI for various income ranges: 105.4% for AGIs below $10k, 79.7% for AGIs $10k-25k, 83.1% for AGIs $25k-50k, 84.6% for AGIs $50k-75k, 88.9% for AGIs $75k-100k, 48.2% for AGIs over 100k)
Taxable interest for individuals: $836 (reported on 51.9% of returns)
This zip code:
$836
Vermont:
$1,373
(% of AGI for various income ranges: 3.2% for AGIs below $10k, 1.6% for AGIs $10k-25k, 1.0% for AGIs $25k-50k, 0.5% for AGIs $50k-75k, 0.1% for AGIs $75k-100k, 1.7% for AGIs over 100k)
Taxable dividends: $1,928 (reported on 29.2% of returns)
Here:
$1,928
State:
$4,037
(% of AGI for various income ranges: 1.9% for AGIs below $10k, 0.5% for AGIs $10k-25k, 0.6% for AGIs $25k-50k, 0.9% for AGIs $50k-75k, 0.1% for AGIs $75k-100k, 3.0% for AGIs over 100k)
Net capital gain/loss: +$7,987 (reported on 17.9% of returns)
Here:
+$7,987
State:
+$11,311
(% of AGI for various income ranges: -0.2% for AGIs below $10k, 0.7% for AGIs $10k-25k, 1.2% for AGIs $25k-50k, 0.9% for AGIs $50k-75k, 0.3% for AGIs $75k-100k, 9.9% for AGIs over 100k)
Profit/loss from business: +$7,228 (reported on 19.5% of returns)
Here:
+$7,228
State:
+$11,197
(% of AGI for various income ranges: 14.7% for AGIs below $10k, 10.1% for AGIs $10k-25k, 3.9% for AGIs $25k-50k, 3.3% for AGIs $50k-75k, 1.9% for AGIs $75k-100k)
IRA payment deduction: $2,643 (reported on 3.3% of returns)
05444:
$2,643
Vermont:
$3,004
Total itemized deductions: $15,280 (19% of AGI, reported on 37.1% of returns)
Here:
$15,280
State:
$17,791
Here:
19.3% of AGI
State:
20.0% of AGI
(% of AGI for various income ranges: 7.4% for AGIs $10k-25k, 11.3% for AGIs $25k-50k, 12.0% for AGIs $50k-75k, 13.4% for AGIs $75k-100k, 12.7% for AGIs over 100k)
Charity contributions deductions: $1,536 (2% of AGI, reported on 27.4% of returns)
Here:
$1,536
State:
$2,686
Here:
1.8% of AGI
State:
2.8% of AGI
(% of AGI for various income ranges: 2.2% for AGIs below $10k, 0.4% for AGIs $25k-50k, 0.8% for AGIs $50k-75k, 1.0% for AGIs $75k-100k, 1.5% for AGIs over 100k)
Total tax: $5,914 (reported on 81.8% of returns)
05444:
$5,914
State:
$6,533
(% of AGI for various income ranges: 4.5% for AGIs below $10k, 5.9% for AGIs $10k-25k, 7.4% for AGIs $25k-50k, 8.3% for AGIs $50k-75k, 10.6% for AGIs $75k-100k, 15.5% for AGIs over 100k)
Earned income credit: $1,767 (reported on 8.5% of returns)
Here:
$1,767
State:
$1,432
Percentage of individuals using paid preparers for their 2004 taxes: 49.2%
Here:
49%
State:
54%
(% for various income ranges: 35.3% for AGIs below $10k, 48.8% for AGIs $10k-25k, 50.8% for AGIs $25k-50k, 59.1% for AGIs $50k-75k, 48.5% for AGIs $75k-100k, 51.0% for AGIs over 100k)
Household received Food Stamps/SNAP in the past 12 months: 18 Household did not receive Food Stamps/SNAP in the past 12 months: 633
Women who had a birth in the past 12 months: 22 (21 now married, 0 unmarried) Women who did not have a birth in the past 12 months: 362 (218 now married, 147 unmarried)
Housing units in zip code 05444 with a mortgage: 387 (15 second mortgage, 15 both second mortgage and home equity loan) Houses without a mortgage: 3
Median monthly owner costs for units with a mortgage: $1,970 Median monthly owner costs for units without a mortgage: $699
Residents with income below the poverty level in 2022:
This zip code:
4.3%
Whole state:
10.4%
Residents with income below 50% of the poverty level in 2022:
This zip code:
1.6%
Whole state:
6.1%
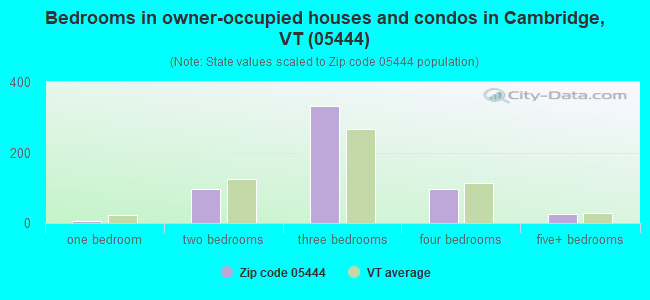
Median number of rooms in houses and condos:
Here:
6.2
State:
6.4
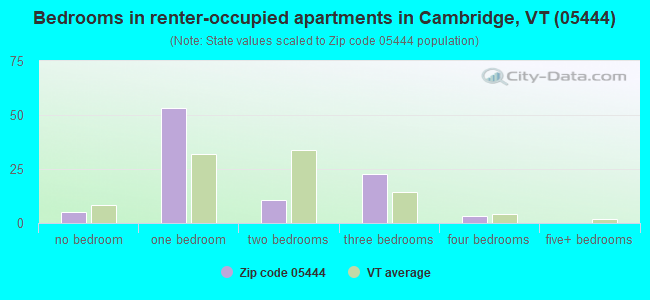
Median number of rooms in apartments:
Here:
3.9
State:
3.9
Notable locations in this zip code not listed on our city pages
Churches in zip code 05444 include: Cambridge Congregational Church (A), Saint Marys Catholic Church (B), Fletcher Union Church (C). Display/hide their locations on the map
Cemeteries: Gates Cemetery (1), Giddings Cemetery (2), Mountainview Cemetery (3), River Road Cemetery (4), Pioneer Cemetery (5), Binghamville Cemetery (6). Display/hide their locations on the map
In group quarters: 4 (-1 institutionalized population)
Size of family households: 187 2-persons, 133 3-persons, 134 4-persons, 2 5-persons, 3 6-persons, 3 7-or-more-persons
Size of nonfamily households: 124 1-person, 61 2-persons
258 married couples with children.
73 single-parent households (51 men, 22 women).
95.5% of residents of 05444 zip code speak English at home.
1.2% of residents speak Spanish at home (79% very well, 21% not well).
2.7% of residents speak other Indo-European language at home (98% very well, 2% well).
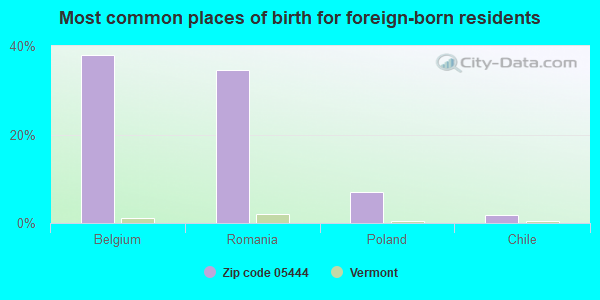
Foreign born population: 55 (3.3%) (63.9% of them are naturalized citizens)
This zip code:
3.3%
Whole state:
4.2%
38%Belgium
34%Romania
7%Poland
2%Chile
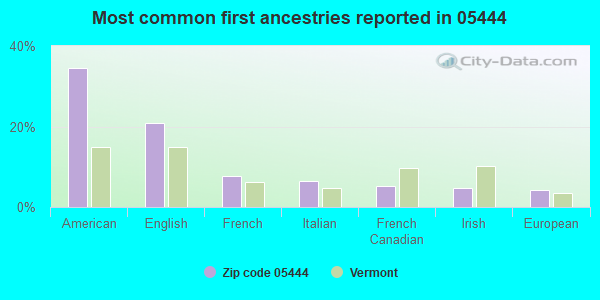
34%American
21%English
8%French
6%Italian
5%French Canadian
5%Irish
4%European
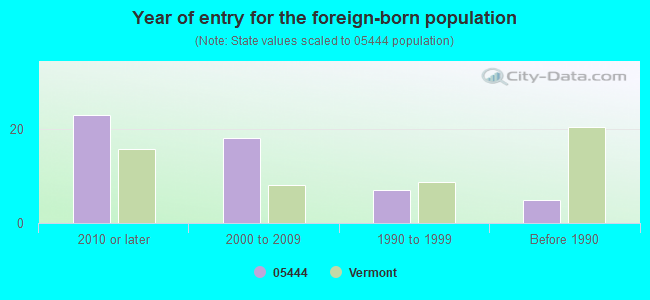
Year of entry for the foreign-born population
232010 or later
182000 to 2009
71990 to 1999
5Before 1990
Facilities with environmental interests located in this zip code:
KINNEY DRUGS #86 (155 SOUTH MAIN ST in CAMBRIDGE, VT)
Conditionally Exempt Small Quantity Generators, less than 100 kg/month of hazardous waste (Resource Conservation and Recovery Act (tracking hazardous waste)) Organizations: KINNEY DRUGS INC (CONTACT/OPERATOR)
, BAILEY REALTY (CONTACT/OWNER)
KRUSCH ERNEST (739 N CAMBRIDGE RD in CAMBRIDGE, VT)
(Resource Conservation and Recovery Act (tracking hazardous waste)) Organizations: ERNEST KRUSCH (CONTACT/OWNER)
LOMA INC (445 VT RTE 104 in CAMBRIDGE, VT)
Conditionally Exempt Small Quantity Generators, less than 100 kg/month of hazardous waste (Resource Conservation and Recovery Act (tracking hazardous waste)) Organizations: CAMBRIDGE EQUIP CO (CONTACT/OWNER)
DR DAVID SOLOMON DDS (272 N MAIN ST SUITE 201 in CAMBRIDGE, VT)
Conditionally Exempt Small Quantity Generators, less than 100 kg/month of hazardous waste (Resource Conservation and Recovery Act (tracking hazardous waste)) - notification Organizations: CAMBRIDGE REGIONAL HEALTH CTR (CONTACT/OWNER)
Alternative names: SOLOMON DR DAVID DDS
FINE LINE POWER EQUIPMENT (RTE 104 & 15 in CAMBRIDGE, VT)
Conditionally Exempt Small Quantity Generators, less than 100 kg/month of hazardous waste (Resource Conservation and Recovery Act (tracking hazardous waste)) - notification Organizations: BOB DAVIS (CONTACT/OWNER)
TOBIN BROTHERS GARAGE (15 PUMPKIN HARBOR RD in CAMBRIDGE, VT)
Conditionally Exempt Small Quantity Generators, less than 100 kg/month of hazardous waste (Resource Conservation and Recovery Act (tracking hazardous waste)) - notification Organizations: ARTHUR H & ROBIN L TOBIN (CONTACT/OWNER)
VT AOT (VT 15 in CAMBRIDGE, VT)
Conditionally Exempt Small Quantity Generators, less than 100 kg/month of hazardous waste (Resource Conservation and Recovery Act (tracking hazardous waste)) - notification Organizations: STATE OF VT (CONTACT/OWNER)
Alternative names: VT AGENCY OF TRANSPORTATION
TOWN OF CAMBRIDGE LANDFILL (ROUTE 104 in CAMBRIDGE, VT)
CRITERIA AND HAZARDOUS AIR POLLUTANT INVENTORY (Inventory of air pollution sources) Business SIC classification: REFUSE SYSTEMS Business NAICS classification: SOLID WASTE LANDFILL.
Housing units lacking complete kitchen facilities: 0.6%
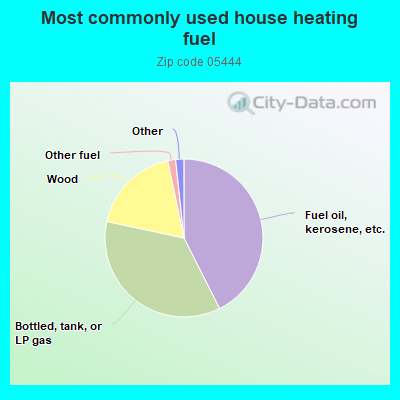
42.7%Fuel oil, kerosene, etc.
35.9%Bottled, tank, or LP gas
18.4%Wood
1.6%Other fuel
0.6%Utility gas
0.6%Electricity
Population in 1990: 3,491.
Place of birth for U.S.-born residents:
This state: 959
Northeast: 478
Midwest: 35
South: 83
West: 28
67% of the 05444 zip code residents lived in the same house 5 years ago. Out of people who lived in different houses, 23% lived in this county. Out of people who lived in different counties, 50% lived in Vermont.
97% of the 05444 zip code residents lived in the same house 1 year ago. Out of people who lived in different houses, 38% moved from this county. Out of people who lived in different houses, 62% moved from different county within same state. Out of people who lived in different houses, 2% moved from different state.
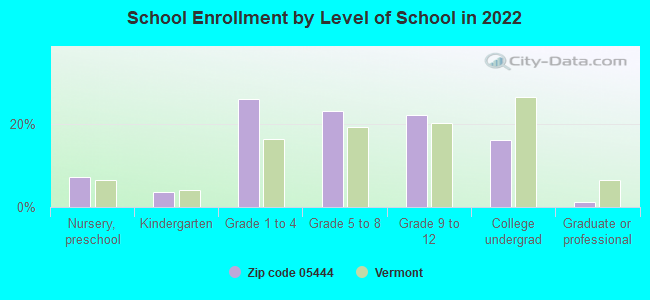
Private vs. public school enrollment:
Students in private schools in grades 1 to 8 (elementary and middle school):
Here:
0.5%
Vermont:
10.3%
Students in private schools in grades 9 to 12 (high school):
Here:
0.0%
Vermont:
11.6%
Students in private undergraduate colleges: 2
Here:
3.7%
Vermont:
29.2%
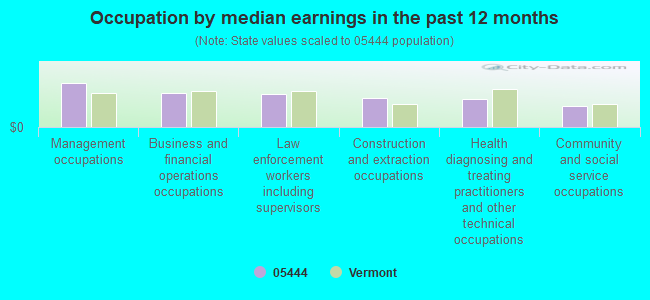
Occupation by median earnings in the past 12 months ($)
129,061Management occupations
98,572Business and financial operations occupations
95,490Law enforcement workers including supervisors
86,050Construction and extraction occupations
81,791Health diagnosing and treating practitioners and other technical occupations
61,199Community and social service occupations
Companies with federal contracts located in this zip code:
NORTHERN TELEPRESENCE CORPORAT (96 JOHN PUTNAM MEMORIAL DR in CAMBRIDGE, VT; small business) : $427,565 in 9 contractsfrom 2003 to 2006
Contracts for Communications Security Equipment and Components, Video Recording and Reproducing Equipment, Optical Instruments, Test Equipment, Components and Accessories by Army, U.S. Marshals Service, Bureau of Land Management Signed by year:2000: $0; 2001: $0; 2002: $0; 2003: $68,004; 2004: $16,180; 2005: $337,414; 2006: $5,967.
Biggest contracts:
$296,000 with Army for Communications Security Equipment and Components. Signed on 2005-06-20. Completion date: 2006-06-19.
$68,004 with U.S. Marshals Service for Video Recording and Reproducing Equipment. Signed on 2003-09-15. Completion date: 2003-12-15.
$37,000 with Army for Communications Security Equipment and Components. Signed on 2005-09-30. Completion date: 2006-06-19.
$8,080, same as above.Signed on 2004-09-29. Completion date: 2005-09-30.
DONALD LAWSON (347 POLHEMUS ROAD in CAMBRIDGE, VT; small business)
$79,970 with Navy for Other Professional Services. Signed on 1999-11-16. Completion date: 2000-10-31.
DUELMARK AEROSPACE CORPORATION (96 JOHN PUTNAM MEMORIAL in CAMBRIDGE, VT; small business)
$8,159 with Navy for Miscellaneous Electric Power and Distribution Equipment. Signed on 2005-01-27. Completion date: 2005-02-28.
Top industries in this zip code by the number of employees in 2005:
Health Care and Social Assistance: Offices of Physicians (except Mental Health Specialists) (10-19 employees: 1 establishment, 5-9 employees: 1 establishment)
Real Estate and Rental and Leasing: Residential Property Managers (10-19: 1)
Health Care and Social Assistance: Nursing Care Facilities (10-19: 1)
Construction: New Single-Family Housing Construction (except Operative Builders) (1-4: 6)
Accommodation and Food Services: Limited-Service Restaurants (5-9: 1)
People in group quarters in 2000:
5 people in other group homes
Fatal accident statistics in 2014:
Fatal accident count: 1
Vehicles involved in fatal accidents: 1
Fatal accidents caused by drunken drivers: 1
Fatalities: 1
Persons involved in fatal accidents: 1
Pedestrians involved in fatal accidents: 0
Fatal accident statistics in 2013:
Fatal accident count: 1
Vehicles involved in fatal accidents: 1
Fatal accidents caused by drunken drivers: 0
Fatalities: 1
Persons involved in fatal accidents: 2
Pedestrians involved in fatal accidents: 0
Home Mortgage Disclosure Act Aggregated Statistics For Year 2009 (Based on 2 partial tracts)
A) FHA, FSA/RHS & VA Home Purchase Loans
B) Conventional Home Purchase Loans
C) Refinancings
D) Home Improvement Loans
F) Non-occupant Loans on < 5 Family Dwellings (A B C & D)
G) Loans On Manufactured Home Dwelling (A B C & D)
Number
Average Value
Number
Average Value
Number
Average Value
Number
Average Value
Number
Average Value
Number
Average Value
LOANS ORIGINATED
7
$222,563
11
$185,789
80
$171,551
7
$71,733
1
$180,890
1
$90,590
APPLICATIONS APPROVED, NOT ACCEPTED
0
$0
2
$286,080
3
$203,433
1
$90,590
0
$0
0
$0
APPLICATIONS DENIED
2
$174,180
1
$172,240
19
$188,007
1
$64,670
0
$0
2
$87,465
APPLICATIONS WITHDRAWN
1
$117,410
1
$186,250
10
$192,150
1
$81,350
1
$104,900
0
$0
FILES CLOSED FOR INCOMPLETENESS
0
$0
0
$0
2
$146,465
0
$0
0
$0
0
$0
Aggregated Statistics For Year 2008 (Based on 2 partial tracts)
A) FHA, FSA/RHS & VA Home Purchase Loans
B) Conventional Home Purchase Loans
C) Refinancings
D) Home Improvement Loans
F) Non-occupant Loans on < 5 Family Dwellings (A B C & D)
G) Loans On Manufactured Home Dwelling (A B C & D)
Number
Average Value
Number
Average Value
Number
Average Value
Number
Average Value
Number
Average Value
Number
Average Value
LOANS ORIGINATED
2
$239,145
19
$195,629
46
$158,530
7
$34,014
2
$118,605
1
$171,950
APPLICATIONS APPROVED, NOT ACCEPTED
0
$0
2
$225,885
7
$148,744
1
$36,650
0
$0
0
$0
APPLICATIONS DENIED
0
$0
3
$187,043
15
$149,795
2
$76,585
1
$180,590
1
$51,850
APPLICATIONS WITHDRAWN
1
$190,120
4
$176,268
7
$209,451
1
$136,190
0
$0
1
$84,630
FILES CLOSED FOR INCOMPLETENESS
0
$0
1
$77,480
2
$111,450
0
$0
0
$0
0
$0
Aggregated Statistics For Year 2007 (Based on 2 partial tracts)
A) FHA, FSA/RHS & VA Home Purchase Loans
B) Conventional Home Purchase Loans
C) Refinancings
D) Home Improvement Loans
F) Non-occupant Loans on < 5 Family Dwellings (A B C & D)
G) Loans On Manufactured Home Dwelling (A B C & D)
Number
Average Value
Number
Average Value
Number
Average Value
Number
Average Value
Number
Average Value
Number
Average Value
LOANS ORIGINATED
1
$340,320
29
$184,370
40
$149,224
10
$59,213
2
$203,535
3
$78,673
APPLICATIONS APPROVED, NOT ACCEPTED
0
$0
4
$186,472
5
$141,848
2
$70,330
0
$0
0
$0
APPLICATIONS DENIED
0
$0
5
$186,488
20
$151,578
4
$75,095
0
$0
1
$146,320
APPLICATIONS WITHDRAWN
0
$0
4
$218,808
10
$158,178
0
$0
0
$0
0
$0
FILES CLOSED FOR INCOMPLETENESS
0
$0
1
$111,150
3
$138,770
1
$44,400
0
$0
0
$0
Aggregated Statistics For Year 2006 (Based on 2 partial tracts)
A) FHA, FSA/RHS & VA Home Purchase Loans
B) Conventional Home Purchase Loans
C) Refinancings
D) Home Improvement Loans
F) Non-occupant Loans on < 5 Family Dwellings (A B C & D)
G) Loans On Manufactured Home Dwelling (A B C & D)
Number
Average Value
Number
Average Value
Number
Average Value
Number
Average Value
Number
Average Value
Number
Average Value
LOANS ORIGINATED
2
$188,335
31
$169,389
39
$141,076
11
$55,835
4
$160,250
4
$93,498
APPLICATIONS APPROVED, NOT ACCEPTED
0
$0
2
$221,710
6
$140,805
3
$67,747
1
$121,290
0
$0
APPLICATIONS DENIED
0
$0
6
$169,065
20
$138,034
3
$62,877
0
$0
2
$125,755
APPLICATIONS WITHDRAWN
0
$0
4
$163,305
12
$152,054
0
$0
0
$0
0
$0
FILES CLOSED FOR INCOMPLETENESS
0
$0
0
$0
1
$39,630
1
$45,890
0
$0
0
$0
Aggregated Statistics For Year 2005 (Based on 2 partial tracts)
A) FHA, FSA/RHS & VA Home Purchase Loans
B) Conventional Home Purchase Loans
C) Refinancings
D) Home Improvement Loans
F) Non-occupant Loans on < 5 Family Dwellings (A B C & D)
G) Loans On Manufactured Home Dwelling (A B C & D)
Number
Average Value
Number
Average Value
Number
Average Value
Number
Average Value
Number
Average Value
Number
Average Value
LOANS ORIGINATED
1
$293,230
35
$162,699
50
$151,348
9
$87,480
4
$139,538
3
$105,690
APPLICATIONS APPROVED, NOT ACCEPTED
0
$0
4
$173,735
5
$122,538
1
$25,930
0
$0
1
$71,820
APPLICATIONS DENIED
0
$0
4
$176,192
18
$137,295
4
$70,105
1
$58,410
1
$171,650
APPLICATIONS WITHDRAWN
0
$0
4
$184,238
14
$127,395
1
$87,910
0
$0
1
$72,410
FILES CLOSED FOR INCOMPLETENESS
0
$0
0
$0
4
$133,505
0
$0
0
$0
0
$0
Aggregated Statistics For Year 2004 (Based on 2 partial tracts)
A) FHA, FSA/RHS & VA Home Purchase Loans
B) Conventional Home Purchase Loans
C) Refinancings
D) Home Improvement Loans
F) Non-occupant Loans on < 5 Family Dwellings (A B C & D)
G) Loans On Manufactured Home Dwelling (A B C & D)
Number
Average Value
Number
Average Value
Number
Average Value
Number
Average Value
Number
Average Value
Number
Average Value
LOANS ORIGINATED
2
$162,110
32
$148,898
54
$135,154
5
$88,208
3
$116,320
3
$82,150
APPLICATIONS APPROVED, NOT ACCEPTED
0
$0
3
$190,423
2
$165,540
1
$27,120
0
$0
0
$0
APPLICATIONS DENIED
0
$0
2
$139,015
15
$122,180
2
$36,355
0
$0
1
$72,120
APPLICATIONS WITHDRAWN
0
$0
3
$133,107
6
$132,312
1
$58,110
0
$0
1
$134,100
FILES CLOSED FOR INCOMPLETENESS
0
$0
1
$70,920
3
$142,840
2
$44,255
0
$0
0
$0
Aggregated Statistics For Year 2003 (Based on 2 partial tracts)
A) FHA, FSA/RHS & VA Home Purchase Loans
B) Conventional Home Purchase Loans
C) Refinancings
D) Home Improvement Loans
F) Non-occupant Loans on < 5 Family Dwellings (A B C & D)
Number
Average Value
Number
Average Value
Number
Average Value
Number
Average Value
Number
Average Value
LOANS ORIGINATED
1
$182,380
32
$152,716
114
$116,876
3
$25,827
3
$125,160
APPLICATIONS APPROVED, NOT ACCEPTED
0
$0
2
$120,990
5
$113,002
1
$16,090
0
$0
APPLICATIONS DENIED
0
$0
6
$103,605
15
$113,399
0
$0
1
$88,210
APPLICATIONS WITHDRAWN
0
$0
6
$139,563
5
$140,478
0
$0
0
$0
FILES CLOSED FOR INCOMPLETENESS
0
$0
1
$183,570
1
$121,580
0
$0
0
$0
Aggregated Statistics For Year 2002 (Based on 2 partial tracts)
A) FHA, FSA/RHS & VA Home Purchase Loans
B) Conventional Home Purchase Loans
C) Refinancings
D) Home Improvement Loans
F) Non-occupant Loans on < 5 Family Dwellings (A B C & D)
Number
Average Value
Number
Average Value
Number
Average Value
Number
Average Value
Number
Average Value
LOANS ORIGINATED
3
$131,817
24
$134,820
67
$109,593
1
$6,850
2
$123,670
APPLICATIONS APPROVED, NOT ACCEPTED
0
$0
2
$155,405
5
$84,454
0
$0
0
$0
APPLICATIONS DENIED
0
$0
2
$144,975
4
$95,360
1
$17,280
1
$37,550
APPLICATIONS WITHDRAWN
0
$0
1
$124,270
5
$97,684
0
$0
0
$0
FILES CLOSED FOR INCOMPLETENESS
0
$0
0
$0
0
$0
0
$0
0
$0
Aggregated Statistics For Year 2001 (Based on 2 partial tracts)
A) FHA, FSA/RHS & VA Home Purchase Loans
B) Conventional Home Purchase Loans
C) Refinancings
D) Home Improvement Loans
F) Non-occupant Loans on < 5 Family Dwellings (A B C & D)
Number
Average Value
Number
Average Value
Number
Average Value
Number
Average Value
Number
Average Value
LOANS ORIGINATED
2
$145,870
19
$122,917
60
$107,796
1
$5,960
3
$75,493
APPLICATIONS APPROVED, NOT ACCEPTED
0
$0
2
$105,790
2
$140,060
0
$0
0
$0
APPLICATIONS DENIED
0
$0
3
$107,777
10
$77,033
1
$55,130
1
$74,200
APPLICATIONS WITHDRAWN
0
$0
0
$0
7
$60,111
1
$25,330
0
$0
FILES CLOSED FOR INCOMPLETENESS
0
$0
0
$0
1
$90,590
0
$0
0
$0
Aggregated Statistics For Year 2000 (Based on 2 partial tracts)
A) FHA, FSA/RHS & VA Home Purchase Loans
B) Conventional Home Purchase Loans
C) Refinancings
D) Home Improvement Loans
F) Non-occupant Loans on < 5 Family Dwellings (A B C & D)
Number
Average Value
Number
Average Value
Number
Average Value
Number
Average Value
Number
Average Value
LOANS ORIGINATED
3
$113,737
12
$132,660
10
$97,655
1
$19,970
1
$118,310
APPLICATIONS APPROVED, NOT ACCEPTED
0
$0
2
$136,930
2
$67,645
0
$0
0
$0
APPLICATIONS DENIED
0
$0
2
$115,325
7
$63,304
1
$48,870
0
$0
APPLICATIONS WITHDRAWN
0
$0
1
$113,540
3
$92,280
0
$0
0
$0
FILES CLOSED FOR INCOMPLETENESS
0
$0
0
$0
1
$95,960
0
$0
0
$0
Aggregated Statistics For Year 1999 (Based on 1 partial tract)
Detailed PMIC statistics for the following Tracts:0110.00
2002 - 2018 National Fire Incident Reporting System (NFIRS) incidents
According to the data from the years 2002 - 2018 the average number of fire incidents per year is 9. The highest number of reported fire incidents - 23 took place in 2013, and the least - 1 in 2003. The data has an increasing trend.
When looking into fire subcategories, the most reports belonged to: Structure Fires (63.1%), and Outside Fires (20.0%).
Fire incident types reported to NFIRS in Zip Code 05444


 Nearest zip codes: 05464, 05489, 05448, 05494, 05454, 05492.


 According to the data from the years 2002 - 2018 the average number of fire incidents per year is 9. The highest number of reported fire incidents - 23 took place in 2013, and the least - 1 in 2003. The data has an increasing trend.
 When looking into fire subcategories, the most reports belonged to: Structure Fires (63.1%), and Outside Fires (20.0%).