Estimated zip code population in 2022: 1,622 Zip code population in 2010: 1,767 Zip code population in 2000: 1,852
Houses and condos: 703 Renter-occupied apartments: 44
% of renters here:
7%
State:
26%
March 2022 cost of living index in zip code 05494: 93.8 (less than average, U.S. average is 100)
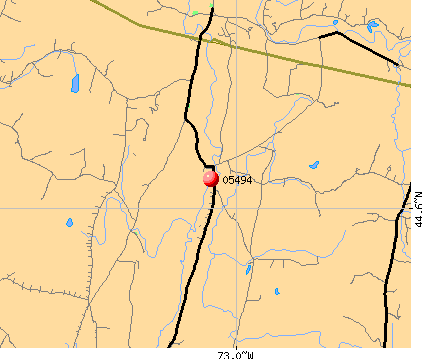
Land area: 34.2 sq. mi. Water area: 0.2 sq. mi.
Population density: 47 people per square mile
(very low).
OSM Map
Google Map
MSN Map
OSM Map
General Map
Google Map
MSN Map
OSM Map
Google Map
MSN Map
OSM Map
Google Map
MSN Map
Please wait while loading the map...
Real estate property taxes paid for housing units in 2022:
This zip code:
1.7% ($6,487)
Vermont:
1.6% ($4,787)
Median real estate property taxes paid for housing units with mortgages in 2022: $6,142 (1.7%) Median real estate property taxes paid for housing units with no mortgage in 2022: $7,395 (1.6%)
Business Search- 14 Million verified businesses
Males: 855
(52.8%)
Females: 765
(47.2%)
For population 25 years and over in 05494:
High school or higher: 100.3%
Bachelor's degree or higher: 50.4%
Graduate or professional degree: 17.8%
Unemployed: 2.9%
Mean travel time to work (commute): 33.3 minutes
For population 15 years and over in 05494:
Never married: 19.0%
Now married: 69.4%
Separated: 0.0%
Widowed: 2.5%
Divorced: 9.1%
Zip code 05494 compared to state average:
Black race population percentage significantly below state average.
Hispanic race population percentage above state average.
Foreign-born population percentage significantly below state average.
Renting percentage significantly below state average.
Length of stay since moving in significantly above state average.
Estimated median house/condo value in 2022: $391,054
05494:
$391,054
Vermont:
$304,700
According to our research of Vermont and other state lists, there were 3 registered sex offenders living in 05494 zip code as of May 23, 2024. The ratio of all residents to sex offenders in zip code 05494 is 584 to 1. The ratio of registered sex offenders to all residents in this zip code is lower than the state average.
Median resident age:
This zip code:
45.7 years
Vermont median age:
43.2 years
Average household size:
This zip code:
2.5 people
Vermont:
2.2 people
Averages for the 2020 tax year for zip code 05494, filed in 2021:
Average Adjusted Gross Income (AGI) in 2020: $83,918 (Individual Income Tax Returns)
Here:
$83,918
State:
$70,107
Salary/wage: $70,124 (reported on 85.4% of returns)
Here:
$70,124
State:
$56,381
(% of AGI for various income ranges: 1338.5% for AGIs below $25k, 3641.5% for AGIs $25k-50k, 6632.7% for AGIs $50k-75k, 9814.3% for AGIs $75k-100k, 15967.5% for AGIs $100k-200k)
Taxable interest for individuals: $918 (reported on 45.8% of returns)
This zip code:
$918
Vermont:
$1,276
(% of AGI for various income ranges: 13.8% for AGIs below $25k, 45.4% for AGIs $25k-50k, 42.7% for AGIs $50k-75k, 58.6% for AGIs $75k-100k, 88.1% for AGIs $100k-200k)
Ordinary dividends: $4,567 (reported on 31.2% of returns)
Here:
$4,567
State:
$8,930
(% of AGI for various income ranges: 37.7% for AGIs below $25k, 65.4% for AGIs $25k-50k, 107.3% for AGIs $50k-75k, 155.7% for AGIs $75k-100k, 298.8% for AGIs $100k-200k)
Net capital gain/loss in AGI: +$6,476 (reported on 26.0% of returns)
Here:
+$6,476
State:
+$19,777
(% of AGI for various income ranges: 27.7% for AGIs below $25k, 41.5% for AGIs $25k-50k, 270.9% for AGIs $50k-75k, 37.1% for AGIs $75k-100k, 476.9% for AGIs $100k-200k)
Profit/loss from business: +$14,139 (reported on 18.8% of returns)
Here:
+$14,139
State:
+$15,467
(% of AGI for various income ranges: 91.5% for AGIs below $25k, 128.5% for AGIs $25k-50k, 519.1% for AGIs $50k-75k, 707.1% for AGIs $75k-100k, 745.6% for AGIs $100k-200k)
Taxable individual retirement arrangement distribution: $13,900 (reported on 12.5% of returns)
05494:
$13,900
Vermont:
$17,245
(% of AGI for various income ranges: 246.9% for AGIs below $25k, 361.8% for AGIs $50k-75k, 593.1% for AGIs $100k-200k)
Total itemized deductions: $24,244 (reported on 9.4% of returns)
Here:
$24,244
State:
$33,390
(% of AGI for various income ranges: 844.5% for AGIs $50k-75k, 783.1% for AGIs $100k-200k)
Charity contributions: $4,100 (reported on 5.2% of returns)
Here:
$4,100
State:
$11,950
(% of AGI for various income ranges: 128.1% for AGIs $100k-200k)
Taxes paid: $8,589 (reported on 9.4% of returns)
05494:
$8,589
State:
$8,349
(% of AGI for various income ranges: 325.5% for AGIs $50k-75k, 259.4% for AGIs $100k-200k)
Earned income credit: $1,467 (reported on 6.2% of returns)
Here:
$1,467
State:
$1,839
(% of AGI for various income ranges: 20.8% for AGIs below $25k, 46.9% for AGIs $25k-50k)
Percentage of individuals using paid preparers for their 2020 taxes: 91.7%
Here:
92%
State:
93%
(% for various income ranges: 90.9% for AGIs below $25k, 88.9% for AGIs $25k-50k, 88.2% for AGIs $50k-75k, 90.0% for AGIs $75k-100k, 95.8% for AGIs $100k-200k, 100.0% for AGIs over 200k)
Averages for the 2012 tax year for zip code 05494, filed in 2013:
Average Adjusted Gross Income (AGI) in 2012: $63,761 (Individual Income Tax Returns)
Here:
$63,761
State:
$55,225
Salary/wage: $55,206 (reported on 87.0% of returns)
Here:
$55,206
State:
$44,925
(% of AGI for various income ranges: 74.2% for AGIs below $25k, 80.3% for AGIs $25k-50k, 74.7% for AGIs $50k-75k, 82.8% for AGIs $75k-100k, 83.7% for AGIs $100k-200k, 52.6% for AGIs over 200k)
Taxable interest for individuals: $933 (reported on 42.4% of returns)
This zip code:
$933
Vermont:
$1,237
(% of AGI for various income ranges: 1.9% for AGIs below $25k, 0.3% for AGIs $25k-50k, 0.5% for AGIs $50k-75k, 0.6% for AGIs $75k-100k, 0.2% for AGIs $100k-200k, 1.2% for AGIs over 200k)
Ordinary dividends: $2,623 (reported on 28.3% of returns)
Here:
$2,623
State:
$7,010
(% of AGI for various income ranges: 1.7% for AGIs below $25k, 1.3% for AGIs $25k-50k, 1.9% for AGIs $50k-75k, 1.3% for AGIs $75k-100k, 1.3% for AGIs $100k-200k)
Net capital gain/loss in AGI: +$1,056 (reported on 17.4% of returns)
Here:
+$1,056
State:
+$13,197
(% of AGI for various income ranges: 1.1% for AGIs $100k-200k)
Profit/loss from business: +$17,174 (reported on 20.7% of returns)
Here:
+$17,174
State:
+$12,941
(% of AGI for various income ranges: 8.8% for AGIs below $25k, 5.6% for AGIs $25k-50k, 8.6% for AGIs $50k-75k, 4.6% for AGIs $75k-100k, 7.7% for AGIs $100k-200k)
Taxable individual retirement arrangement distribution: $10,000 (reported on 8.7% of returns)
05494:
$10,000
Vermont:
$12,934
Total itemized deductions: $20,800 (19% of AGI, reported on 41.3% of returns)
Here:
$20,800
State:
$22,572
Here:
18.7% of AGI
State:
19.9% of AGI
(% of AGI for various income ranges: 8.5% for AGIs below $25k, 9.7% for AGIs $25k-50k, 13.3% for AGIs $50k-75k, 14.1% for AGIs $75k-100k, 15.5% for AGIs $100k-200k, 13.3% for AGIs over 200k)
Charity contributions: $2,207 (reported on 32.6% of returns)
Here:
$2,207
State:
$3,170
(% of AGI for various income ranges: 0.5% for AGIs $25k-50k, 0.6% for AGIs $50k-75k, 1.2% for AGIs $75k-100k, 1.6% for AGIs $100k-200k, 1.3% for AGIs over 200k)
Taxes paid: $9,711 (reported on 41.3% of returns)
05494:
$9,711
State:
$10,425
(% of AGI for various income ranges: 1.8% for AGIs below $25k, 3.1% for AGIs $25k-50k, 5.0% for AGIs $50k-75k, 5.5% for AGIs $75k-100k, 8.1% for AGIs $100k-200k, 8.1% for AGIs over 200k)
Earned income credit: $1,514 (reported on 7.6% of returns)
Here:
$1,514
State:
$1,828
(% of AGI for various income ranges: 2.2% for AGIs below $25k, 0.6% for AGIs $25k-50k)
Percentage of individuals using paid preparers for their 2012 taxes: 44.6%
Here:
45%
State:
49%
(% for various income ranges: 40.0% for AGIs below $25k, 44.4% for AGIs $25k-50k, 50.0% for AGIs $50k-75k, 38.5% for AGIs $75k-100k, 50.0% for AGIs $100k-200k, 66.7% for AGIs over 200k)
Averages for the 2004 tax year for zip code 05494, filed in 2005:
Average Adjusted Gross Income (AGI) in 2004: $51,386 (Individual Income Tax Returns)
Here:
$51,386
State:
$44,564
Salary/wage: $46,047 (reported on 89.8% of returns)
Here:
$46,047
State:
$37,522
(% of AGI for various income ranges: 97.1% for AGIs below $10k, 75.2% for AGIs $10k-25k, 83.9% for AGIs $25k-50k, 83.9% for AGIs $50k-75k, 86.9% for AGIs $75k-100k, 72.4% for AGIs over 100k)
Taxable interest for individuals: $562 (reported on 57.4% of returns)
This zip code:
$562
Vermont:
$1,373
(% of AGI for various income ranges: 3.8% for AGIs below $10k, 1.5% for AGIs $10k-25k, 0.7% for AGIs $25k-50k, 0.7% for AGIs $50k-75k, 0.3% for AGIs $75k-100k, 0.5% for AGIs over 100k)
Taxable dividends: $1,222 (reported on 31.9% of returns)
Here:
$1,222
State:
$4,037
(% of AGI for various income ranges: 2.4% for AGIs below $10k, 0.8% for AGIs $10k-25k, 0.9% for AGIs $25k-50k, 0.6% for AGIs $50k-75k, 0.6% for AGIs $75k-100k, 0.9% for AGIs over 100k)
Net capital gain/loss: +$5,389 (reported on 22.8% of returns)
Here:
+$5,389
State:
+$11,311
(% of AGI for various income ranges: -0.1% for AGIs $10k-25k, -0.1% for AGIs $25k-50k, 1.1% for AGIs $50k-75k, 1.5% for AGIs $75k-100k, 5.4% for AGIs over 100k)
Profit/loss from business: +$7,366 (reported on 19.3% of returns)
Here:
+$7,366
State:
+$11,197
(% of AGI for various income ranges: 14.0% for AGIs below $10k, 9.4% for AGIs $10k-25k, 6.7% for AGIs $25k-50k, 5.1% for AGIs $50k-75k, -0.4% for AGIs $75k-100k, 0.3% for AGIs over 100k)
IRA payment deduction: $3,341 (reported on 5.3% of returns)
05494:
$3,341
Vermont:
$3,004
Total itemized deductions: $16,185 (19% of AGI, reported on 46.0% of returns)
Here:
$16,185
State:
$17,791
Here:
19.3% of AGI
State:
20.0% of AGI
(% of AGI for various income ranges: 13.2% for AGIs $10k-25k, 13.7% for AGIs $25k-50k, 13.9% for AGIs $50k-75k, 16.4% for AGIs $75k-100k, 14.7% for AGIs over 100k)
Charity contributions deductions: $1,848 (2% of AGI, reported on 38.7% of returns)
Here:
$1,848
State:
$2,686
Here:
2.1% of AGI
State:
2.8% of AGI
(% of AGI for various income ranges: 1.1% for AGIs $10k-25k, 0.9% for AGIs $25k-50k, 0.7% for AGIs $50k-75k, 1.6% for AGIs $75k-100k, 2.0% for AGIs over 100k)
Total tax: $6,903 (reported on 83.0% of returns)
05494:
$6,903
State:
$6,533
(% of AGI for various income ranges: 3.5% for AGIs below $10k, 6.1% for AGIs $10k-25k, 7.6% for AGIs $25k-50k, 9.2% for AGIs $50k-75k, 9.9% for AGIs $75k-100k, 16.0% for AGIs over 100k)
Earned income credit: $1,649 (reported on 6.8% of returns)
Here:
$1,649
State:
$1,432
Percentage of individuals using paid preparers for their 2004 taxes: 42.0%
Here:
42%
State:
54%
(% for various income ranges: 34.5% for AGIs below $10k, 42.8% for AGIs $10k-25k, 45.5% for AGIs $25k-50k, 40.0% for AGIs $50k-75k, 41.7% for AGIs $75k-100k, 51.1% for AGIs over 100k)
Household received Food Stamps/SNAP in the past 12 months: 31 Household did not receive Food Stamps/SNAP in the past 12 months: 627
Women who had a birth in the past 12 months: 32 (31 now married, 0 unmarried) Women who did not have a birth in the past 12 months: 245 (167 now married, 81 unmarried)
Housing units in zip code 05494 with a mortgage: 437 (95 second mortgage, 88 both second mortgage and home equity loan) Houses without a mortgage: 18
Median monthly owner costs for units with a mortgage: $2,060 Median monthly owner costs for units without a mortgage: $1,080
Residents with income below the poverty level in 2022:
This zip code:
1.8%
Whole state:
10.4%
Residents with income below 50% of the poverty level in 2022:
This zip code:
0.9%
Whole state:
6.1%
Median number of rooms in houses and condos:
Here:
6.3
State:
6.4
Median number of rooms in apartments:
Here:
4.3
State:
3.9
Notable locations in this zip code not listed on our city pages
Cemeteries: Pleasant View Cemetery (1), Osgood Hill Cemetery (2), Westford Plains Cemetery (3), Brookside Cemetery (4). Display/hide their locations on the map
Size of family households: 244 2-persons, 146 3-persons, 91 4-persons, 41 5-persons, 1 7-or-more-persons
Size of nonfamily households: 93 1-person, 44 2-persons
223 married couples with children.
61 single-parent households (54 men, 7 women).
98.4% of residents of 05494 zip code speak English at home.
1.1% of residents speak other Indo-European language at home (71% very well, 29% well).
0.3% of residents speak Asian or Pacific Island language at home (100% very well).
Foreign born population: 14 (0.9%) (43.5% of them are naturalized citizens)
This zip code:
0.9%
Whole state:
4.2%
31%France
19%Sweden
16%English
14%French Canadian
8%German
8%Italian
7%European
6%Irish
5%American
Year of entry for the foreign-born population
82010 or later
02000 to 2009
01990 to 1999
22Before 1990
Facilities with environmental interests located in this zip code:
WESTFORD ELEMENTARY SCHOOL (146 BROOKSIDE ROAD in WESTFORD, VT)
(Geographic Names Information System) (National Center for Education Statistics) - STATE ID-PS333
Conditionally Exempt Small Quantity Generators, less than 100 kg/month of hazardous waste (Resource Conservation and Recovery Act (tracking hazardous waste)) Business NAICS classification: SOLID WASTE COLLECTION. Organizations: CHITTENDEN SOLID WASTE DIST (CONTACT/OPERATOR)
, TOWN OF WESTFORD (CONTACT/OWNER)
MATHIEU ENTERPRISES INC (2116 VT RTE 128 in WESTFORD, VT)
Conditionally Exempt Small Quantity Generators, less than 100 kg/month of hazardous waste (Resource Conservation and Recovery Act (tracking hazardous waste)) Business NAICS classification: GENERAL AUTOMOTIVE REPAIR. Organizations: RICHARD MATHIEU (CONTACT/OPERATOR)
WESTFORD HWY DEPT (35 CAMBRIDGE RD in WESTFORD, VT)
Conditionally Exempt Small Quantity Generators, less than 100 kg/month of hazardous waste (Resource Conservation and Recovery Act (tracking hazardous waste)) - notification USED OIL PROGRAM (Resource Conservation and Recovery Act (tracking hazardous waste)) Organizations: TOWN OF WESTFORD (CONTACT/OWNER)
ROVERS NORTH (1319 RTE 128 in WESTFORD, VT)
Conditionally Exempt Small Quantity Generators, less than 100 kg/month of hazardous waste (Resource Conservation and Recovery Act (tracking hazardous waste)) - notification Organizations: MARK & ANDREA LETORNEY (CONTACT/OWNER)
WESTFORD ELEMENTRY SCHOOL (MAIN STREET in WESTFORD, VT)
COMPLIANCE ACTIVITY (Tracking inspections of insecticide, fungicide, and rodenticide, and toxic substances)
Housing units lacking complete plumbing facilities: 2.5% Housing units lacking complete kitchen facilities: 2.8%
35.7%Fuel oil, kerosene, etc.
33.6%Bottled, tank, or LP gas
26.3%Wood
3.6%Other fuel
0.8%Solar energy
Population in 1990: 1,102. Population change in the 1990s: +750 (+68.1%).
Place of birth for U.S.-born residents:
This state: 747
Northeast: 577
Midwest: 102
South: 109
West: 59
70% of the 05494 zip code residents lived in the same house 5 years ago. Out of people who lived in different houses, 55% lived in this county. Out of people who lived in different counties, 50% lived in Vermont.
95% of the 05494 zip code residents lived in the same house 1 year ago. Out of people who lived in different houses, 57% moved from this county. Out of people who lived in different houses, 37% moved from different state. Out of people who lived in different houses, 11% moved from abroad.
Private vs. public school enrollment:
Students in private schools in grades 1 to 8 (elementary and middle school): 5
Here:
4.6%
Vermont:
10.3%
Students in private schools in grades 9 to 12 (high school):
Here:
0.0%
Vermont:
11.6%
Students in private undergraduate colleges: 11
Here:
24.1%
Vermont:
29.2%
Occupation by median earnings in the past 12 months ($)
137,068Architecture and engineering occupations
115,122Health diagnosing and treating practitioners and other technical occupations
105,413Life, physical, and social science occupations
103,124Management occupations
92,496Business and financial operations occupations
68,520Legal occupations
Companies with federal contracts located in this zip code:
ROBERT D SWEET (87 ROLLIN IRISH ROAD in WESTFORD, VT; small business) : $13,520 in 4 contractsfrom 2001 to 2003
$7,800 with Army for Custodial Janitorial Services. Signed on 2001-12-04. Completion date: 2002-12-31.
$6,240, same as above.Signed on 2003-01-30. Completion date: 2003-12-31.
$0, same as above.Signed on 2001-12-04. Completion date: 2002-12-31.
-$520, same as above.Signed on 2003-11-25. Completion date: 2003-12-31.
COBB, MAX, OWNER (22 BROOKSIDE RD in WESTFORD, VT; small business) : $11,777 in 2 contractsfrom 2003 to 2004
$7,030 with Army for Athletic and Sporting Equipment. Signed on 2003-08-08. Completion date: 2003-08-29.
$4,747 with Army for Preservative and Sealing Compounds. Signed on 2004-09-02. Completion date: 2004-10-29.
Top industries in this zip code by the number of employees in 2005:
Construction: New Single-Family Housing Construction (except Operative Builders) (5-9 employees: 1 establishment, 1-4 employees: 2 establishments)
Construction: Roofing Contractors (5-9: 1)
Professional, Scientific, and Technical Services: Engineering Services (5-9: 1)
Construction: Residential Remodelers (1-4: 3)
Real Estate and Rental and Leasing: Offices of Real Estate Appraisers (1-4: 2)
Construction: Plumbing, Heating, and Air-Conditioning Contractors (1-4: 2)
Professional, Scientific, and Technical Services: Tax Preparation Services (1-4: 1)
Home Mortgage Disclosure Act Aggregated Statistics For Year 2009 (Based on 2 partial tracts)
A) FHA, FSA/RHS & VA Home Purchase Loans
B) Conventional Home Purchase Loans
C) Refinancings
D) Home Improvement Loans
F) Non-occupant Loans on < 5 Family Dwellings (A B C & D)
G) Loans On Manufactured Home Dwelling (A B C & D)
Number
Average Value
Number
Average Value
Number
Average Value
Number
Average Value
Number
Average Value
Number
Average Value
LOANS ORIGINATED
11
$200,198
20
$219,682
181
$194,868
11
$90,641
5
$252,144
2
$106,335
APPLICATIONS APPROVED, NOT ACCEPTED
0
$0
1
$212,670
8
$204,128
2
$93,585
1
$96,900
1
$15,810
APPLICATIONS DENIED
3
$176,120
3
$90,270
33
$198,375
3
$43,180
2
$136,935
4
$85,425
APPLICATIONS WITHDRAWN
1
$118,320
1
$249,390
14
$207,169
2
$83,640
1
$96,900
0
$0
FILES CLOSED FOR INCOMPLETENESS
0
$0
1
$96,900
7
$188,627
0
$0
0
$0
0
$0
Aggregated Statistics For Year 2008 (Based on 2 partial tracts)
A) FHA, FSA/RHS & VA Home Purchase Loans
B) Conventional Home Purchase Loans
C) Refinancings
D) Home Improvement Loans
F) Non-occupant Loans on < 5 Family Dwellings (A B C & D)
G) Loans On Manufactured Home Dwelling (A B C & D)
Number
Average Value
Number
Average Value
Number
Average Value
Number
Average Value
Number
Average Value
Number
Average Value
LOANS ORIGINATED
5
$195,024
28
$195,494
81
$184,104
10
$100,674
8
$185,640
4
$51,128
APPLICATIONS APPROVED, NOT ACCEPTED
1
$80,580
4
$166,642
13
$156,884
3
$104,040
3
$163,880
0
$0
APPLICATIONS DENIED
1
$53,550
6
$254,150
24
$197,838
4
$20,528
1
$39,270
2
$82,110
APPLICATIONS WITHDRAWN
1
$67,830
5
$142,086
12
$201,280
1
$182,580
1
$103,530
1
$39,270
FILES CLOSED FOR INCOMPLETENESS
1
$118,320
1
$274,380
5
$111,894
2
$12,750
0
$0
1
$7,650
Aggregated Statistics For Year 2007 (Based on 2 partial tracts)
A) FHA, FSA/RHS & VA Home Purchase Loans
B) Conventional Home Purchase Loans
C) Refinancings
D) Home Improvement Loans
F) Non-occupant Loans on < 5 Family Dwellings (A B C & D)
G) Loans On Manufactured Home Dwelling (A B C & D)
Number
Average Value
Number
Average Value
Number
Average Value
Number
Average Value
Number
Average Value
Number
Average Value
LOANS ORIGINATED
3
$150,620
49
$201,554
86
$170,589
22
$91,684
8
$206,231
4
$55,590
APPLICATIONS APPROVED, NOT ACCEPTED
0
$0
13
$206,354
13
$179,677
1
$71,400
2
$302,685
2
$60,180
APPLICATIONS DENIED
0
$0
9
$147,503
15
$158,372
5
$78,744
2
$128,265
3
$86,700
APPLICATIONS WITHDRAWN
0
$0
7
$189,283
17
$167,850
1
$55,080
1
$40,290
1
$71,400
FILES CLOSED FOR INCOMPLETENESS
0
$0
1
$112,200
6
$176,630
0
$0
1
$192,270
0
$0
Aggregated Statistics For Year 2006 (Based on 2 partial tracts)
A) FHA, FSA/RHS & VA Home Purchase Loans
B) Conventional Home Purchase Loans
C) Refinancings
D) Home Improvement Loans
F) Non-occupant Loans on < 5 Family Dwellings (A B C & D)
G) Loans On Manufactured Home Dwelling (A B C & D)
Number
Average Value
Number
Average Value
Number
Average Value
Number
Average Value
Number
Average Value
Number
Average Value
LOANS ORIGINATED
2
$142,545
60
$166,830
80
$176,772
22
$83,524
10
$138,363
4
$108,502
APPLICATIONS APPROVED, NOT ACCEPTED
0
$0
6
$186,150
8
$131,899
1
$21,420
1
$84,660
0
$0
APPLICATIONS DENIED
0
$0
7
$123,784
25
$169,218
5
$64,668
4
$170,978
3
$100,470
APPLICATIONS WITHDRAWN
1
$94,350
3
$188,530
16
$169,224
2
$117,045
1
$77,010
1
$75,480
FILES CLOSED FOR INCOMPLETENESS
0
$0
2
$57,630
6
$127,245
0
$0
0
$0
0
$0
Aggregated Statistics For Year 2005 (Based on 2 partial tracts)
A) FHA, FSA/RHS & VA Home Purchase Loans
B) Conventional Home Purchase Loans
C) Refinancings
D) Home Improvement Loans
F) Non-occupant Loans on < 5 Family Dwellings (A B C & D)
G) Loans On Manufactured Home Dwelling (A B C & D)
Number
Average Value
Number
Average Value
Number
Average Value
Number
Average Value
Number
Average Value
Number
Average Value
LOANS ORIGINATED
2
$201,960
62
$158,585
87
$160,568
19
$115,851
11
$141,965
5
$71,808
APPLICATIONS APPROVED, NOT ACCEPTED
0
$0
8
$172,635
7
$118,611
2
$87,720
1
$117,300
0
$0
APPLICATIONS DENIED
1
$86,190
9
$108,970
28
$167,207
4
$91,800
1
$139,740
1
$114,750
APPLICATIONS WITHDRAWN
0
$0
9
$134,923
22
$173,910
2
$136,425
2
$62,985
2
$125,715
FILES CLOSED FOR INCOMPLETENESS
0
$0
2
$84,405
9
$179,237
0
$0
1
$54,060
1
$115,770
Aggregated Statistics For Year 2004 (Based on 2 partial tracts)
A) FHA, FSA/RHS & VA Home Purchase Loans
B) Conventional Home Purchase Loans
C) Refinancings
D) Home Improvement Loans
E) Loans on Dwellings For 5+ Families
F) Non-occupant Loans on < 5 Family Dwellings (A B C & D)
G) Loans On Manufactured Home Dwelling (A B C & D)
Number
Average Value
Number
Average Value
Number
Average Value
Number
Average Value
Number
Average Value
Number
Average Value
Number
Average Value
LOANS ORIGINATED
2
$157,590
72
$160,480
128
$148,896
13
$95,213
1
$35,700
14
$138,064
5
$91,086
APPLICATIONS APPROVED, NOT ACCEPTED
0
$0
5
$181,764
10
$134,028
3
$114,750
0
$0
2
$74,715
1
$40,290
APPLICATIONS DENIED
1
$115,770
7
$159,921
28
$111,380
6
$43,095
0
$0
2
$99,705
2
$29,580
APPLICATIONS WITHDRAWN
0
$0
8
$185,321
20
$141,754
3
$38,590
0
$0
1
$125,970
0
$0
FILES CLOSED FOR INCOMPLETENESS
0
$0
1
$151,980
10
$149,022
2
$47,175
0
$0
0
$0
0
$0
Aggregated Statistics For Year 2002 (Based on 2 partial tracts)
B) Conventional Home Purchase Loans
C) Refinancings
D) Home Improvement Loans
F) Non-occupant Loans on < 5 Family Dwellings (A B C & D)
Number
Average Value
Number
Average Value
Number
Average Value
Number
Average Value
LOANS ORIGINATED
9
$135,830
30
$128,197
1
$63,750
1
$133,110
APPLICATIONS APPROVED, NOT ACCEPTED
0
$0
1
$71,910
0
$0
0
$0
APPLICATIONS DENIED
1
$112,710
0
$0
0
$0
0
$0
APPLICATIONS WITHDRAWN
1
$100,980
1
$66,300
0
$0
0
$0
FILES CLOSED FOR INCOMPLETENESS
0
$0
0
$0
0
$0
0
$0
Aggregated Statistics For Year 2001 (Based on 2 partial tracts)
A) FHA, FSA/RHS & VA Home Purchase Loans
B) Conventional Home Purchase Loans
C) Refinancings
D) Home Improvement Loans
F) Non-occupant Loans on < 5 Family Dwellings (A B C & D)
Number
Average Value
Number
Average Value
Number
Average Value
Number
Average Value
Number
Average Value
LOANS ORIGINATED
1
$56,100
4
$153,255
16
$136,680
1
$17,850
0
$0
APPLICATIONS APPROVED, NOT ACCEPTED
0
$0
0
$0
1
$29,070
0
$0
0
$0
APPLICATIONS DENIED
1
$38,250
3
$77,860
3
$152,150
0
$0
0
$0
APPLICATIONS WITHDRAWN
0
$0
0
$0
1
$122,910
0
$0
1
$39,780
FILES CLOSED FOR INCOMPLETENESS
0
$0
0
$0
1
$51,000
0
$0
0
$0
Aggregated Statistics For Year 2000 (Based on 2 partial tracts)
A) FHA, FSA/RHS & VA Home Purchase Loans
B) Conventional Home Purchase Loans
C) Refinancings
F) Non-occupant Loans on < 5 Family Dwellings (A B C & D)
Number
Average Value
Number
Average Value
Number
Average Value
Number
Average Value
LOANS ORIGINATED
3
$113,220
13
$109,375
5
$128,112
1
$30,600
APPLICATIONS APPROVED, NOT ACCEPTED
0
$0
0
$0
1
$84,660
0
$0
APPLICATIONS DENIED
1
$41,820
1
$115,260
2
$78,030
0
$0
APPLICATIONS WITHDRAWN
1
$73,950
0
$0
0
$0
0
$0
FILES CLOSED FOR INCOMPLETENESS
0
$0
0
$0
1
$65,280
0
$0
Aggregated Statistics For Year 1999 (Based on 1 partial tract)
Detailed PMIC statistics for the following Tracts:0029.00
2002 - 2018 National Fire Incident Reporting System (NFIRS) incidents
According to the data from the years 2002 - 2018 the average number of fire incidents per year is 12. The highest number of reported fire incidents - 27 took place in 2005, and the least - 3 in 2006. The data has a decreasing trend.
When looking into fire subcategories, the most reports belonged to: Structure Fires (59.4%), and Outside Fires (24.9%).
Fire incident types reported to NFIRS in Zip Code 05494


 Nearest zip codes: 05452, 05454, 05489, 05444, 05465, 05468.


 According to the data from the years 2002 - 2018 the average number of fire incidents per year is 12. The highest number of reported fire incidents - 27 took place in 2005, and the least - 3 in 2006. The data has a decreasing trend.
 When looking into fire subcategories, the most reports belonged to: Structure Fires (59.4%), and Outside Fires (24.9%).