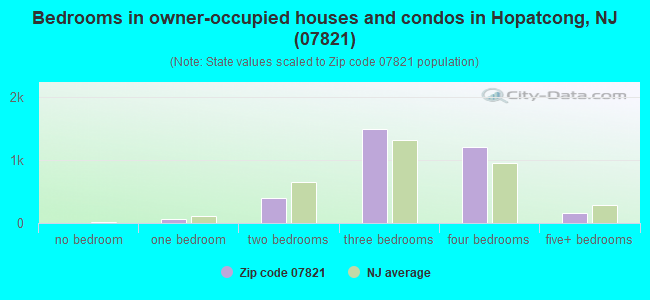
Estimated zip code population in 2022: 9,584 Zip code population in 2010: 9,193 Zip code population in 2000: 8,654
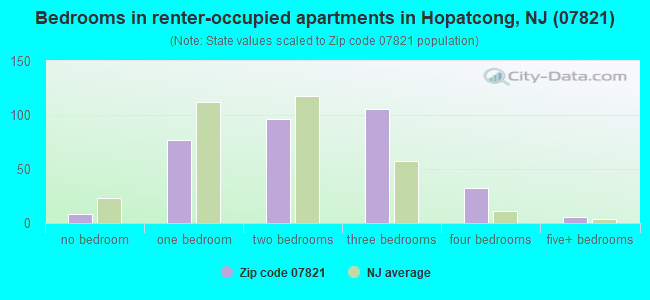
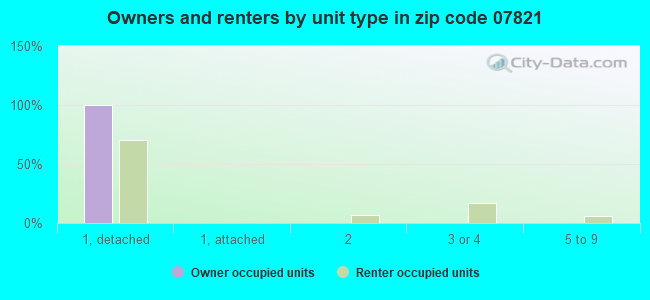
Houses and condos: 3,922 Renter-occupied apartments: 330
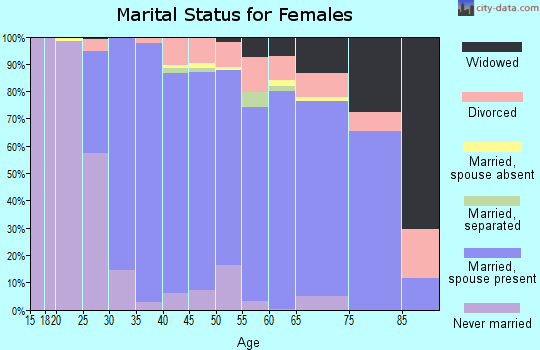
% of renters here:
9%
State:
35%
March 2022 cost of living index in zip code 07821: 110.9 (more than average, U.S. average is 100)
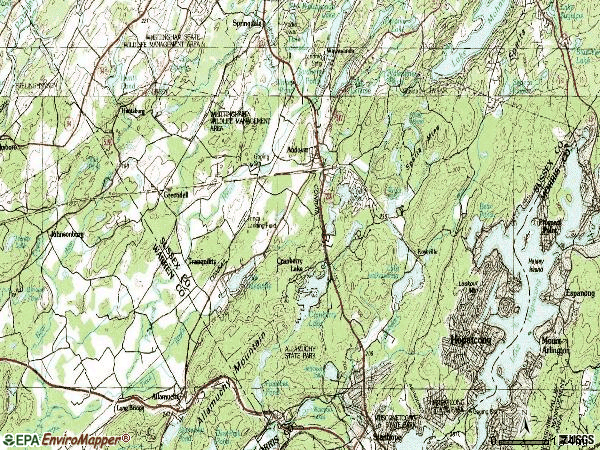
Land area: 43.3 sq. mi. Water area: 1.5 sq. mi.
Population density: 222 people per square mile
(very low).
OSM Map
Google Map
MSN Map
OSM Map
General Map
Google Map
MSN Map
OSM Map
Google Map
MSN Map
OSM Map
Google Map
MSN Map
Please wait while loading the map...
Real estate property taxes paid for housing units in 2022:
This zip code:
2.3% ($9,521)
New Jersey:
2.1% ($8,897)
Median real estate property taxes paid for housing units with mortgages in 2022: $9,557 (2.3%) Median real estate property taxes paid for housing units with no mortgage in 2022: $8,982 (2.4%)
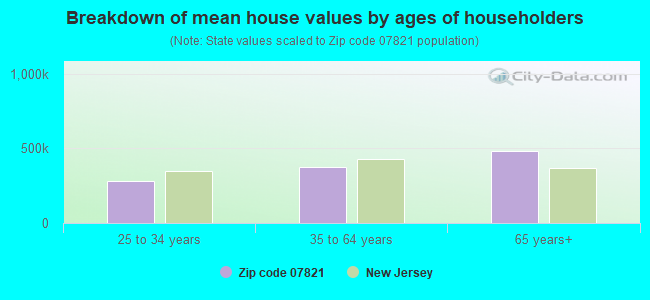
Estimated median house/condo value in 2022: $406,354
07821:
$406,354
New Jersey:
$428,900
According to our research of New Jersey and other state lists, there were 6 registered sex offenders living in 07821 zip code as of May 28, 2024. The ratio of all residents to sex offenders in zip code 07821 is 1,601 to 1. The ratio of registered sex offenders to all residents in this zip code is near the state average.
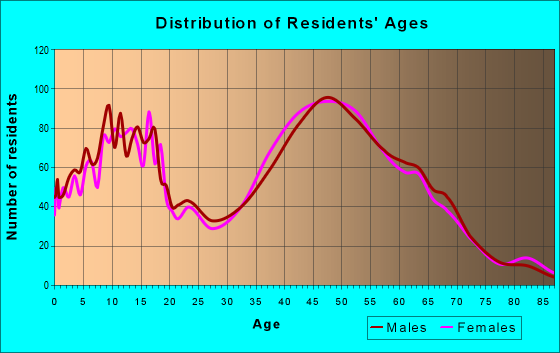
Median resident age:
This zip code:
42.3 years
New Jersey median age:
40.4 years
Average household size:
This zip code:
2.6 people
New Jersey:
2.6 people
Averages for the 2020 tax year for zip code 07821, filed in 2021:
Average Adjusted Gross Income (AGI) in 2020: $103,760 (Individual Income Tax Returns)
Here:
$103,760
State:
$95,247
Salary/wage: $88,123 (reported on 83.0% of returns)
Here:
$88,123
State:
$80,635
(% of AGI for various income ranges: 1190.3% for AGIs below $25k, 3868.1% for AGIs $25k-50k, 6275.7% for AGIs $50k-75k, 9797.9% for AGIs $75k-100k, 18943.0% for AGIs $100k-200k, 77601.9% for AGIs over 200k)
Taxable interest for individuals: $1,342 (reported on 38.5% of returns)
This zip code:
$1,342
New Jersey:
$2,414
(% of AGI for various income ranges: 24.7% for AGIs below $25k, 44.4% for AGIs $25k-50k, 64.8% for AGIs $50k-75k, 107.9% for AGIs $75k-100k, 106.4% for AGIs $100k-200k, 430.6% for AGIs over 200k)
Ordinary dividends: $4,716 (reported on 31.0% of returns)
Here:
$4,716
State:
$8,057
(% of AGI for various income ranges: 51.0% for AGIs below $25k, 81.9% for AGIs $25k-50k, 113.1% for AGIs $50k-75k, 136.8% for AGIs $75k-100k, 337.6% for AGIs $100k-200k, 1742.5% for AGIs over 200k)
Net capital gain/loss in AGI: +$11,124 (reported on 26.1% of returns)
Here:
+$11,124
State:
+$25,022
(% of AGI for various income ranges: 22.4% for AGIs below $25k, 57.3% for AGIs $25k-50k, 83.8% for AGIs $50k-75k, 161.8% for AGIs $75k-100k, 423.7% for AGIs $100k-200k, 5671.9% for AGIs over 200k)
Profit/loss from business: +$21,545 (reported on 16.6% of returns)
Here:
+$21,545
State:
+$18,035
(% of AGI for various income ranges: 158.8% for AGIs below $25k, 258.8% for AGIs $25k-50k, 301.7% for AGIs $50k-75k, 449.3% for AGIs $75k-100k, 710.7% for AGIs $100k-200k, 4183.1% for AGIs over 200k)
Taxable individual retirement arrangement distribution: $24,506 (reported on 11.1% of returns)
07821:
$24,506
New Jersey:
$21,558
(% of AGI for various income ranges: 118.6% for AGIs below $25k, 179.0% for AGIs $25k-50k, 326.0% for AGIs $50k-75k, 424.3% for AGIs $75k-100k, 572.4% for AGIs $100k-200k, 2688.8% for AGIs over 200k)
Self-employed (Keogh) retirement plans: $20,780 (reported on 1.1% of returns)
07821:
$20,780
New Jersey:
$30,844
(% of AGI for various income ranges: 59.8% for AGIs $50k-75k, 492.5% for AGIs over 200k)
Total itemized deductions: $29,192 (reported on 17.7% of returns)
Here:
$29,192
State:
$32,863
(% of AGI for various income ranges: 181.4% for AGIs below $25k, 442.5% for AGIs $25k-50k, 598.1% for AGIs $50k-75k, 1069.6% for AGIs $75k-100k, 1196.3% for AGIs $100k-200k, 4148.8% for AGIs over 200k)
Charity contributions: $4,833 (reported on 14.6% of returns)
Here:
$4,833
State:
$7,880
(% of AGI for various income ranges: 7.3% for AGIs below $25k, 25.4% for AGIs $25k-50k, 35.0% for AGIs $50k-75k, 127.1% for AGIs $75k-100k, 181.0% for AGIs $100k-200k, 818.1% for AGIs over 200k)
Taxes paid: $9,254 (reported on 17.7% of returns)
07821:
$9,254
State:
$9,183
(% of AGI for various income ranges: 44.2% for AGIs below $25k, 139.6% for AGIs $25k-50k, 210.5% for AGIs $50k-75k, 401.4% for AGIs $75k-100k, 399.1% for AGIs $100k-200k, 1118.8% for AGIs over 200k)
Earned income credit: $1,673 (reported on 5.8% of returns)
Here:
$1,673
State:
$2,148
(% of AGI for various income ranges: 41.9% for AGIs below $25k, 39.2% for AGIs $25k-50k)
Percentage of individuals using paid preparers for their 2020 taxes: 91.8%
Here:
92%
State:
92%
(% for various income ranges: 90.6% for AGIs below $25k, 91.5% for AGIs $25k-50k, 91.8% for AGIs $50k-75k, 91.1% for AGIs $75k-100k, 93.2% for AGIs $100k-200k, 92.3% for AGIs over 200k)
Averages for the 2012 tax year for zip code 07821, filed in 2013:
Average Adjusted Gross Income (AGI) in 2012: $91,065 (Individual Income Tax Returns)
Here:
$91,065
State:
$79,688
Salary/wage: $77,595 (reported on 86.0% of returns)
Here:
$77,595
State:
$68,122
(% of AGI for various income ranges: 70.3% for AGIs below $25k, 71.1% for AGIs $25k-50k, 70.1% for AGIs $50k-75k, 78.2% for AGIs $75k-100k, 81.0% for AGIs $100k-200k, 64.7% for AGIs over 200k)
Taxable interest for individuals: $1,169 (reported on 44.9% of returns)
This zip code:
$1,169
New Jersey:
$2,193
(% of AGI for various income ranges: 1.8% for AGIs below $25k, 0.8% for AGIs $25k-50k, 0.9% for AGIs $50k-75k, 0.5% for AGIs $75k-100k, 0.4% for AGIs $100k-200k, 0.6% for AGIs over 200k)
Ordinary dividends: $3,959 (reported on 33.9% of returns)
Here:
$3,959
State:
$6,828
(% of AGI for various income ranges: 2.7% for AGIs below $25k, 1.9% for AGIs $25k-50k, 1.2% for AGIs $50k-75k, 1.0% for AGIs $75k-100k, 1.0% for AGIs $100k-200k, 2.0% for AGIs over 200k)
Net capital gain/loss in AGI: +$2,811 (reported on 22.4% of returns)
Here:
+$2,811
State:
+$15,358
(% of AGI for various income ranges: 0.3% for AGIs $50k-75k, 0.5% for AGIs $100k-200k, 1.5% for AGIs over 200k)
Profit/loss from business: +$21,139 (reported on 16.1% of returns)
Here:
+$21,139
State:
+$19,577
(% of AGI for various income ranges: 8.7% for AGIs below $25k, 4.5% for AGIs $25k-50k, 4.8% for AGIs $50k-75k, 3.2% for AGIs $75k-100k, 3.3% for AGIs $100k-200k, 3.5% for AGIs over 200k)
Taxable individual retirement arrangement distribution: $19,628 (reported on 11.0% of returns)
07821:
$19,628
New Jersey:
$18,214
(% of AGI for various income ranges: 3.3% for AGIs below $25k, 3.1% for AGIs $25k-50k, 2.6% for AGIs $50k-75k, 2.8% for AGIs $75k-100k, 2.4% for AGIs $100k-200k, 1.9% for AGIs over 200k)
Self-employment retirement plans: $22,657 (reported on 1.6% of returns)
07821:
$22,657
New Jersey:
$24,511
Total itemized deductions: $28,724 (21% of AGI, reported on 58.2% of returns)
Here:
$28,724
State:
$30,827
Here:
21.2% of AGI
State:
21.2% of AGI
(% of AGI for various income ranges: 22.5% for AGIs below $25k, 19.2% for AGIs $25k-50k, 20.5% for AGIs $50k-75k, 21.3% for AGIs $75k-100k, 20.1% for AGIs $100k-200k, 14.4% for AGIs over 200k)
Charity contributions: $2,172 (reported on 50.2% of returns)
Here:
$2,172
State:
$3,451
(% of AGI for various income ranges: 1.0% for AGIs below $25k, 0.9% for AGIs $25k-50k, 1.2% for AGIs $50k-75k, 1.4% for AGIs $75k-100k, 1.4% for AGIs $100k-200k, 1.0% for AGIs over 200k)
Taxes paid: $15,532 (reported on 58.2% of returns)
07821:
$15,532
State:
$15,801
(% of AGI for various income ranges: 8.9% for AGIs below $25k, 7.8% for AGIs $25k-50k, 9.8% for AGIs $50k-75k, 9.8% for AGIs $75k-100k, 10.3% for AGIs $100k-200k, 10.1% for AGIs over 200k)
Earned income credit: $1,788 (reported on 5.6% of returns)
Here:
$1,788
State:
$2,182
(% of AGI for various income ranges: 2.2% for AGIs below $25k, 0.6% for AGIs $25k-50k)
Percentage of individuals using paid preparers for their 2012 taxes: 60.5%
Here:
61%
State:
65%
(% for various income ranges: 51.3% for AGIs below $25k, 58.6% for AGIs $25k-50k, 63.6% for AGIs $50k-75k, 62.5% for AGIs $75k-100k, 66.7% for AGIs $100k-200k, 69.7% for AGIs over 200k)
Averages for the 2004 tax year for zip code 07821, filed in 2005:
Average Adjusted Gross Income (AGI) in 2004: $72,675 (Individual Income Tax Returns)
Here:
$72,675
State:
$64,921
Salary/wage: $66,848 (reported on 87.2% of returns)
Here:
$66,848
State:
$57,755
(% of AGI for various income ranges: 138.9% for AGIs below $10k, 73.5% for AGIs $10k-25k, 76.5% for AGIs $25k-50k, 81.4% for AGIs $50k-75k, 83.5% for AGIs $75k-100k, 79.2% for AGIs over 100k)
Taxable interest for individuals: $1,242 (reported on 61.8% of returns)
This zip code:
$1,242
New Jersey:
$2,068
(% of AGI for various income ranges: 7.8% for AGIs below $10k, 3.5% for AGIs $10k-25k, 1.8% for AGIs $25k-50k, 1.1% for AGIs $50k-75k, 1.0% for AGIs $75k-100k, 0.8% for AGIs over 100k)
Taxable dividends: $2,039 (reported on 39.5% of returns)
Here:
$2,039
State:
$3,959
(% of AGI for various income ranges: 8.0% for AGIs below $10k, 2.4% for AGIs $10k-25k, 0.9% for AGIs $25k-50k, 0.8% for AGIs $50k-75k, 0.9% for AGIs $75k-100k, 1.1% for AGIs over 100k)
Net capital gain/loss: +$9,215 (reported on 29.0% of returns)
Here:
+$9,215
State:
+$13,591
(% of AGI for various income ranges: -4.4% for AGIs below $10k, -0.8% for AGIs $10k-25k, 0.3% for AGIs $25k-50k, 0.8% for AGIs $50k-75k, 0.6% for AGIs $75k-100k, 6.1% for AGIs over 100k)
Profit/loss from business: +$17,650 (reported on 16.3% of returns)
Here:
+$17,650
State:
+$17,520
(% of AGI for various income ranges: 10.8% for AGIs below $10k, 7.2% for AGIs $10k-25k, 6.6% for AGIs $25k-50k, 4.4% for AGIs $50k-75k, 3.7% for AGIs $75k-100k, 3.2% for AGIs over 100k)
IRA payment deduction: $3,583 (reported on 4.2% of returns)
07821:
$3,583
New Jersey:
$3,270
(% of AGI for various income ranges: 0.5% for AGIs $25k-50k, 0.3% for AGIs $50k-75k, 0.3% for AGIs $75k-100k, 0.1% for AGIs over 100k)
Self-employed pension: $12,420 (reported on 1.7% of returns)
Here:
$12,420
New Jersey:
$17,258
(% of AGI for various income ranges: 0.2% for AGIs $50k-75k, 0.1% for AGIs $75k-100k, 0.4% for AGIs over 100k)
Total itemized deductions: $22,751 (21% of AGI, reported on 59.5% of returns)
Here:
$22,751
State:
$23,924
Here:
21.4% of AGI
State:
21.1% of AGI
(% of AGI for various income ranges: 27.0% for AGIs below $10k, 18.8% for AGIs $10k-25k, 19.2% for AGIs $25k-50k, 22.9% for AGIs $50k-75k, 21.5% for AGIs $75k-100k, 16.7% for AGIs over 100k)
Charity contributions deductions: $2,289 (2% of AGI, reported on 55.0% of returns)
Here:
$2,289
State:
$3,242
Here:
2.1% of AGI
State:
2.7% of AGI
(% of AGI for various income ranges: 0.7% for AGIs below $10k, 1.0% for AGIs $10k-25k, 1.4% for AGIs $25k-50k, 1.8% for AGIs $50k-75k, 1.9% for AGIs $75k-100k, 1.8% for AGIs over 100k)
Total tax: $11,565 (reported on 84.8% of returns)
07821:
$11,565
State:
$12,321
(% of AGI for various income ranges: 4.2% for AGIs below $10k, 5.4% for AGIs $10k-25k, 8.2% for AGIs $25k-50k, 8.7% for AGIs $50k-75k, 9.6% for AGIs $75k-100k, 17.0% for AGIs over 100k)
Earned income credit: $1,468 (reported on 4.6% of returns)
Here:
$1,468
State:
$1,711
Percentage of individuals using paid preparers for their 2004 taxes: 60.9%
Here:
61%
State:
65%
(% for various income ranges: 50.9% for AGIs below $10k, 54.5% for AGIs $10k-25k, 61.0% for AGIs $25k-50k, 65.1% for AGIs $50k-75k, 66.5% for AGIs $75k-100k, 65.0% for AGIs over 100k)
Likely homosexual households (counted as self-reported same-sex unmarried-partner households)
Lesbian couples: 0.2% of all households
Gay men: 0.0% of all households
Household received Food Stamps/SNAP in the past 12 months: 52 Household did not receive Food Stamps/SNAP in the past 12 months: 3,559
Women who had a birth in the past 12 months: 54 (55 now married, 0 unmarried) Women who did not have a birth in the past 12 months: 2,328 (899 now married, 1,429 unmarried)
Housing units in zip code 07821 with a mortgage: 2,340 (229 second mortgage, 204 both second mortgage and home equity loan) Houses without a mortgage: 120
Median monthly owner costs for units with a mortgage: $2,597 Median monthly owner costs for units without a mortgage: $1,059
Residents with income below the poverty level in 2022:
This zip code:
1.7%
Whole state:
9.7%
Residents with income below 50% of the poverty level in 2022:
This zip code:
0.9%
Whole state:
5.2%
Median number of rooms in houses and condos:
Here:
7.4
State:
6.8
Median number of rooms in apartments:
Here:
5.2
State:
3.9
Notable locations in this zip code not listed on our city pages
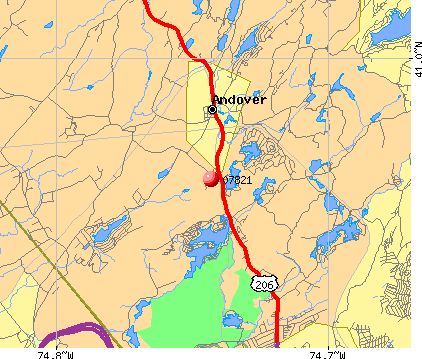
Notable locations in zip code 07821: Quaker Church (A), Mount Allamuchy Camp (B), Alla Valley Dairy (C), Allamuchy - Green First Aid Squad (D), New Jersey Forest Fire Service North Division (E), Byram Township Fire Department Station 3 (F), Hopatcong Fire Department Northwood Engine Company 2 (G), Green Township Volunteer Fire Department (H), Andover Borough Fire Department (I). Display/hide their locations on the map
Lakes and reservoirs: Panther Lake (A), Hughs Pond (B), Turtle Pond (C), Stag Pond (D), Bear Pond (E), Buckmire Pond (F), Cub Lake (G), Brighton Lake (H). Display/hide their locations on the map
Streams, rivers, and creeks: Chemy Creek (A), Cranberry Bog Run (B), Ledge Run (C), Teeny Creek (D), Tiny Creek (E), Weaver House Run (F), Punkhorn Creek (G), Bear Brook (H), Mountain Brook (I). Display/hide their locations on the map
In group quarters: 7 (-1 institutionalized population)
Size of family households: 973 2-persons, 677 3-persons, 735 4-persons, 194 5-persons, 44 6-persons, 14 7-or-more-persons
Size of nonfamily households: 731 1-person, 272 2-persons, 4 4-persons
1,299 married couples with children.
308 single-parent households (175 men, 133 women).
88.6% of residents of 07821 zip code speak English at home.
5.6% of residents speak Spanish at home (78% very well, 22% well).
3.9% of residents speak other Indo-European language at home (82% very well, 12% well, 6% not well).
0.3% of residents speak Asian or Pacific Island language at home (50% very well, 44% well, 6% not well).
1.0% of residents speak other language at home (73% very well, 27% well).
Foreign born population: 831 (8.7%) (85.3% of them are naturalized citizens)
This zip code:
8.7%
Whole state:
23.5%
11%Sweden
8%Haiti
7%India
7%United Kingdom, excluding England and Scotland
6%Barbados
5%Chile
5%North Macedonia (Macedonia)
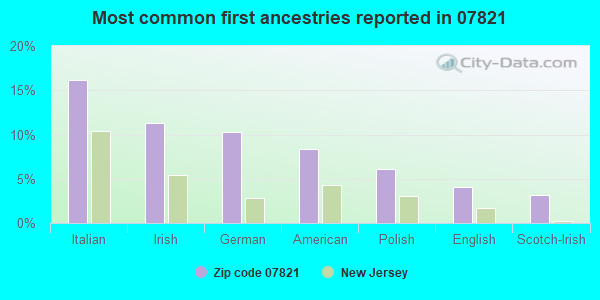
16%Italian
11%Irish
10%German
8%American
6%Polish
4%English
3%Scotch-Irish
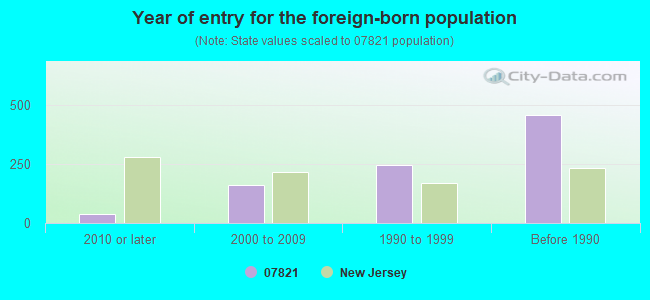
Year of entry for the foreign-born population
362010 or later
1612000 to 2009
2441990 to 1999
457Before 1990
Major facilities with environmental interests located in this zip code:
ANDOVER BORO (137 MAIN ST in ANDOVER BORO, NJ)
STATE MASTER (New Jersey environmental info) - NJEMS-167003, National Pollutant Discharge Elimination System Permit National Pollutant Discharge Elimination System NON-MAJOR (Tracking pollutant discharge elimination systems) - permit
FIRST STUDENT INC (727 RT 206 in ANDOVER TWP, NJ)
STATE MASTER (New Jersey environmental info) - NJEMS-00000005235, EPCRA, NJEMS-006029, STATE CLEANUP SITE, NJEMS-207360, National Pollutant Discharge Elimination System Permit National Pollutant Discharge Elimination System NON-MAJOR (Tracking pollutant discharge elimination systems) - permit Business SIC classification: SCHOOL BUSES Organizations: STRATA ENVIRONMENTAL, FRANK & DAUGHTERS LLC (CONTACT/OWNER)
Alternative names: FRANK L BLACK BUS SERVICE
FISCHER & SON SAWMILL (714 RT 206 in ANDOVER, NJ)
STATE MASTER (New Jersey environmental info) - NJEMS-285312, National Pollutant Discharge Elimination System Permit National Pollutant Discharge Elimination System NON-MAJOR (Tracking pollutant discharge elimination systems) - permit Organizations: FISCHER & SON SAWMILL LLC, FISCHER & SONS (CONTACT/OWNER)
Alternative names: FISCHER & SON SAWMILL LLC
ANDOVER INTERMEDIATE CARE CENTER (99 MULFORD ROAD in ANDOVER, NJ)
STATE MASTER (New Jersey environmental info) - NJEMS-10867W, DRINKING WATER PROGRAM, NJEMS-1902009, NJEMS-1902333, NJEMS-022607, STATE CLEANUP SITE (Resource Conservation and Recovery Act (tracking hazardous waste)) Organizations: ANDOVER NURSING HOME INC, OWNERNAME (CONTACT/OWNER)
, TURCO ANDOVER INTERMEDICATE COUNTRY CLUB (CONTACT/OWNER)
HUDSON GUILD FARM (270 STANHOPE SPARTA RD in ANDOVER, NJ)
STATE MASTER (New Jersey environmental info) - NJEMS-NJR000036004, HAZARDOUS WASTE PROGRAM Small Quantity Generators, between 100 kg and 1000 kg of hazardous waste/month (Resource Conservation and Recovery Act (tracking hazardous waste)) - notification TRANSPORTER (Resource Conservation and Recovery Act (tracking hazardous waste)) - notification Small Quantity Generators, between 100 kg and 1000 kg of hazardous waste/month (Resource Conservation and Recovery Act (tracking hazardous waste)) - notification Organizations: PETER R KELLOGG (CONTACT/OWNER)
EXXON SERVICE STATION #34894 (RTE 206 & LIMECREST RD in ANDOVER, NJ)
STATE MASTER (New Jersey environmental info) - NJEMS-00000036769, EPCRA, NJEMS-008453, STATE CLEANUP SITE, NJEMS-92699800000, EPCRA, NJEMS-A8383, AIR PROGRAM (Resource Conservation and Recovery Act (tracking hazardous waste)) Business SIC classification: GASOLINE SERVICE STATIONS Organizations: EXXON MOBIL CORP, EXXON CO USA (CONTACT/OWNER)
Alternative names: EXXON CO USA 34894
AJ BOYD INDUSTRIES INC (15 WHITEHALL ROAD in ANDOVER, NJ)
STATE MASTER (New Jersey environmental info) - NJEMS-018037, STATE CLEANUP SITE (Resource Conservation and Recovery Act (tracking hazardous waste)) Organizations: MUHLSTEIN JACK (CONTACT/OWNER)
Alternative names: A J BOYD INDUSTRIES
ANDOVER TEXACO SERVICE STATION (222 NEWTON - SPARTA RD in ANDOVER, NJ)
STATE MASTER (New Jersey environmental info) - NJEMS-007105, STATE CLEANUP SITE (Resource Conservation and Recovery Act (tracking hazardous waste)) Organizations: SOMMERVILLE JILL A (CONTACT/OWNER)
PAR TECH INC (287 LACKAWANNA DR in ANDOVER, NJ)
STATE MASTER (New Jersey environmental info) - NJEMS-83900300000, EPCRA, NJEMS-NJF000105569, TRANSPORTER Conditionally Exempt Small Quantity Generators, less than 100 kg/month of hazardous waste (Resource Conservation and Recovery Act (tracking hazardous waste)) - notification TRANSPORTER (Resource Conservation and Recovery Act (tracking hazardous waste)) - notification Business SIC classification: LOCAL TRUCKING WITHOUT STORAGE Organizations: PAR TECH T/A KEY ENVIRONMENTAL, PAUL MASSER (CONTACT/OWNER)
Alternative names: PAR-TECH DBA KEY ENVIRONMENTAL, PAR-TECH DBA KEY ENVIRONMENTAL
ANDOVER BOROUGH WATER UTILITY TOWER (15 PROSPECT AVE in ANDOVER, NJ)
(Resource Conservation and Recovery Act (tracking hazardous waste)) COMMUNITY WATER SYSTEM (SDWIS) - SDWIS-NJ1901001 2, WATER TREATMENT PLANT Alternative names: ANDOVER BORO WATER DEPT
GESG RECLAMATION MATERIAL INC (41 LENAPE RD in ANDOVER, NJ)
STATE MASTER (New Jersey environmental info) - NJEMS-G000009748, STATE CLEANUP SITE (Resource Conservation and Recovery Act (tracking hazardous waste))
ANDOVER REGIONAL BD OF ED (ANDOVER RD in ANDOVER, NJ)
(Integrated Compliance Information System) - ICIS-02-1988-0759, FORMAL ENFORCEMENT ACTION Business SIC classification: ELEMENTARY AND SECONDARY SCHOOLS
B & J AUTO SALVAGE (77 GIBBS ROAD in ANDOVER, NJ)
National Pollutant Discharge Elimination System NON-MAJOR (Tracking pollutant discharge elimination systems) - permit Business SIC classification: MOTOR VEHICLE PARTS, USED Organizations: ALLAMUCHY FOREIGN CAR LLC (CONTACT/OPERATOR)
, DEWHITE PROPERTIES INC (CONTACT/OWNER)
Housing units lacking complete plumbing facilities: 1.3% Housing units lacking complete kitchen facilities: 1.0%
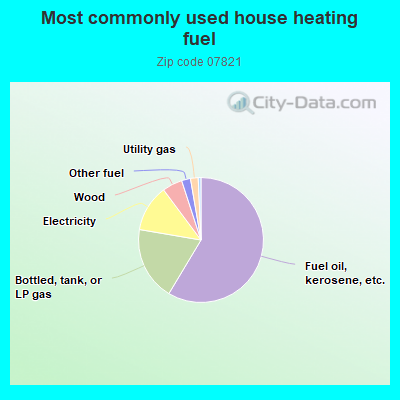
58.6%Fuel oil, kerosene, etc.
19.1%Bottled, tank, or LP gas
12.1%Electricity
5.2%Wood
2.3%Other fuel
2.0%Utility gas
Population in 1990: 8,931.
Place of birth for U.S.-born residents:
This state: 6,587
Northeast: 1,357
Midwest: 211
South: 253
West: 183
66% of the 07821 zip code residents lived in the same house 5 years ago. Out of people who lived in different houses, 31% lived in this county. Out of people who lived in different counties, 50% lived in New Jersey.
93% of the 07821 zip code residents lived in the same house 1 year ago. Out of people who lived in different houses, 24% moved from this county. Out of people who lived in different houses, 27% moved from different county within same state. Out of people who lived in different houses, 51% moved from different state. Out of people who lived in different houses, 4% moved from abroad.
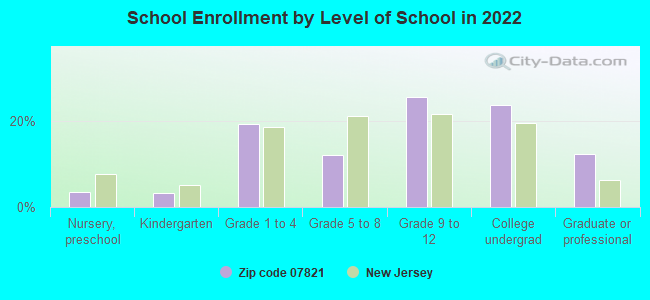
Private vs. public school enrollment:
Students in private schools in grades 1 to 8 (elementary and middle school): 113
Here:
14.6%
New Jersey:
12.3%
Students in private schools in grades 9 to 12 (high school): 36
Here:
5.9%
New Jersey:
13.1%
Students in private undergraduate colleges: 194
Here:
33.3%
New Jersey:
33.2%
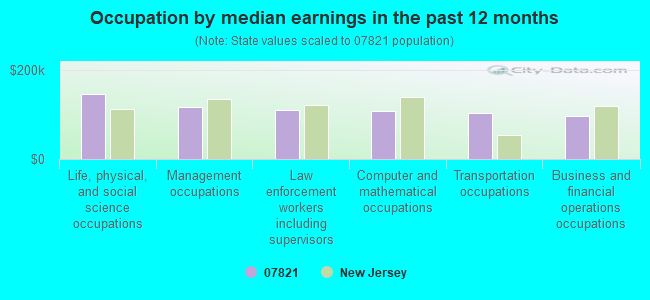
Occupation by median earnings in the past 12 months ($)
146,696Life, physical, and social science occupations
117,054Management occupations
109,220Law enforcement workers including supervisors
107,825Computer and mathematical occupations
102,185Transportation occupations
96,771Business and financial operations occupations
Companies with federal contracts located in this zip code (ANDOVER, NJ):
L E A D INDUSTRIES INC (134 AIRPORT RD; small business) : $2,284,849 in 21 contractsfrom 2003 to 2006
Contracts for Miscellaneous Furniture and Fixtures, Installation of Equipment -- Furniture, Facilities Operations Support Services, Other Salvage Services, and moreby Army Signed by year:2000: $0; 2001: $0; 2002: $0; 2003: $123,320; 2004: $1,089,414; 2005: $952,610; 2006: $119,505.
Biggest contracts:
$497,115 with Army for Miscellaneous Furniture and Fixtures. Signed on 2004-09-15. Completion date: 2004-11-30.
$327,843, same as above.Signed on 2004-07-01. Completion date: 2004-08-30.
$213,852, same as above.Signed on 2004-06-30. Completion date: 2004-08-30.
$192,194 with Army for Installation of Equipment -- Furniture. Signed on 2005-03-14. Completion date: 2006-03-14.
CATO SERVICES LLC (7 LEW MAY DR; small business) : $338,288 in 5 contractsfrom 2005 to 2006
Contracts for Fuel Oils, Refrigeration and Air Conditioning Components, Electric Lamps, Screws by Defense Logistics Agency Signed by year:2000: $0; 2001: $0; 2002: $0; 2003: $0; 2004: $0; 2005: $57,660; 2006: $280,628.
Biggest contracts:
$280,628 with Defense Logistics Agency for Fuel Oils. Signed on 2006-02-03. Completion date: 2010-12-31.
$34,875 with Defense Logistics Agency for Refrigeration and Air Conditioning Components. Signed on 2005-08-02. Completion date: 2005-10-26.
$22,785 with Defense Logistics Agency for Electric Lamps. Signed on 2005-09-03. Completion date: 2006-01-01.
$13,500 with Defense Logistics Agency for Screws. Signed on 2006-04-13. Completion date: 2006-06-10.
INDUSTRY SOURCE LLC (238A RT 206; small business) : $313,775 in 24 contractsin 2005
Contracts for Bushings, Rings, Shims, and Spacers, Semiconductor Devices and Associated Hardware, Liquid and Gas Flow, Liquid Level, and Mechanical Motion Measuring Instruments, Motors, Electrical, and moreby Defense Logistics Agency Signed by year:2000: $0; 2001: $0; 2002: $0; 2003: $0; 2004: $0; 2005: $313,775; 2006: $0.
Biggest contracts:
$37,684 with Defense Logistics Agency for Bushings, Rings, Shims, and Spacers. Signed on 2005-09-01. Completion date: 2005-12-30.
$30,932 with Defense Logistics Agency for Semiconductor Devices and Associated Hardware. Signed on 2005-10-31. Completion date: 2006-03-17.
$23,502 with Defense Logistics Agency for Liquid and Gas Flow, Liquid Level, and Mechanical Motion Measuring Instruments. Signed on 2005-08-31. Completion date: 2006-07-12.
$21,329 with Defense Logistics Agency for Motors, Electrical. Signed on 2005-09-28. Completion date: 2006-04-18.
FASTAC DESIGN & DEVELOPMENT CO (16 BEAR CREEK ROAD; small business) : $157,383 in 3 contractsin 2000
$54,183 with Army for Maintenance, Repair and Rebuilding of Equipment -- Instruments and Laboratory Equipment. Signed on 2000-12-19. Completion date: 2001-09-30.
$53,665, same as above.Signed on 2000-07-13. Completion date: 2000-01-30.
$49,535, same as above.Signed on 2000-01-10. Completion date: 2000-07-30.
NU STAR PRODUCTS (134 MAIN STREET; small business)
$91,840 with Defense Logistics Agency for Fastening Device. Signed on 2002-06-05. Completion date: 2002-12-07.
CHALLENGE INDUSTRIES, INC (134 MAIN STREET; small business)
$57,600 with Defense Logistics Agency for Nuts and Washers. Signed on 2001-03-20. Completion date: 2001-03-28.
CARTRIDGE ACTUATED DEVICES INC (40 OLD INDIAN SPRING RD; small business)
$43,500 with Navy for Cartridge and Propellant Actuated Devices and Components. Signed on 2005-09-26. Completion date: 2006-02-20.
CHALL AIDE PRODUCTS (134 MAIN STREET; small business) 750 employees, $0 revenue. : $27,701 in 3 contractsfrom 2001 to 2002
$27,701 with Defense Logistics Agency for Hardware, Commercial. Signed on 2001-10-05. Completion date: 2001-12-20.
$26,810 with Defense Logistics Agency for Hardware, Weapon System. Signed on 2002-04-09. Completion date: 2002-07-08.
-$26,810, same as above.Signed on 2002-08-28. Completion date: 2002-08-28.
JA BAR SILICONE CORPORATION (252 BRIGHTON ROAD; small business) : $6,204 in 5 contractsfrom 2003 to 2004
Contracts for Miscellaneous Electrical and Electronic Components, Packing and Gasket Materials by Army Signed by year:2000: $0; 2001: $0; 2002: $0; 2003: $3,950; 2004: $2,254; 2005: $0; 2006: $0.
Biggest contracts:
$3,950 with Army for Miscellaneous Electrical and Electronic Components. Signed on 2003-09-08. Completion date: 2003-10-06.
$1,077 with Army for Packing and Gasket Materials. Signed on 2004-05-07. Completion date: 2004-06-14.
$691, same as above.Signed on 2004-03-23. Completion date: 2004-04-30.
$300, same as above.Signed on 2004-06-21. Completion date: 2004-07-26.
FACTORY DIRECT PIPELINE PRODUC (502 HEDDEN ROAD; small business)
$5,257 with Navy for Hose, Pipe, Tube, Lubrication, and Railing Fittings. Signed on 2004-11-10. Completion date: 2004-11-29.
Top industries in this zip code by the number of employees in 2005:
Health Care and Social Assistance: Nursing Care Facilities (500-999 employees: 1 establishment, 100-249 employees: 1 establishment)
Educational Services: Elementary and Secondary Schools (100-249: 1)
Accommodation and Food Services: Caterers (50-99: 1)
Other Services (except Public Administration): Other Personal and Household Goods Repair and Maintenance (20-49: 1, 1-4: 2)
Information: Data Processing, Hosting, and Related Services (20-49: 1)
People in group quarters in 2010:
10 people in group homes intended for adults
People in group quarters in 2000:
6 people in homes for the mentally retarded
Fatal accident statistics in 2013:
Fatal accident count: 1
Vehicles involved in fatal accidents: 2
Fatal accidents caused by drunken drivers: 0
Fatalities: 1
Persons involved in fatal accidents: 2
Pedestrians involved in fatal accidents: 0
Home Mortgage Disclosure Act Aggregated Statistics For Year 2009 (Based on 14 partial tracts)
A) FHA, FSA/RHS & VA Home Purchase Loans
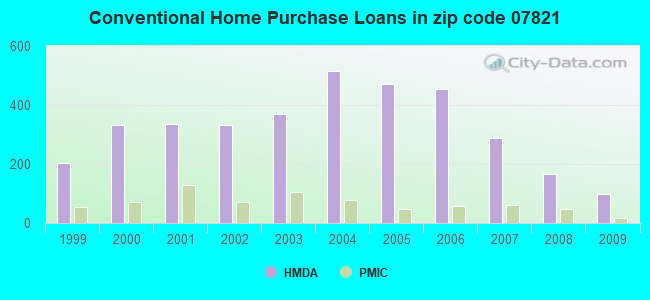
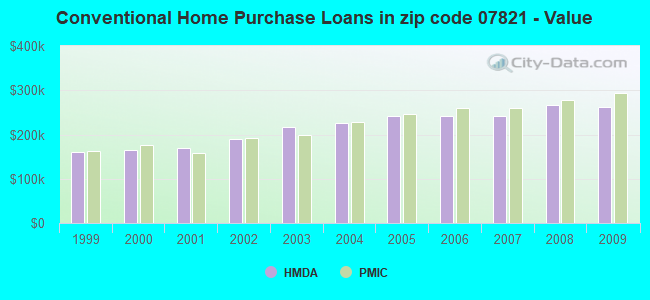
B) Conventional Home Purchase Loans
C) Refinancings
D) Home Improvement Loans
F) Non-occupant Loans on < 5 Family Dwellings (A B C & D)
G) Loans On Manufactured Home Dwelling (A B C & D)
Number
Average Value
Number
Average Value
Number
Average Value
Number
Average Value
Number
Average Value
Number
Average Value
LOANS ORIGINATED
78
$240,061
100
$262,017
627
$241,920
39
$94,200
29
$236,367
0
$0
APPLICATIONS APPROVED, NOT ACCEPTED
9
$250,681
13
$203,978
55
$224,540
14
$89,318
3
$183,543
0
$0
APPLICATIONS DENIED
17
$267,842
24
$254,240
244
$276,330
27
$121,563
7
$190,603
2
$186,940
APPLICATIONS WITHDRAWN
13
$246,705
5
$191,792
142
$260,197
11
$107,245
4
$196,758
0
$0
FILES CLOSED FOR INCOMPLETENESS
1
$108,350
3
$137,220
45
$288,405
6
$34,272
1
$322,190
0
$0
Aggregated Statistics For Year 2008 (Based on 14 partial tracts)
A) FHA, FSA/RHS & VA Home Purchase Loans
B) Conventional Home Purchase Loans
C) Refinancings
D) Home Improvement Loans
E) Loans on Dwellings For 5+ Families
F) Non-occupant Loans on < 5 Family Dwellings (A B C & D)
G) Loans On Manufactured Home Dwelling (A B C & D)
Number
Average Value
Number
Average Value
Number
Average Value
Number
Average Value
Number
Average Value
Number
Average Value
Number
Average Value
LOANS ORIGINATED
64
$255,733
165
$266,111
421
$225,917
66
$69,198
1
$296,970
27
$188,943
2
$16,490
APPLICATIONS APPROVED, NOT ACCEPTED
8
$229,970
41
$283,343
99
$243,924
11
$26,839
0
$0
7
$214,961
0
$0
APPLICATIONS DENIED
11
$244,907
32
$291,067
265
$270,211
46
$77,937
0
$0
9
$153,158
2
$74,775
APPLICATIONS WITHDRAWN
16
$288,384
40
$250,054
119
$276,499
10
$139,854
1
$296,970
8
$197,930
0
$0
FILES CLOSED FOR INCOMPLETENESS
1
$244,230
6
$340,360
33
$288,506
2
$91,065
0
$0
0
$0
0
$0
Aggregated Statistics For Year 2007 (Based on 14 partial tracts)
A) FHA, FSA/RHS & VA Home Purchase Loans
B) Conventional Home Purchase Loans
C) Refinancings
D) Home Improvement Loans
E) Loans on Dwellings For 5+ Families
F) Non-occupant Loans on < 5 Family Dwellings (A B C & D)
Number
Average Value
Number
Average Value
Number
Average Value
Number
Average Value
Number
Average Value
Number
Average Value
LOANS ORIGINATED
12
$221,643
288
$242,905
561
$221,857
134
$80,604
1
$403,600
36
$168,923
APPLICATIONS APPROVED, NOT ACCEPTED
2
$374,940
42
$235,901
90
$204,701
31
$76,307
0
$0
8
$234,954
APPLICATIONS DENIED
2
$210,945
63
$263,316
302
$251,931
85
$80,190
0
$0
12
$184,892
APPLICATIONS WITHDRAWN
2
$163,560
59
$209,667
158
$265,981
33
$81,081
0
$0
9
$161,799
FILES CLOSED FOR INCOMPLETENESS
2
$44,525
8
$246,718
49
$280,380
7
$162,293
0
$0
4
$235,285
Aggregated Statistics For Year 2006 (Based on 14 partial tracts)
A) FHA, FSA/RHS & VA Home Purchase Loans
B) Conventional Home Purchase Loans
C) Refinancings
D) Home Improvement Loans
F) Non-occupant Loans on < 5 Family Dwellings (A B C & D)
G) Loans On Manufactured Home Dwelling (A B C & D)
Number
Average Value
Number
Average Value
Number
Average Value
Number
Average Value
Number
Average Value
Number
Average Value
LOANS ORIGINATED
11
$264,261
453
$241,440
704
$215,807
137
$84,758
52
$215,872
2
$84,305
APPLICATIONS APPROVED, NOT ACCEPTED
0
$0
51
$264,296
147
$211,837
37
$73,485
4
$175,050
2
$42,060
APPLICATIONS DENIED
4
$209,162
68
$237,499
328
$249,300
80
$73,985
15
$225,373
0
$0
APPLICATIONS WITHDRAWN
6
$233,170
86
$221,178
248
$234,719
25
$96,890
9
$176,586
1
$30,430
FILES CLOSED FOR INCOMPLETENESS
1
$238,240
8
$232,701
88
$269,411
3
$66,993
1
$412,780
0
$0
Aggregated Statistics For Year 2005 (Based on 14 partial tracts)
A) FHA, FSA/RHS & VA Home Purchase Loans
B) Conventional Home Purchase Loans
C) Refinancings
D) Home Improvement Loans
E) Loans on Dwellings For 5+ Families
F) Non-occupant Loans on < 5 Family Dwellings (A B C & D)
G) Loans On Manufactured Home Dwelling (A B C & D)
Number
Average Value
Number
Average Value
Number
Average Value
Number
Average Value
Number
Average Value
Number
Average Value
Number
Average Value
LOANS ORIGINATED
24
$242,139
470
$242,434
884
$208,282
157
$95,068
0
$0
45
$227,595
0
$0
APPLICATIONS APPROVED, NOT ACCEPTED
1
$381,320
80
$244,792
121
$181,433
16
$62,800
0
$0
7
$143,306
0
$0
APPLICATIONS DENIED
2
$182,265
95
$221,782
275
$214,375
67
$99,102
1
$74,450
19
$167,142
2
$15,285
APPLICATIONS WITHDRAWN
7
$244,599
84
$222,053
287
$208,226
46
$212,514
0
$0
11
$223,955
0
$0
FILES CLOSED FOR INCOMPLETENESS
0
$0
33
$168,654
176
$247,283
9
$47,602
0
$0
4
$232,662
0
$0
Aggregated Statistics For Year 2004 (Based on 14 partial tracts)
A) FHA, FSA/RHS & VA Home Purchase Loans
B) Conventional Home Purchase Loans
C) Refinancings
D) Home Improvement Loans
E) Loans on Dwellings For 5+ Families
F) Non-occupant Loans on < 5 Family Dwellings (A B C & D)
G) Loans On Manufactured Home Dwelling (A B C & D)
Number
Average Value
Number
Average Value
Number
Average Value
Number
Average Value
Number
Average Value
Number
Average Value
Number
Average Value
LOANS ORIGINATED
26
$215,802
515
$225,519
848
$185,107
160
$60,193
1
$3,137,140
47
$164,121
1
$20,640
APPLICATIONS APPROVED, NOT ACCEPTED
3
$144,333
55
$223,198
139
$162,019
29
$53,859
0
$0
5
$110,828
0
$0
APPLICATIONS DENIED
2
$216,230
50
$213,208
321
$190,234
93
$70,798
0
$0
8
$159,030
5
$140,878
APPLICATIONS WITHDRAWN
11
$176,022
76
$241,604
193
$181,664
12
$142,390
0
$0
9
$174,870
2
$97,785
FILES CLOSED FOR INCOMPLETENESS
0
$0
18
$174,936
72
$219,580
10
$103,647
0
$0
3
$153,207
0
$0
Aggregated Statistics For Year 2003 (Based on 14 partial tracts)
A) FHA, FSA/RHS & VA Home Purchase Loans
B) Conventional Home Purchase Loans
C) Refinancings
D) Home Improvement Loans
F) Non-occupant Loans on < 5 Family Dwellings (A B C & D)
Number
Average Value
Number
Average Value
Number
Average Value
Number
Average Value
Number
Average Value
LOANS ORIGINATED
45
$176,598
368
$217,154
1,921
$166,032
109
$52,991
53
$163,315
APPLICATIONS APPROVED, NOT ACCEPTED
8
$174,292
65
$196,084
274
$143,601
35
$59,281
11
$102,518
APPLICATIONS DENIED
7
$202,810
40
$243,508
440
$173,563
75
$35,531
17
$145,570
APPLICATIONS WITHDRAWN
9
$183,927
65
$173,463
327
$171,649
13
$57,068
10
$138,550
FILES CLOSED FOR INCOMPLETENESS
2
$210,310
10
$236,645
70
$163,369
15
$36,875
1
$257,990
Aggregated Statistics For Year 2002 (Based on 14 partial tracts)
A) FHA, FSA/RHS & VA Home Purchase Loans
B) Conventional Home Purchase Loans
C) Refinancings
D) Home Improvement Loans
F) Non-occupant Loans on < 5 Family Dwellings (A B C & D)
Number
Average Value
Number
Average Value
Number
Average Value
Number
Average Value
Number
Average Value
LOANS ORIGINATED
24
$179,195
331
$190,633
1,084
$168,153
118
$52,798
41
$201,264
APPLICATIONS APPROVED, NOT ACCEPTED
3
$150,310
34
$169,242
164
$140,938
45
$52,015
3
$133,407
APPLICATIONS DENIED
2
$102,735
18
$174,079
260
$152,355
49
$46,697
9
$128,144
APPLICATIONS WITHDRAWN
4
$116,795
45
$220,788
194
$164,976
16
$31,262
5
$70,634
FILES CLOSED FOR INCOMPLETENESS
2
$175,525
9
$198,037
45
$144,720
5
$44,938
0
$0
Aggregated Statistics For Year 2001 (Based on 14 partial tracts)
A) FHA, FSA/RHS & VA Home Purchase Loans
B) Conventional Home Purchase Loans
C) Refinancings
D) Home Improvement Loans
F) Non-occupant Loans on < 5 Family Dwellings (A B C & D)
Number
Average Value
Number
Average Value
Number
Average Value
Number
Average Value
Number
Average Value
LOANS ORIGINATED
50
$156,868
334
$170,588
696
$152,503
99
$39,893
20
$115,927
APPLICATIONS APPROVED, NOT ACCEPTED
7
$151,157
28
$180,007
108
$117,779
26
$40,392
3
$58,013
APPLICATIONS DENIED
4
$122,468
19
$175,916
213
$130,288
55
$47,856
11
$150,328
APPLICATIONS WITHDRAWN
13
$130,978
31
$171,463
156
$151,003
25
$35,746
5
$144,330
FILES CLOSED FOR INCOMPLETENESS
0
$0
3
$207,053
31
$142,793
2
$41,455
0
$0
Aggregated Statistics For Year 2000 (Based on 14 partial tracts)
A) FHA, FSA/RHS & VA Home Purchase Loans
B) Conventional Home Purchase Loans
C) Refinancings
D) Home Improvement Loans
F) Non-occupant Loans on < 5 Family Dwellings (A B C & D)
Number
Average Value
Number
Average Value
Number
Average Value
Number
Average Value
Number
Average Value
LOANS ORIGINATED
29
$146,083
332
$164,508
182
$97,307
110
$34,653
19
$107,012
APPLICATIONS APPROVED, NOT ACCEPTED
1
$224,150
43
$179,480
67
$110,867
28
$30,997
3
$157,900
APPLICATIONS DENIED
4
$154,530
39
$153,087
151
$104,572
68
$32,119
5
$148,908
APPLICATIONS WITHDRAWN
4
$139,002
32
$150,233
97
$92,877
21
$38,938
1
$120,380
FILES CLOSED FOR INCOMPLETENESS
2
$90,950
10
$147,791
41
$148,988
3
$16,683
0
$0
Aggregated Statistics For Year 1999 (Based on 1 full and 7 partial tracts)
A) FHA, FSA/RHS & VA Home Purchase Loans
B) Conventional Home Purchase Loans
C) Refinancings
D) Home Improvement Loans
F) Non-occupant Loans on < 5 Family Dwellings (A B C & D)
2002 - 2018 National Fire Incident Reporting System (NFIRS) incidents
Based on the data from the years 2002 - 2018 the average number of fires per year is 24. The highest number of fires - 55 took place in 2010, and the least - 0 in 2003. The data has a rising trend.
When looking into fire subcategories, the most incidents belonged to: Structure Fires (53.5%), and Outside Fires (26.7%).
Fire incident types reported to NFIRS in Zip Code 07821


 Nearest zip codes: 07874, 07820, 07828, 07857, 07843, 07850.


 Based on the data from the years 2002 - 2018 the average number of fires per year is 24. The highest number of fires - 55 took place in 2010, and the least - 0 in 2003. The data has a rising trend.
 When looking into fire subcategories, the most incidents belonged to: Structure Fires (53.5%), and Outside Fires (26.7%).