Estimated zip code population in 2022: 44,991 Zip code population in 2010: 45,141 Zip code population in 2000: 44,987
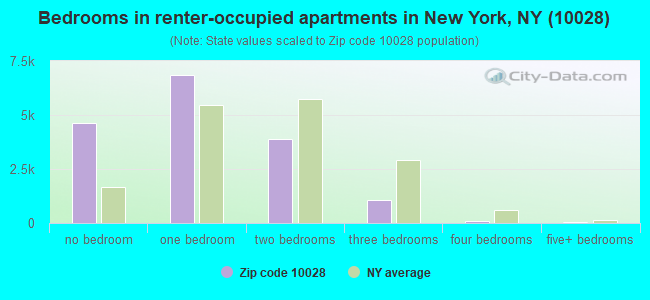
Houses and condos: 29,834 Renter-occupied apartments: 16,150
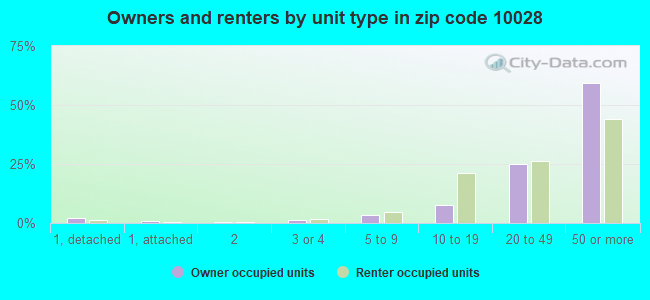
% of renters here:
65%
State:
46%
March 2022 cost of living index in zip code 10028: 156.0 (very high, U.S. average is 100)
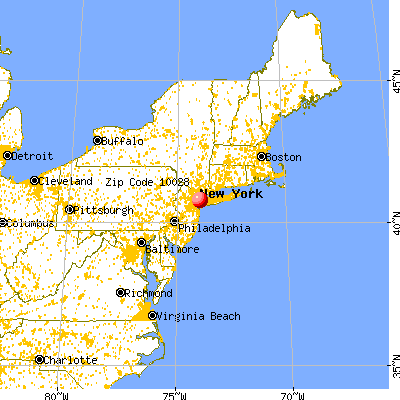
Land area: 0.3 sq. mi. Water area: 0.0 sq. mi.
Population density: 143,206 people per square mile
(very high).
OSM Map
General Map
Google Map
MSN Map
OSM Map
General Map
Google Map
MSN Map
OSM Map
General Map
Google Map
MSN Map
OSM Map
General Map
Google Map
MSN Map
Please wait while loading the map...
Real estate property taxes paid for housing units in 2022:
This zip code:
0.6% ($9,805)
New York:
1.5% ($6,180)
Median real estate property taxes paid for housing units with mortgages in 2022: $9,858 (0.6%) Median real estate property taxes paid for housing units with no mortgage in 2022: $9,755 (0.6%)
Estimated median house/condo value in 2022: $1,638,815
10028:
$1,638,815
New York:
$400,400
According to our research of New York and other state lists, there were 3 registered sex offenders living in 10028 zip code as of May 21, 2024. The ratio of all residents to sex offenders in zip code 10028 is 16,299 to 1. The ratio of registered sex offenders to all residents in this zip code is much lower than the state average.
Median resident age:
This zip code:
42.3 years
New York median age:
40.0 years
Average household size:
This zip code:
1.8 people
New York:
2.5 people
Averages for the 2020 tax year for zip code 10028, filed in 2021:
Average Adjusted Gross Income (AGI) in 2020: $403,052 (Individual Income Tax Returns)
Here:
$403,052
State:
$90,930
Salary/wage: $235,215 (reported on 71.3% of returns)
Here:
$235,215
State:
$72,104
(% of AGI for various income ranges: 1037.3% for AGIs below $25k, 3549.5% for AGIs $25k-50k, 7066.2% for AGIs $50k-75k, 10842.9% for AGIs $75k-100k, 20653.2% for AGIs $100k-200k, 264839.5% for AGIs over 200k)
Taxable interest for individuals: $16,412 (reported on 59.9% of returns)
This zip code:
$16,412
New York:
$3,075
(% of AGI for various income ranges: 82.2% for AGIs below $25k, 124.4% for AGIs $25k-50k, 104.7% for AGIs $50k-75k, 148.2% for AGIs $75k-100k, 401.6% for AGIs $100k-200k, 18366.1% for AGIs over 200k)
Ordinary dividends: $42,269 (reported on 53.9% of returns)
Here:
$42,269
State:
$11,095
(% of AGI for various income ranges: 287.2% for AGIs below $25k, 393.7% for AGIs $25k-50k, 388.7% for AGIs $50k-75k, 560.4% for AGIs $75k-100k, 1422.2% for AGIs $100k-200k, 40808.4% for AGIs over 200k)
Net capital gain/loss in AGI: +$218,502 (reported on 49.9% of returns)
Here:
+$218,502
State:
+$44,925
(% of AGI for various income ranges: 161.7% for AGIs below $25k, 300.5% for AGIs $25k-50k, 300.1% for AGIs $50k-75k, 466.9% for AGIs $75k-100k, 1326.6% for AGIs $100k-200k, 215754.5% for AGIs over 200k)
Profit/loss from business: +$47,294 (reported on 18.6% of returns)
Here:
+$47,294
State:
+$14,940
(% of AGI for various income ranges: 271.0% for AGIs below $25k, 446.7% for AGIs $25k-50k, 396.8% for AGIs $50k-75k, 390.5% for AGIs $75k-100k, 941.6% for AGIs $100k-200k, 13743.7% for AGIs over 200k)
Taxable individual retirement arrangement distribution: $46,224 (reported on 11.5% of returns)
10028:
$46,224
New York:
$19,609
(% of AGI for various income ranges: 131.6% for AGIs below $25k, 211.9% for AGIs $25k-50k, 234.6% for AGIs $50k-75k, 383.9% for AGIs $75k-100k, 1027.0% for AGIs $100k-200k, 7299.2% for AGIs over 200k)
Self-employed (Keogh) retirement plans: $43,294 (reported on 4.2% of returns)
10028:
$43,294
New York:
$32,497
(% of AGI for various income ranges: 23.5% for AGIs $25k-50k, 30.7% for AGIs $50k-75k, 37.1% for AGIs $75k-100k, 114.7% for AGIs $100k-200k, 3312.8% for AGIs over 200k)
Total itemized deductions: $95,559 (reported on 24.7% of returns)
Here:
$95,559
State:
$39,326
(% of AGI for various income ranges: 337.9% for AGIs below $25k, 435.9% for AGIs $25k-50k, 513.4% for AGIs $50k-75k, 708.6% for AGIs $75k-100k, 1699.1% for AGIs $100k-200k, 41458.8% for AGIs over 200k)
Charity contributions: $62,263 (reported on 22.2% of returns)
Here:
$62,263
State:
$15,420
(% of AGI for various income ranges: 19.3% for AGIs below $25k, 43.8% for AGIs $25k-50k, 67.1% for AGIs $50k-75k, 111.8% for AGIs $75k-100k, 319.1% for AGIs $100k-200k, 26849.2% for AGIs over 200k)
Taxes paid: $9,963 (reported on 24.7% of returns)
10028:
$9,963
State:
$9,183
(% of AGI for various income ranges: 99.6% for AGIs below $25k, 123.5% for AGIs $25k-50k, 139.2% for AGIs $50k-75k, 216.7% for AGIs $75k-100k, 517.5% for AGIs $100k-200k, 3116.7% for AGIs over 200k)
Earned income credit: $979 (reported on 2.6% of returns)
Here:
$979
State:
$2,138
(% of AGI for various income ranges: 26.0% for AGIs below $25k, 12.7% for AGIs $25k-50k)
Percentage of individuals using paid preparers for their 2020 taxes: 95.2%
Here:
95%
State:
95%
(% for various income ranges: 94.0% for AGIs below $25k, 94.1% for AGIs $25k-50k, 95.4% for AGIs $50k-75k, 95.0% for AGIs $75k-100k, 95.6% for AGIs $100k-200k, 96.2% for AGIs over 200k)
Averages for the 2012 tax year for zip code 10028, filed in 2013:
Average Adjusted Gross Income (AGI) in 2012: $339,877 (Individual Income Tax Returns)
Here:
$339,877
State:
$77,088
Salary/wage: $198,029 (reported on 76.8% of returns)
Here:
$198,029
State:
$60,593
(% of AGI for various income ranges: 57.2% for AGIs below $25k, 74.0% for AGIs $25k-50k, 79.7% for AGIs $50k-75k, 76.8% for AGIs $75k-100k, 70.3% for AGIs $100k-200k, 39.6% for AGIs over 200k)
Taxable interest for individuals: $15,513 (reported on 62.9% of returns)
This zip code:
$15,513
New York:
$3,125
(% of AGI for various income ranges: 4.3% for AGIs below $25k, 1.7% for AGIs $25k-50k, 1.1% for AGIs $50k-75k, 1.2% for AGIs $75k-100k, 1.4% for AGIs $100k-200k, 3.1% for AGIs over 200k)
Ordinary dividends: $37,405 (reported on 51.6% of returns)
Here:
$37,405
State:
$10,299
(% of AGI for various income ranges: 12.2% for AGIs below $25k, 4.8% for AGIs $25k-50k, 3.1% for AGIs $50k-75k, 3.6% for AGIs $75k-100k, 4.5% for AGIs $100k-200k, 5.9% for AGIs over 200k)
Net capital gain/loss in AGI: +$165,527 (reported on 46.7% of returns)
Here:
+$165,527
State:
+$42,474
(% of AGI for various income ranges: 0.2% for AGIs below $25k, 1.4% for AGIs $25k-50k, 0.7% for AGIs $50k-75k, 1.4% for AGIs $75k-100k, 2.6% for AGIs $100k-200k, 26.6% for AGIs over 200k)
Profit/loss from business: +$47,595 (reported on 20.2% of returns)
Here:
+$47,595
State:
+$16,168
(% of AGI for various income ranges: 15.7% for AGIs below $25k, 6.9% for AGIs $25k-50k, 4.4% for AGIs $50k-75k, 3.6% for AGIs $75k-100k, 4.9% for AGIs $100k-200k, 2.4% for AGIs over 200k)
Taxable individual retirement arrangement distribution: $52,084 (reported on 14.4% of returns)
10028:
$52,084
New York:
$17,621
(% of AGI for various income ranges: 5.5% for AGIs below $25k, 3.3% for AGIs $25k-50k, 2.5% for AGIs $50k-75k, 2.6% for AGIs $75k-100k, 4.5% for AGIs $100k-200k, 1.9% for AGIs over 200k)
Self-employment retirement plans: $40,133 (reported on 4.7% of returns)
10028:
$40,133
New York:
$27,330
(% of AGI for various income ranges: 0.3% for AGIs below $25k, 0.4% for AGIs $25k-50k, 0.3% for AGIs $50k-75k, 0.2% for AGIs $75k-100k, 0.6% for AGIs $100k-200k, 0.6% for AGIs over 200k)
Total itemized deductions: $100,972 (19% of AGI, reported on 62.2% of returns)
Here:
$100,972
State:
$34,985
Here:
19.3% of AGI
State:
21.3% of AGI
(% of AGI for various income ranges: 27.2% for AGIs below $25k, 13.5% for AGIs $25k-50k, 12.6% for AGIs $50k-75k, 16.3% for AGIs $75k-100k, 18.9% for AGIs $100k-200k, 18.8% for AGIs over 200k)
Charity contributions: $21,732 (reported on 52.7% of returns)
Here:
$21,732
State:
$5,572
(% of AGI for various income ranges: 1.5% for AGIs below $25k, 1.4% for AGIs $25k-50k, 1.3% for AGIs $50k-75k, 1.6% for AGIs $75k-100k, 1.9% for AGIs $100k-200k, 3.7% for AGIs over 200k)
Taxes paid: $65,590 (reported on 61.9% of returns)
10028:
$65,590
State:
$18,656
(% of AGI for various income ranges: 8.1% for AGIs below $25k, 4.5% for AGIs $25k-50k, 6.0% for AGIs $50k-75k, 9.6% for AGIs $75k-100k, 10.9% for AGIs $100k-200k, 12.5% for AGIs over 200k)
Earned income credit: $981 (reported on 3.2% of returns)
Here:
$981
State:
$2,230
(% of AGI for various income ranges: 1.3% for AGIs below $25k)
Percentage of individuals using paid preparers for their 2012 taxes: 68.3%
Here:
68%
State:
66%
(% for various income ranges: 66.4% for AGIs below $25k, 60.1% for AGIs $25k-50k, 57.2% for AGIs $50k-75k, 61.6% for AGIs $75k-100k, 68.8% for AGIs $100k-200k, 85.7% for AGIs over 200k)
Averages for the 2004 tax year for zip code 10028, filed in 2005:
Average Adjusted Gross Income (AGI) in 2004: $227,502 (Individual Income Tax Returns)
Here:
$227,502
State:
$59,519
Salary/wage: $163,556 (reported on 76.0% of returns)
Here:
$163,556
State:
$50,673
(% of AGI for various income ranges: 61.6% for AGIs $10k-25k, 80.0% for AGIs $25k-50k, 80.9% for AGIs $50k-75k, 77.1% for AGIs $75k-100k, 50.1% for AGIs over 100k)
Taxable interest for individuals: $10,180 (reported on 71.2% of returns)
This zip code:
$10,180
New York:
$2,377
(% of AGI for various income ranges: 5.6% for AGIs $10k-25k, 2.4% for AGIs $25k-50k, 2.0% for AGIs $50k-75k, 1.8% for AGIs $75k-100k, 3.0% for AGIs over 100k)
Taxable dividends: $19,013 (reported on 54.3% of returns)
Here:
$19,013
State:
$5,394
(% of AGI for various income ranges: 7.7% for AGIs $10k-25k, 3.8% for AGIs $25k-50k, 2.5% for AGIs $50k-75k, 3.3% for AGIs $75k-100k, 4.4% for AGIs over 100k)
Net capital gain/loss: +$100,598 (reported on 48.8% of returns)
Here:
+$100,598
State:
+$23,581
(% of AGI for various income ranges: 0.9% for AGIs $10k-25k, 1.7% for AGIs $25k-50k, 1.0% for AGIs $50k-75k, 1.6% for AGIs $75k-100k, 23.5% for AGIs over 100k)
Profit/loss from business: +$37,348 (reported on 20.8% of returns)
Here:
+$37,348
State:
+$13,809
(% of AGI for various income ranges: 12.6% for AGIs $10k-25k, 5.8% for AGIs $25k-50k, 4.0% for AGIs $50k-75k, 4.7% for AGIs $75k-100k, 3.1% for AGIs over 100k)
IRA payment deduction: $3,248 (reported on 4.0% of returns)
10028:
$3,248
New York:
$3,115
(% of AGI for various income ranges: 0.5% for AGIs $10k-25k, 0.5% for AGIs $25k-50k, 0.2% for AGIs $50k-75k, 0.2% for AGIs $75k-100k, 0.0% for AGIs over 100k)
Self-employed pension: $28,984 (reported on 5.2% of returns)
Here:
$28,984
New York:
$19,016
(% of AGI for various income ranges: 0.6% for AGIs $10k-25k, 0.4% for AGIs $25k-50k, 0.4% for AGIs $50k-75k, 0.5% for AGIs $75k-100k, 0.7% for AGIs over 100k)
Total itemized deductions: $69,548 (19% of AGI, reported on 60.3% of returns)
Here:
$69,548
State:
$25,864
Here:
18.9% of AGI
State:
21.9% of AGI
(% of AGI for various income ranges: 23.7% for AGIs $10k-25k, 13.6% for AGIs $25k-50k, 17.2% for AGIs $50k-75k, 18.2% for AGIs $75k-100k, 18.1% for AGIs over 100k)
Charity contributions deductions: $17,732 (5% of AGI, reported on 54.7% of returns)
Here:
$17,732
State:
$4,439
Here:
4.5% of AGI
State:
3.6% of AGI
(% of AGI for various income ranges: 2.1% for AGIs $10k-25k, 1.8% for AGIs $25k-50k, 2.2% for AGIs $50k-75k, 2.3% for AGIs $75k-100k, 4.4% for AGIs over 100k)
Total tax: $58,119 (reported on 88.5% of returns)
10028:
$58,119
State:
$11,730
(% of AGI for various income ranges: 6.5% for AGIs $10k-25k, 10.3% for AGIs $25k-50k, 13.4% for AGIs $50k-75k, 15.0% for AGIs $75k-100k, 23.3% for AGIs over 100k)
Earned income credit: $713 (reported on 2.9% of returns)
Here:
$713
State:
$1,757
Percentage of individuals using paid preparers for their 2004 taxes: 71.7%
Here:
72%
State:
67%
(% for various income ranges: 71.0% for AGIs below $10k, 67.0% for AGIs $10k-25k, 62.7% for AGIs $25k-50k, 66.4% for AGIs $50k-75k, 71.1% for AGIs $75k-100k, 81.6% for AGIs over 100k)
Likely homosexual households (counted as self-reported same-sex unmarried-partner households)
Lesbian couples: 0.5% of all households
Gay men: 0.1% of all households
Household received Food Stamps/SNAP in the past 12 months: 969 Household did not receive Food Stamps/SNAP in the past 12 months: 23,653
Women who had a birth in the past 12 months: 577 (544 now married, 25 unmarried) Women who did not have a birth in the past 12 months: 11,039 (3,875 now married, 7,170 unmarried)
Housing units in zip code 10028 with a mortgage: 3,906 (129 second mortgage, 16 home equity loan, 74 both second mortgage and home equity loan) Houses without a mortgage: 35
Median monthly owner costs for units with a mortgage: $3,860 Median monthly owner costs for units without a mortgage: $1,487
Residents with income below the poverty level in 2022:
This zip code:
5.4%
Whole state:
14.3%
Residents with income below 50% of the poverty level in 2022:
This zip code:
1.7%
Whole state:
6.8%
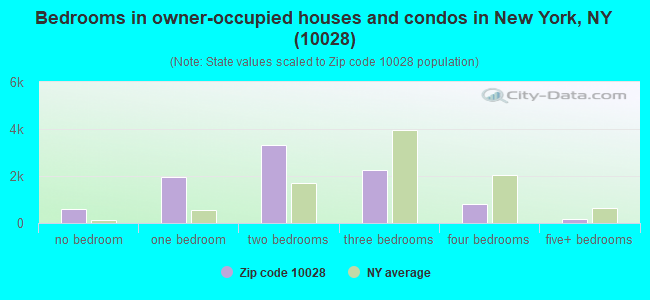
Median number of rooms in houses and condos:
Here:
4.5
State:
6.3
Median number of rooms in apartments:
Here:
2.9
State:
3.8
Notable locations in this zip code not listed on our city pages
Notable locations in zip code 10028: New York City Board of Higher Education Headquarters (A), Sabarsky Museum of German Expressionist Art (B), Town Club (C), Liederkranz Club (D), East 86th Street Cinemas (E), Taft Day Care Center (F), Fire Department New York Engine 22 Ladder 13 Battalion 10 (G). Display/hide their locations on the map
Churches in zip code 10028 include: South Reformed Church (A), Saint Joseph's Catholic Church of Yorkville (B), Zion Saint Mark's Church (C), Saint Elizabeth of Hungary Roman Catholic Church (D), Saint Stephen of Hungary Church (E), Park Avenue Synagogue (F), Park Avenue Christian Church (G), Church of Saint Ignatius Loyola (H). Display/hide their locations on the map
Tourist attractions (not listed on the city page) : American Friends of the Shanghai Museum Inc (530 East 86th Street), Czech National Tourist Office (1109 Madison Avenue).
5,213 married couples with children.
707 single-parent households (286 men, 421 women).
80.1% of residents of 10028 zip code speak English at home.
5.5% of residents speak Spanish at home (75% very well, 11% well, 14% not well).
9.3% of residents speak other Indo-European language at home (87% very well, 11% well, 2% not well).
4.1% of residents speak Asian or Pacific Island language at home (72% very well, 20% well, 8% not well, 1% not at all).
1.3% of residents speak other language at home (65% very well, 35% well).
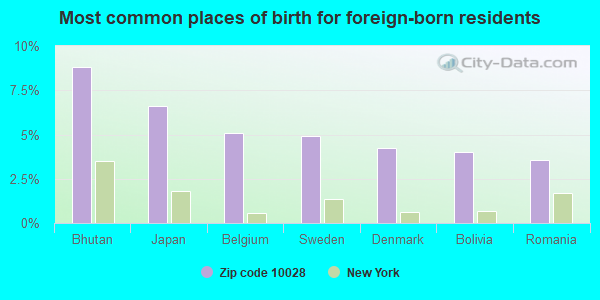
Foreign born population: 8,352 (18.6%) (56.7% of them are naturalized citizens)
Major facilities with environmental interests located in this zip code:
400 EAST 85 STREET BUILDING (400 EAST 85TH ST in MANHATTAN, NY)
AIR MINOR (AIRS/AFS) STATE MASTER (New York facility tracking) - AIR PROGRAM Business SIC classification: OPERATORS OF APARTMENT BUILDINGS Business NAICS classification: LESSORS OF RESIDENTIAL BUILDINGS AND DWELLINGS. Organizations: KEY REALTY, 400 E 85 OWNERS INC (LEGALLY RESPONSIBLE PARTY)
1036 PARK AVE BUILDING (1036 PARK AVE in MANHATTAN, NY)
AIR SYNTHETIC MINOR (AIRS/AFS) STATE MASTER (New York facility tracking) - AIR PROGRAM Business SIC classification: OPERATORS OF APARTMENT BUILDINGS Business NAICS classification: LESSORS OF RESIDENTIAL BUILDINGS AND DWELLINGS. Organizations: CHARLES H GREENTHAL MGMT CORP, 1036 PARK CORPORATION (LEGALLY RESPONSIBLE PARTY)
145 EAST 84 STREET BUILDING (145 EAST 84 STREET in NEW YORK, NY)
AIR MINOR (AIRS/AFS) STATE MASTER (New York facility tracking) - AIR PROGRAM, Business SIC classification: OPERATORS OF DWELLINGS OTHER THAN APARTMENT BUILDINGS Business NAICS classification: LESSORS OF RESIDENTIAL BUILDINGS AND DWELLINGS. Organizations: 145 EAST 84TH OWNERS CORP (LEGALLY RESPONSIBLE PARTY)
200 EAST 84TH ST BUILDING (200 EAST 84 STREET in NEW YORK CITY, NY)
AIR MINOR (AIRS/AFS) STATE MASTER (New York facility tracking) - AIR PROGRAM Business SIC classification: OPERATORS OF APARTMENT BUILDINGS Business NAICS classification: LESSORS OF RESIDENTIAL BUILDINGS AND DWELLINGS. Organizations: 200 EAST 84 STREET OWNERS CORP (LEGALLY RESPONSIBLE PARTY)
Alternative names: 200 EAST 84 STREET BUILDING
500 E 83RD ST BUILDING (500 E 83RD ST in NEW YORK, NY)
AIR SYNTHETIC MINOR (AIRS/AFS) STATE MASTER (New York facility tracking) - AIR PROGRAM Business SIC classification: OPERATORS OF APARTMENT BUILDINGS Business NAICS classification: LESSORS OF RESIDENTIAL BUILDINGS AND DWELLINGS. Organizations: 500 EAST 83RD STREET CORP (AIR PERMITTING FACILITY OWNER CONTACT)
1058 CORP (1056 5TH AVE in NEW YORK CITY, NY)
AIR SYNTHETIC MINOR (AIRS/AFS) STATE MASTER (New York facility tracking) - AIR PROGRAM CRITERIA AND HAZARDOUS AIR POLLUTANT INVENTORY (Inventory of air pollution sources) Business SIC classification: OPERATORS OF APARTMENT BUILDINGS Business NAICS classification: LESSORS OF RESIDENTIAL BUILDINGS AND DWELLINGS.
110 EAST END AVENUE BUILDING (110 EAST END AVENUE in NEW YORK CITY, NY)
AIR SYNTHETIC MINOR (AIRS/AFS) STATE MASTER (New York facility tracking) - AIR PROGRAM Business SIC classification: OPERATORS OF APARTMENT BUILDINGS Business NAICS classification: LESSORS OF RESIDENTIAL BUILDINGS AND DWELLINGS. Organizations: 3950 BLACKSTONE ASSOCIATES (LEGALLY RESPONSIBLE PARTY)
, 110 EAST END AVENUE ASSOCIATES (LEGALLY RESPONSIBLE PARTY)
Alternative names: WEINREB MANAGEMENT
960 PARK AVENUE BUILDING (960 PARK AVENUE in NEW YORK CITY, NY)
AIR SYNTHETIC MINOR (AIRS/AFS) STATE MASTER (New York facility tracking) - AIR PROGRAM Business SIC classification: OPERATORS OF APARTMENT BUILDINGS Business NAICS classification: LESSORS OF RESIDENTIAL BUILDINGS AND DWELLINGS. Organizations: BROWN HARRIS STEVENS LLC (LEGALLY RESPONSIBLE PARTY)
, 960 PARK AVENUE CORP (LEGALLY RESPONSIBLE PARTY)
Alternative names: 960 PARK AVENUE CORPORATION
240 E 82ND ST BUILDING (240 E 82ND ST in NEW YORK CITY, NY)
AIR SYNTHETIC MINOR (AIRS/AFS) STATE MASTER (New York facility tracking) - AIR PROGRAM Business SIC classification: OPERATORS OF APARTMENT BUILDINGS; OPERATORS OF DWELLINGS OTHER THAN APARTMENT BUILDINGS Organizations: SOLIL MANAGEMENT CORP (AIR PERMITTING FACILITY OWNER CONTACT)
250 E 87TH ST BUILDING (250 E 87TH ST in NEW YORK, NY)
AIR SYNTHETIC MINOR (AIRS/AFS) STATE MASTER (New York facility tracking) - AIR FACILITY REGISTRATION, AIR PROGRAM Business SIC classification: OPERATORS OF APARTMENT BUILDINGS Organizations: CHARLES H GREENTHAL MGMT CORP, 250 E 87 OWNERS CORP
401 E 86TH ST BUILDING (401 E 86TH ST in NEW YORK CITY, NY)
AIR SYNTHETIC MINOR (AIRS/AFS) STATE MASTER (New York facility tracking) - AIR PROGRAM Business SIC classification: OPERATORS OF APARTMENT BUILDINGS Business NAICS classification: LESSORS OF RESIDENTIAL BUILDINGS AND DWELLINGS. Organizations: ROYAL YORK OWNERS CORP (LEGALLY RESPONSIBLE PARTY)
, FAIRMONT TENANTS CORP (LEGALLY RESPONSIBLE PARTY)
445 E 86TH ST BUILDING (445 E 86TH ST in NEW YORK CITY, NY)
AIR SYNTHETIC MINOR (AIRS/AFS) STATE MASTER (New York facility tracking) - AIR PROGRAM Business SIC classification: OPERATORS OF APARTMENT BUILDINGS Business NAICS classification: LESSORS OF RESIDENTIAL BUILDINGS AND DWELLINGS. Organizations: DARWOOD MANAGEMENT (LEGALLY RESPONSIBLE PARTY)
, 445/86 OWNERS CORP (LEGALLY RESPONSIBLE PARTY)
975 PARK AVE BUILDING (975 PARK AVE in NEW YORK, NY)
AIR SYNTHETIC MINOR (AIRS/AFS) STATE MASTER (New York facility tracking) - AIR FACILITY REGISTRATION, AIR PROGRAM Business SIC classification: OPERATORS OF APARTMENT BUILDINGS Organizations: CHARLES H GREENTHAL MGMT CORP, 975 PARK AVENUE CORPORATION
Housing units lacking complete plumbing facilities: 0.9% Housing units lacking complete kitchen facilities: 0.3%
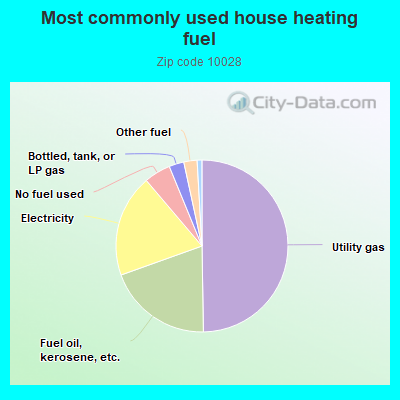
49.8%Utility gas
19.8%Fuel oil, kerosene, etc.
19.3%Electricity
5.0%No fuel used
2.8%Bottled, tank, or LP gas
2.5%Other fuel
0.9%Coal or coke
Population in 1990: 42,757. Population change in the 1990s: +2,230 (+5.2%).
Place of birth for U.S.-born residents:
This state: 21,637
Northeast: 6,647
Midwest: 2,445
South: 2,846
West: 2,538
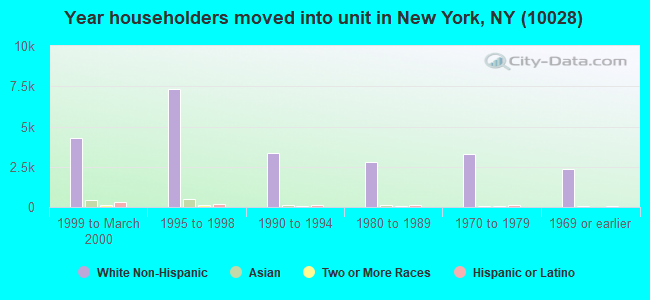
57% of the 10028 zip code residents lived in the same house 5 years ago. Out of people who lived in different houses, 44% lived in this county. Out of people who lived in different counties, 50% lived in New York.
85% of the 10028 zip code residents lived in the same house 1 year ago. Out of people who lived in different houses, 64% moved from this county. Out of people who lived in different houses, 14% moved from different county within same state. Out of people who lived in different houses, 17% moved from different state. Out of people who lived in different houses, 5% moved from abroad.
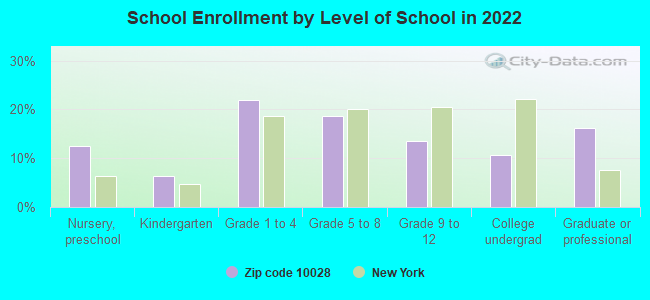
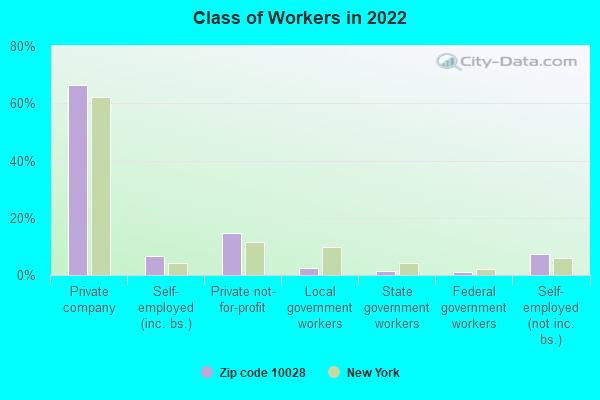
Private vs. public school enrollment:
Students in private schools in grades 1 to 8 (elementary and middle school): 1,540
Here:
50.8%
New York:
15.6%
Students in private schools in grades 9 to 12 (high school): 596
Here:
58.8%
New York:
15.0%
Students in private undergraduate colleges: 701
Here:
86.0%
New York:
39.2%
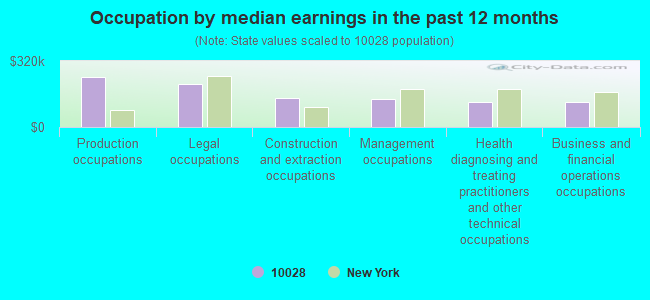
Occupation by median earnings in the past 12 months ($)
242,175Production occupations
207,443Legal occupations
140,415Construction and extraction occupations
137,092Management occupations
121,968Health diagnosing and treating practitioners and other technical occupations
119,784Business and financial operations occupations
Companies with federal contracts located in this zip code:
WAYLAND AUDIO-VISUAL ENTERPRIS (210 E 86TH ST, STE 406 in NEW YORK, NY; small business)
$9,997 with Army for Books and Pamphlets. Signed on 2005-06-09. Completion date: 2005-07-01.
Top industries in this zip code by the number of employees in 2005:
Health Care and Social Assistance: Offices of Physicians (except Mental Health Specialists) (20-49: 5, 10-19: 21, 5-9: 50, 1-4: 146)
Other Services (except Public Administration): Other Similar Organizations (except Business, Professional, Labor, and Political Organizations) (20-49: 2, 10-19: 42, 5-9: 33, 1-4: 32)
Real Estate and Rental and Leasing: Lessors of Residential Buildings and Dwellings (20-49: 5, 10-19: 27, 5-9: 14, 1-4: 109)
Other Services (except Public Administration): Religious Organizations (100-249: 2, 50-99: 1, 20-49: 4, 10-19: 4, 5-9: 4, 1-4: 5)
People in group quarters in 2010:
78 people in emergency and transitional shelters (with sleeping facilities) for people experiencing homelessness
61 people in other noninstitutional facilities
11 people in group homes for juveniles (non-correctional)
8 people in group homes intended for adults
People in group quarters in 2000:
46 people in other nonhousehold living situations
42 people in religious group quarters
29 people in unknown juvenile institutions
26 people in homes for the mentally ill
23 people in other group homes
8 people in other noninstitutional group quarters
Fatal accident statistics in 2014:
Fatal accident count: 1
Vehicles involved in fatal accidents: 1
Fatal accidents caused by drunken drivers: 0
Fatalities: 1
Persons involved in fatal accidents: 1
Pedestrians involved in fatal accidents: 1
Fatal accident statistics in 2012:
Fatal accident count: 3
Vehicles involved in fatal accidents: 6
Fatal accidents caused by drunken drivers: 0
Fatalities: 3
Persons involved in fatal accidents: 7
Pedestrians involved in fatal accidents: 2
Home Mortgage Disclosure Act Aggregated Statistics For Year 2009 (Based on 4 full and 14 partial tracts)
A) FHA, FSA/RHS & VA Home Purchase Loans
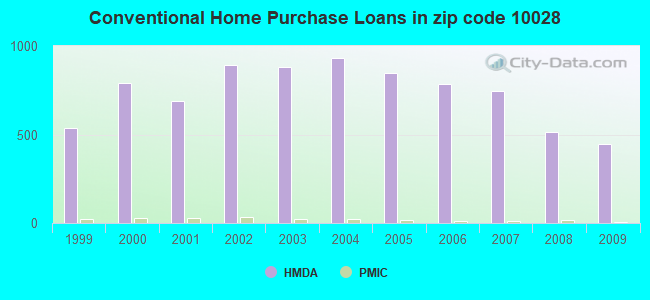
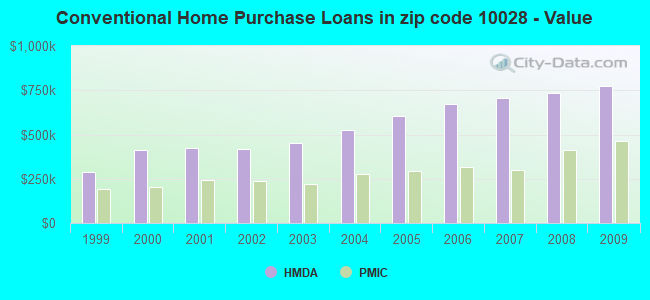
B) Conventional Home Purchase Loans
C) Refinancings
D) Home Improvement Loans
E) Loans on Dwellings For 5+ Families
F) Non-occupant Loans on < 5 Family Dwellings (A B C & D)
Number
Average Value
Number
Average Value
Number
Average Value
Number
Average Value
Number
Average Value
Number
Average Value
LOANS ORIGINATED
0
$0
448
$775,539
1,027
$495,389
23
$308,127
35
$2,240,911
128
$614,549
APPLICATIONS APPROVED, NOT ACCEPTED
0
$0
84
$1,051,713
90
$659,715
4
$356,640
0
$0
17
$517,624
APPLICATIONS DENIED
1
$784,180
134
$822,000
294
$577,831
12
$199,787
2
$3,280,350
60
$526,415
APPLICATIONS WITHDRAWN
0
$0
72
$893,650
129
$526,041
7
$777,194
0
$0
31
$572,328
FILES CLOSED FOR INCOMPLETENESS
0
$0
33
$851,547
54
$659,593
5
$247,768
0
$0
11
$590,212
Aggregated Statistics For Year 2008 (Based on 4 full and 14 partial tracts)
B) Conventional Home Purchase Loans
C) Refinancings
D) Home Improvement Loans
E) Loans on Dwellings For 5+ Families
F) Non-occupant Loans on < 5 Family Dwellings (A B C & D)
Number
Average Value
Number
Average Value
Number
Average Value
Number
Average Value
Number
Average Value
LOANS ORIGINATED
512
$731,867
300
$679,187
22
$533,267
39
$3,064,921
98
$612,038
APPLICATIONS APPROVED, NOT ACCEPTED
131
$906,428
48
$518,682
4
$487,340
3
$1,394,217
25
$852,738
APPLICATIONS DENIED
172
$811,532
101
$892,053
13
$390,485
2
$1,635,300
43
$621,609
APPLICATIONS WITHDRAWN
90
$897,297
51
$925,663
4
$110,445
3
$2,319,963
23
$738,858
FILES CLOSED FOR INCOMPLETENESS
26
$1,247,178
24
$960,561
1
$1,102,690
0
$0
10
$757,655
Aggregated Statistics For Year 2007 (Based on 4 full and 14 partial tracts)
B) Conventional Home Purchase Loans
C) Refinancings
D) Home Improvement Loans
E) Loans on Dwellings For 5+ Families
F) Non-occupant Loans on < 5 Family Dwellings (A B C & D)
Number
Average Value
Number
Average Value
Number
Average Value
Number
Average Value
Number
Average Value
LOANS ORIGINATED
747
$707,746
253
$837,732
30
$499,791
53
$3,439,707
129
$604,024
APPLICATIONS APPROVED, NOT ACCEPTED
168
$777,710
55
$880,983
10
$137,429
4
$2,991,480
25
$483,145
APPLICATIONS DENIED
142
$656,571
115
$877,038
18
$304,928
3
$6,507,813
42
$404,296
APPLICATIONS WITHDRAWN
87
$956,706
48
$959,410
2
$702,890
1
$3,419,400
24
$598,829
FILES CLOSED FOR INCOMPLETENESS
26
$895,860
14
$1,007,821
3
$335,523
0
$0
3
$329,513
Aggregated Statistics For Year 2006 (Based on 4 full and 14 partial tracts)
B) Conventional Home Purchase Loans
C) Refinancings
D) Home Improvement Loans
E) Loans on Dwellings For 5+ Families
F) Non-occupant Loans on < 5 Family Dwellings (A B C & D)
Number
Average Value
Number
Average Value
Number
Average Value
Number
Average Value
Number
Average Value
LOANS ORIGINATED
788
$672,972
292
$771,955
24
$494,326
41
$4,512,618
156
$696,816
APPLICATIONS APPROVED, NOT ACCEPTED
144
$641,535
54
$962,791
12
$351,326
1
$725,000
26
$638,137
APPLICATIONS DENIED
100
$584,090
88
$717,965
20
$513,686
1
$2,531,610
42
$556,237
APPLICATIONS WITHDRAWN
124
$770,171
49
$1,654,302
5
$244,668
2
$6,325,020
28
$777,471
FILES CLOSED FOR INCOMPLETENESS
22
$547,074
19
$630,069
0
$0
0
$0
4
$309,875
Aggregated Statistics For Year 2005 (Based on 4 full and 14 partial tracts)
B) Conventional Home Purchase Loans
C) Refinancings
D) Home Improvement Loans
E) Loans on Dwellings For 5+ Families
F) Non-occupant Loans on < 5 Family Dwellings (A B C & D)
Number
Average Value
Number
Average Value
Number
Average Value
Number
Average Value
Number
Average Value
LOANS ORIGINATED
849
$602,339
449
$671,990
47
$540,284
63
$2,812,484
155
$493,019
APPLICATIONS APPROVED, NOT ACCEPTED
138
$637,074
68
$773,205
10
$150,254
0
$0
25
$602,663
APPLICATIONS DENIED
174
$543,409
121
$673,790
24
$281,299
1
$341,940
36
$331,760
APPLICATIONS WITHDRAWN
130
$899,486
62
$917,739
12
$443,162
6
$9,283,200
30
$602,301
FILES CLOSED FOR INCOMPLETENESS
45
$601,524
36
$438,373
3
$170,587
0
$0
11
$876,208
Aggregated Statistics For Year 2004 (Based on 4 full and 14 partial tracts)
B) Conventional Home Purchase Loans
C) Refinancings
D) Home Improvement Loans
E) Loans on Dwellings For 5+ Families
F) Non-occupant Loans on < 5 Family Dwellings (A B C & D)
G) Loans On Manufactured Home Dwelling (A B C & D)
Number
Average Value
Number
Average Value
Number
Average Value
Number
Average Value
Number
Average Value
Number
Average Value
LOANS ORIGINATED
933
$527,311
560
$508,234
30
$528,730
43
$1,692,169
150
$497,486
0
$0
APPLICATIONS APPROVED, NOT ACCEPTED
173
$697,335
107
$521,898
8
$191,410
3
$1,478,893
23
$343,047
0
$0
APPLICATIONS DENIED
184
$469,162
138
$454,963
20
$266,025
1
$1,974,500
42
$408,337
1
$30,000
APPLICATIONS WITHDRAWN
111
$682,397
71
$573,529
9
$179,400
5
$743,344
25
$447,154
0
$0
FILES CLOSED FOR INCOMPLETENESS
29
$566,494
13
$479,442
3
$159,560
0
$0
7
$288,797
0
$0
Aggregated Statistics For Year 2003 (Based on 4 full and 14 partial tracts)
B) Conventional Home Purchase Loans
C) Refinancings
D) Home Improvement Loans
E) Loans on Dwellings For 5+ Families
F) Non-occupant Loans on < 5 Family Dwellings (A B C & D)
Number
Average Value
Number
Average Value
Number
Average Value
Number
Average Value
Number
Average Value
LOANS ORIGINATED
883
$453,087
2,071
$367,510
5
$128,726
61
$2,833,812
207
$429,342
APPLICATIONS APPROVED, NOT ACCEPTED
133
$565,783
230
$433,971
2
$20,920
4
$1,669,660
22
$325,894
APPLICATIONS DENIED
152
$512,104
273
$416,218
6
$97,748
3
$3,082,027
40
$407,858
APPLICATIONS WITHDRAWN
63
$474,260
150
$390,798
4
$91,015
0
$0
20
$249,730
FILES CLOSED FOR INCOMPLETENESS
31
$364,541
85
$361,150
0
$0
0
$0
8
$188,471
Aggregated Statistics For Year 2002 (Based on 4 full and 14 partial tracts)
B) Conventional Home Purchase Loans
C) Refinancings
D) Home Improvement Loans
E) Loans on Dwellings For 5+ Families
F) Non-occupant Loans on < 5 Family Dwellings (A B C & D)
Number
Average Value
Number
Average Value
Number
Average Value
Number
Average Value
Number
Average Value
LOANS ORIGINATED
895
$417,535
1,347
$414,078
10
$56,156
48
$1,843,254
117
$416,901
APPLICATIONS APPROVED, NOT ACCEPTED
180
$459,615
173
$390,844
0
$0
1
$239,360
19
$403,818
APPLICATIONS DENIED
131
$356,444
170
$502,957
14
$75,370
4
$2,789,478
28
$320,239
APPLICATIONS WITHDRAWN
99
$537,632
126
$455,662
4
$130,490
5
$1,726,644
12
$404,573
FILES CLOSED FOR INCOMPLETENESS
39
$405,402
57
$440,965
2
$49,590
0
$0
8
$354,770
Aggregated Statistics For Year 2001 (Based on 4 full and 14 partial tracts)
B) Conventional Home Purchase Loans
C) Refinancings
D) Home Improvement Loans
E) Loans on Dwellings For 5+ Families
F) Non-occupant Loans on < 5 Family Dwellings (A B C & D)
Number
Average Value
Number
Average Value
Number
Average Value
Number
Average Value
Number
Average Value
LOANS ORIGINATED
688
$424,157
659
$432,813
12
$137,704
51
$1,448,191
93
$383,186
APPLICATIONS APPROVED, NOT ACCEPTED
117
$446,009
100
$462,468
1
$520,770
0
$0
13
$243,395
APPLICATIONS DENIED
93
$418,815
132
$714,311
25
$195,928
3
$566,520
15
$1,202,308
APPLICATIONS WITHDRAWN
54
$450,518
81
$588,904
8
$35,719
3
$1,929,083
10
$327,664
FILES CLOSED FOR INCOMPLETENESS
20
$280,246
31
$290,988
2
$14,295
1
$291,930
0
$0
Aggregated Statistics For Year 2000 (Based on 4 full and 14 partial tracts)
B) Conventional Home Purchase Loans
C) Refinancings
D) Home Improvement Loans
E) Loans on Dwellings For 5+ Families
F) Non-occupant Loans on < 5 Family Dwellings (A B C & D)
Number
Average Value
Number
Average Value
Number
Average Value
Number
Average Value
Number
Average Value
LOANS ORIGINATED
789
$414,841
181
$394,803
25
$100,112
33
$2,994,328
48
$252,309
APPLICATIONS APPROVED, NOT ACCEPTED
152
$450,147
38
$841,483
6
$21,950
0
$0
6
$395,063
APPLICATIONS DENIED
116
$493,211
81
$650,678
17
$72,891
4
$1,664,855
17
$211,769
APPLICATIONS WITHDRAWN
92
$486,789
51
$687,720
8
$79,534
10
$2,726,154
11
$152,934
FILES CLOSED FOR INCOMPLETENESS
15
$282,612
14
$432,365
11
$134,318
0
$0
1
$72,820
Aggregated Statistics For Year 1999 (Based on 4 full and 7 partial tracts)
B) Conventional Home Purchase Loans
C) Refinancings
D) Home Improvement Loans
E) Loans on Dwellings For 5+ Families
F) Non-occupant Loans on < 5 Family Dwellings (A B C & D)
2007 - 2018 National Fire Incident Reporting System (NFIRS) incidents
Based on the data from the years 2007 - 2018 the average number of fires per year is 109. The highest number of reported fire incidents - 147 took place in 2008, and the least - 83 in 2007. The data has a rising trend.
When looking into fire subcategories, the most reports belonged to: Structure Fires (73.8%), and Outside Fires (18.7%).
Fire incident types reported to NFIRS in Zip Code 10028


 Nearest zip codes: 10075, 10128, 10162, 10021, 10044, 10065.


 Based on the data from the years 2007 - 2018 the average number of fires per year is 109. The highest number of reported fire incidents - 147 took place in 2008, and the least - 83 in 2007. The data has a rising trend.
 When looking into fire subcategories, the most reports belonged to: Structure Fires (73.8%), and Outside Fires (18.7%).